Jan 1, 2015 - combustion; therefore only minor fuel processing is required and, ..... Sea-water scrubbing is a case of wet flue gas desulphurisation (FGD).
SKEMA Grant Agreement No. TREN/FP7/TR/218565/”SKEMA”
Deliverables: Task-2: ‘Impact Study of the future requirements of Annex VI of the MARPOL Convention on Short Sea Shipping’ Periodic Study Periodic Study Start Date:
April 15th 2009
End Date:
February 2010
Periodic Study Co-ordinator: Deliverable No: WP No: Due date: Submission date:
Task-2 of 3 3 February 2010 June 2010
NECL Document type:
Report
WP Leader:
UGOT
Dissemination Level:
Public
Distribution Group:
A Project supported by the European Commission. Directorate-General for Energy and Transport.
SKEMA –– Impact study on the future requirements of MARPOL Annex VI
Document summary information Person
Role
Org.
Project Role
James Kehoe
Author
NECL
Coordinator
Zoi Nikopoulou
Author
UGOT
Participant
Mary Liddane
Author
NECL
Participant
Linda Ramstedt
Contributor
BIT/Vectura
Consultant
Ioannis G. Koliousis
Contributor
AUEB
Participant
Quality Control Who Checked by WP Leader
Johan Woxenius
Checked by Quality Manager
Antti Permala
Approved by Project Manager
Dr. Takis Katsoulakos
Date 30th October 2009
Disclaimer The content of the publication herein is the sole responsibility of the authors and it does not necessarily represent the views expressed by the European Commission or its services. While the information contained in the document is believed to be accurate, the authors or any other participant in the SKEMA consortium make no warranty of any kind with regard to this material. Neither the SKEMA Consortium nor any of its members, their officers, employees or agents shall be responsible or liable for negligence or in respect of any inaccuracy or omission, or for any direct or indirect or consequential loss or damage caused by or arising from any information herein.
© SKEMA
Page 2
3rd June 2010
SKEMA –– Impact study on the future requirements of MARPOL Annex VI
Executive Summary This study looks at the impact of the MARPOL Annex VI amendments on the roll-on roll-off (RoRo) and lift-on lift-off (LoLo) short sea shipping (SSS) industry within the Baltic and North Seas. This was achieved through the use of two transportation models. The TAPAS agent based model of Blekinge Institute of Technology (BIT) for the LoLo market and the NECL model of Nautical Enterprise Ltd. for the RoRo market. The scenarios modelled include the full introduction of infrastructural and environmental road tolls (Eurovignettes) and the utilisation of sea water scrubbers instead of low sulphur fuel. The NECL model, which examined a sample of RoRo routes in Northern Europe, predicts an approximate 10% loss in cargo volumes from RoRo to road/rail alternatives as a result of the introduction of the 2015 MARPOL sulphur limit of 0.1%. It also found that the full implementation of the infrastructural and environmental Eurovignettes do not offset the impact of the 2015 MARPOL sulphur limit of 0.1%. The TAPAS model, which examined a smaller sample of LoLo routes in Northern Europe, also predicts a transfer of cargo from LoLo transportation to land based transportation. It was found that for RoRo ships the utilisation of seawater scrubbers could theoretically offset the impact of the 2015 MARPOL sulphur limit of 0.1%. Scrubber technology however is still at the pilot implementation stage and has not been proven over longer time periods. RoRo industry leaders have expressed severe reservations about this option due to the number of unknowns involved and the feasibility of retrofitting this technology into northern Europe’s short sea shipping fleet by the year 2015.
© SKEMA
Page 3
3rd June 2010
SKEMA –– Impact study on the future requirements of MARPOL Annex VI
Contents: 1
OBJECTIVES...............................................................................................................................6
2
INTRODUCTION..........................................................................................................................7
3
IMPACT OF THE USE OF LOW SULPHUR FUELS ON THE COSTS OF SHIPPING.........9 3.1 3.2 3.3
AVAILABILITY OF LOW SULPHUR FUEL .....................................................................................9 SINGLE FUEL OPERATION .....................................................................................................10 DUAL FUEL OPERATION (BLENDING) .....................................................................................14
IMPACT OF INSTALLING SULPHUR ABATING TECHNOLOGIES ...................................17
4
4.1 4.2 4.3 4.4 4.5 4.6 4.7 5
FRESHWATER (CLOSED-CIRCUIT SCRUBBERS).....................................................................17 SEA W ATER SCRUBBERS ......................................................................................................17 EARLY ON-BOARD TRIALS ....................................................................................................17 THE CHEMICAL PROCESS .....................................................................................................19 DISCHARGE W ATER FROM SCRUBBING .................................................................................20 FIXED AND OPERATING COSTS .............................................................................................21 AVAILABLE SCRUBBERS BY MANUFACTURER ........................................................................22
UNIT PRICE IMPACT AS A RESULT OF MARPOL ANNEX VI...........................................24 5.1 5.2 5.3 5.4 5.5
INPUTS AND ASSUMPTIONS COMMON TO TAPAS & NECL MODELS .....................................24 INPUTS AND ASSUMPTIONS SPECIFIC TO THE TAPAS MODEL ..............................................29 INPUTS AND ASSUMPTIONS SPECIFIC TO THE NECL MODEL .................................................32 TAPAS RESULT ...................................................................................................................36 NECL MODEL RESULT .........................................................................................................37
EMISSIONS IMPACT AS A RESULT OF MARPOL ANNEX VI ...........................................42
6
6.1 6.2 6.3 6.4
CO2 EMISSIONS ....................................................................................................................42 SO2 EMISSIONS ....................................................................................................................43 NOX EMISSIONS ....................................................................................................................44 PM EMISSIONS .....................................................................................................................45
DISCUSSION .............................................................................................................................46
7
7.1 7.2 7.3 7.4
ROUTES R1 – R4..................................................................................................................46 ROUTES R5 & R6 .................................................................................................................47 ROUTES R7 & R8 .................................................................................................................48 ROUTES R9 & R10 ...............................................................................................................48
8
CONCLUSIONS.........................................................................................................................49
9
REFERENCES...........................................................................................................................51
10
APPENDIX – A: SEA WATER SCRUBBERS INFORMATION.........................................54
11
APPENDIX – B: NECL MODEL INPUTS ............................................................................55
12
APPENDIX – C: SAMPLE CALCULATION OF CO2 EMITTED BY SHIP........................56
13
APPENDIX – D: SAMPLE CALCULATION OF SO2 EMITTED BY SHIP ........................57
14
APPENDIX – E: SAMPLE CALCULATION OF NOX EMITTED BY SHIP........................58
15
APPENDIX – F: AVERAGE BASE CASE COSTS FOR ALL ROUTES (2015 – 2025)..59
© SKEMA
Page 4
3rd June 2010
SKEMA –– Impact study on the future requirements of MARPOL Annex VI
Glossary: BN
Base Number
COx
Carbon Oxides
EC
European Community
ECA
Emissions Control Area
FGD
Flue Gas Desulphurisation
GT
Gross Tonnage
HFO
Heavy Fuel Oil
HSFO
High Sulphur Fuel Oil
IFO
Intermediate Fuel Oil
IMO
International Maritime Organisation
IMPACT
Internalisation Measures and Policies for All external Cost of Transport
ISO
International Standards Organisation
kWh
kilo Watt hour
LNG
Liquid Natural Gas
LoLo
Lift on Lift off
LPG
Liquid Paraffin Gas
LS
Low Sulphur
LSFO
Low Sulphur Fuel Oil
MDO
Marine Diesel Oil
MEPC
Marine Environment Protection Committee
MGO
Marine Gas Oil
MW
Mega Watt
NECL
Nautical Enterprise Centre Limited
NOx
Nitrogen Oxides
PM
Particulate Mater
RoRo
Roll on Roll off
SCR
Selective Catalytic Reduction
SKEMA
Sustainable Knowledge Platform for the European Maritime and Logistics Industry
SOx
Sulphur Oxides
TAPAS
Transport And Production Agent-based Simulator
TEU
Twenty foot Equivalent Unit
VGO
Vacuum Gas Oil
© SKEMA
Page 5
3rd June 2010
SKEMA –– Impact study on the future requirements of MARPOL Annex VI
1
Objectives
This document is the second of three reports requested as part of SKEMA Work Package-3 Periodic Studies, under the Terms of Reference document; “Impact Study of the future requirements of Annex VI of the MARPOL Convention on Short Sea Shipping” The objective of Task-2 of the study is to assess the sectorial, economical and environmental impact of the use of low sulphur fuels. This is to be achieved through the completion of the following tasks: ·
Calculate the impact of the use of low sulphur fuels on running costs and capital costs of shipping
·
Evaluate the economic and the emission impacts of installing sulphur abating technology
·
Deduct the differential competitiveness between sea and road transports and calculate the resulting modal balance
·
© SKEMA
Calculate the resulting overall emission impacts for selected scenarios.
Page 6
3rd June 2010
SKEMA –– Impact study on the future requirements of MARPOL Annex VI
2
Introduction
Until the 1970s emissions from ships were regarded as negligible and engine manufacturing focused on reliable and economic solutions mainly running on residual fuels. Between 1990 and 2004, volumes of cargo handled in European ports grew by 50% (Eurostat). A significant increase in sea transport was responsible for a corresponding increase in sulphur, nitrogen oxides and particulate (SOx, NOx & PM) emissions. This alarmed authorities and instigated a need for regulating marine emissions. During the same period emissions from land based transport activities decreased (Olivier and Berdowski, 2001; Smith et al., 2004) Compounds of sulphur oxide are referred to as (SOx); these include chemical compounds such as sulphur dioxide (SO2) and sulphur trioxide (SO3). Ninety five percent of SOx consists of sulphur dioxide, a toxic gas with corrosive qualities. It damages plants and acts as a lung irritant to humans (Litman 2002). ·
Miola et al explain that sulphur dioxide emissions ‘negatively impact public health, in particular sulphate particles can induce bronchitis, asthma and heart failure’.
·
Karle and Turner contend that sulphur dioxide emissions ‘can be held responsible for increased annual mortality in Europe by the World Health Organisation’.
Acidification of soils is responsible for the leaking of metals into ground water, from where they may enter the food chain. In agriculture high exposure of SO2 decreases the crop yield, while high concentrations visibly injure leaf crops. In the urban environment, acid rain deteriorates limestone structures and destroys historic monuments. In October 2008 the Marine Environment Protection Committee (MEPC) of the International Maritime Organisation (IMO) unanimously adopted the revised Annex VI to MARPOL 73/78 (International Convention for the Prevention of Pollution from Ships), which places restrictions on nitrogen and sulphur oxide emissions from ships. The IMO aims to reduce emissions from ships by reducing the sulphur content of fuel or by the use of measures that will give equivalent reductions. Lowering the sulphur content in fuels will also reduce emissions of particulate matter from shipping. The regulations will help reduce the harmful effects of emissions on human health and the marine environment and will simplify onboard procedures in relation to fuel change-overs. The revised Annex VI enters into force on 1 July 2010. The sulphur content of fuel will fall in the Emission Control Areas (ECAs), which are the Baltic Sea, the North Sea and the English Channel, from 1.5% to 1% from 1 July 2010, and to 0.1% from 1 January 2015. Globally, the highest permitted sulphur content of fuel will fall, as from 1 January 2012, from 4.5% to 3.5%, and to 0.5% from 1 January 2020. The use of alternative measures, such as scrubbers on ship exhausts, will be allowed, so that the fuel grades currently in use on vessels fitted with scrubbers can also be used.
© SKEMA
Page 7
3rd June 2010
SKEMA –– Impact study on the future requirements of MARPOL Annex VI
In addition, the implementation of the terms of the “EU Sulphur Directive” Directive 2005/33/EC on 1 January 2010 will have an effect on shipping. This Directive requires vessels in EU ports for more than two hours to use a fuel with a sulphur content of not more than 0.1% while in port. MARPOL and EU SOx regulations affecting sea transport in the EU are summarised in table 2.1.
When
Ship Type
Area
%
Act
19.8.2006 11.8.2006 11.8.2006 11.8.2007 22.11.2007 1.1.2010 1.7.2010 1.1.2010 1.1.2011 1.1.2012 1.1.2012 1.1.2015 1.1.2020
All All Passenger ships All All All All Inland waterway vessels Inland waterway vessels 16 Greek ferries All All All
Baltic Emissions Control Area (ECA) Baltic ECA All EU North Sea + English Channel ECA North Sea + English Channel ECA All EU Ports SOx ECAs All EU inland waterways All EU inland waterways Greek ports Globally ECAs Globally
1.5 1.5 1.5 1.5 1.5 0.1 1.0 0.1 0.001 0.1 3.5 0.1 0.5
MARPOL EU EU EU MARPOL EU MARPOL EU EU EU MARPOL MARPOL MARPOL
Table 2.1: Time schedule for MARPOL and EU SOx Limits In light of the MARPOL amendments and the effect of the EU Sulphur Directive there are three options available for ship operators with regard to the fuel type used: 1. Use High Sulphur Fuel Oil (HSFO) and add Low Sulphur Fuel Oil (LSFO) in appropriate quantities to dilute the sulphur content to the correct level (Dual Fuel Operation). This option will only suffice until 2015 within ECAs. 2. Use marine distillate fuel (Single Fuel Operation) 3. Use Heavy Fuel Oil combined with the use of abatement equipment.
© SKEMA
Page 8
3rd June 2010
SKEMA –– Impact study on the future requirements of MARPOL Annex VI
3
Impact of the use of Low Sulphur Fuels on the Costs of Shipping
3.1
Availability of Low Sulphur Fuel
Sulphur is one of the many ingredients of fossil fuels. The sulphur content in fuels depends on the sulphur content in the crudes. Thus in ‘sweet’ crude oil, sulphur content does not exceed 0.5%. Heavy fuel oil containing less than 0.5% sulphur is obtained from crude oil with sulphur content less than ~0.15%1. Heavy fuel oil is distillation residue oil, which remains when grades of light fuel oil have been produced from crude oil. Most of the sulphur remains in the heavy fuel oil, so sulphur-rich crude cannot be used to produce heavy fuel oil containing less than 0.5% sulphur. According to Purvin & Gertz, there are very few crude oils in the world of low enough sulphur content to produce a heavy fuel oil meeting a 0.1% sulphur content specification. Most of these crude oils are in Asia and are all highly paraffinic, waxy crude oils which would be unsuitable for heavy fuel oil production for marine bunkers due to their high pour points. In addition, these crudes are sought after for their feedstock properties by refineries. In practice, it is not possible to extract sulphur from heavy fuel oil using current methods, because the metallic impurities in heavy fuel oil, such as vanadium and nickel, despite their very low content on the whole, prevent the use of the sulphur extraction systems employed for the lighter fractions in the oil refinement process for the removal of sulphur in heavy fuel oil, as they poison the sulphur extraction catalysts. For that reason, low-sulphur heavy fuel oil is only normally produced from low sulphur crude oil (Heavy Fuel Oil Guide), 2002, Chapter 1.4.1) Production of 0.5% sulphur content heavy fuel to meet world bunker demand would be theoretically possible by selectively using atmospheric residue from very low sulphur crude oils. However, the VGO (vacuum gas oil) portion of this material is used as a refinery feedstock for further processing in almost all cases and this refinery feedstock would need to be replaced if used for the marine bunker market. In addition, the marine bunker fuel market currently provides one of the few remaining outlets for high sulphur residues produced from high sulphur crudes. As a result, whether high sulphur residues are treated to produce 0.5% sulphur marine bunkers or whether low sulphur crudes are selected for production of these fuels, and refineries treat the displaced high sulphur residue to produce refinery feedstock, the end result is essentially the same in terms of the requirement for refinery investments (Purvin & Gertz). According to OPEC estimates, the average crude sulphur content is expected to increase from the current 1.2% to almost 1.4% by 2020. As a result of changes in the crude supply slate2, the
1
2
This is due to the fact that the majority of the sulphur in the crude entering a refinery ends up in the HFO. Crude slate is an industry term for the list (slate) of all types of crude oil processed by a refinery.
© SKEMA
Page 9
3rd June 2010
SKEMA –– Impact study on the future requirements of MARPOL Annex VI
price differential between sweet and sour crudes can be expected to increase, and refineries may invest in additional processing facilities to cope with heavier and higher sulphur crudes. The increase in average crude sulphur level is also expected to lead to an increase of the average sulphur content of heavy fuel oil. Crude oil prices have increased significantly over the last few years, peaking in 2008, as illustrated by the figure below. (IMO: BLG12/INF10).
Figure 2.1: Crude oil prices 1998 to 2009 The end of 2008 and the start of 2009 saw a dramatic drop in crude oil prices; however, in the last six months crude oil fuel prices have begun to stage a recovery. During the exponential growth in crude oil prices the International Energy Agency IEA noted an increase in demand for LPG/ethane and middle distillates, while heavy fuel oil demand shows no growth (2007). As the majority of crude reserves have higher sulphur content (sour), and with increasing trends, there is an expected competition for the reserves with lower sulphur content (sweet). Regarding the global emission standard foreseen to enter into effect in 2020, a revision clause is included which ultimately in 2018 will decide whether the entry into effect is possible or should be delayed till 2025.
3.2
Single Fuel Operation
The characteristics of marine distillate fuel are specified by the marine distillate fuel quality standard (ISO 8217 – DMB). This is the heaviest distillate fuel fraction (high density) from the refining of crude oil and is designed specifically for use in marine diesel engines as a Marine Diesel Oil (MDO). Ship engines generally run on heavy fuel oil or intermediate fuel oil (HFO/IFO). In order to meet the 2015 MARPOL sulphur limit ships using a single fuel would be required to us a distillate. © SKEMA
Page 10
3rd June 2010
SKEMA –– Impact study on the future requirements of MARPOL Annex VI
Distillates have lower sulphur content than heavy fuel oil, with MGO having a maximum content of 0.1% sulphur in Europe.
3.2.1 Required Capital Investment The use of marine distillate in the main engines does not pose a major technical challenge. The main consideration is the impact of lubrication costs associated with using a single low sulphur fuel source. The IMO estimate that the average cost of converting to low sulphur fuel would be in the region of €100k, and this is the figure utilised in this report (IMO: BLG12/INF10).
3.2.1.1
New Ships
New engines can be configured to burn distillate fuel in accordance with the ISO standard (e.g., ISO 8217 DMB). New build ships do not require special considerations in their design for optimal burning of a single distillate fuel. In fact, using a single fuel would simplify ship design given that separate bunker systems would not be required to store separate fuel categories or blending stocks. The system would be further simplified as MDO does not require to be heated prior to combustion; therefore only minor fuel processing is required and, as no sludge is produced, there is no need to control injection viscosity (IMO: BLG12/INF10).
3.2.1.2
Conversion of Existing Fleet
Existing marine diesel engines can safely use low sulphur fuel, however, many engines use the sulphur content of the fuel as a lubricant for the injectors and injection pumps. When the sulphur content is reduced engine part adjustments may be necessary. New injection pumps may be necessary due to lower temperature level, lower density of fuel and the necessary clearance between plunger and barrel. Due to the differing physical and energy characteristics of MDO there will be a fuel saving of approximately 5% (by weight), but this will necessitate an increase in the fuel injection volume into the engine. If there is wear in older injection pumps there might be an adverse influence on injection pressure. These losses could be as much as 6-15% and a change of fuel pumps might be needed. (IMO: BLG12/INF10) In some newer four-stroke (and some two-stroke) engines the exhaust valves may need to be changed. In addition, lower temperature levels in the fuel system may result in changes of dimensions under operational conditions and require tightening of pipes, flanges, etc., for leakage control.
© SKEMA
Page 11
3rd June 2010
SKEMA –– Impact study on the future requirements of MARPOL Annex VI
In two-stroke diesel engines, large quantities of cylinder oil are injected into the middle and lower parts of the cylinder. The lube oil is formulated to help counteract the sulphur levels in the fuel that result in sulphuric acid formation, which can be detrimental to moving parts if not neutralized. The Base Number (BN3) of the cylinder oil has to be adjusted to the lower sulphur content in the MDO. This action results in much less (about 25% less) oil and waste oil being used or created. 3.2.2 Running and Maintenance Costs Sulphur compounds in diesel fuel act as natural lubricants for fuel system components such as fuel pumps and injectors. Removing sulphur reduces the natural lubricity of the fuel. To ensure that this does not cause problems, lubricity is measured by additional testing during the manufacturing process. If lubricity does not meet accepted international standards then it is treated with an additive at the refinery.
3.2.2.1
Using low sulphur content fuel and high BN
Use of a single low sulphur MDO fuel may require special lube oils to be used to improve lubrication and prevent carbon deposition, called lacquering. The fuel itself may have to be treated to increase its lubricating and anti-fouling properties. Use of high BN oil may result in excessive calcium ash creation which will deposit on the piston crown, exhaust valves, turbocharger and combustion chamber and these deposits may become very hard and contact between the deposits and the cylinder liner wall can cause bore polishing which will accelerate wear. For fuels with sulphur content below 1.0% the use of high BN must be avoided. Even though low sulphur fuels have been used in many ships with controlled injection of BN 70 lubricants this poses a higher risk for SSW (Sudden Severe Wear). This risk is dependent on engine design, operation and maintenance.
3.2.2.2
Using high sulphur content fuel and low BN
There might be insufficient BN to neutralize the acids being formed and this will result in corrosion. On the other hand, attempts to counteract by increase feed rate of low BN lubricant would lead to over lubrication. For fuel having a low sulphur content of 0.01% to 0.2% S, lubricating oil with a minimum BN of 10 is needed to ensure an adequate alkali reserve to neutralize acid oxides of sulphur as well as nitrogen. The cost of low BN lube oils can be expected to be lower than for the currently used higher BN grade oils.
3
Base Number (BN) is a measurement of the reserve alkalinity of an oil, meaning its ability to neutralise acids
© SKEMA
Page 12
3rd June 2010
SKEMA –– Impact study on the future requirements of MARPOL Annex VI
The low sulphur content would permit the use of SCR 4 catalysers. This in turn offers the possibility to use higher combustion temperatures resulting in higher efficiencies. The use of a single marine distillate fuel would result in a reduction in the level of fuel oil consumption in ports, as no bunker fuel heating is required. In the case of a global single marine distillate fuel requirement there is little doubt that ship operation will be simplified through easier maintenance and there should be a positive impact on work load. In summary, the use of distillate fuel would improve the reliability of engines and reduce maintenance requirements as long as engines are properly adjusted and if measures on marine distillate fuel characteristics are taken into account. Single low sulphur fuel use would result in increased operational dependability. Time between overhaul of main engine may be increased due to absence of cat fines5 (explain) and other non hydrocarbon substances (acids, etc). (IMO: BLG12/INF10) New seals, fuel injectors or other components may be required for good long-term performance. Injection pumps are the most likely component to require replacement. Injection timing may need to be adjusted. In addition, seals and O-rings in fuel pumps can react to fuels of different composition by swelling or shrinking. Changes in fuel composition happen due to changes in the manufacturing process to meet summer or winter requirements, due to different crude types being used and due to the refining processes used to remove sulphur. Fuel pumps on equipment more than 8 years old contain seals made of buta-n rubber that tends to harden with age and crack. The cracked seals tend to leak when diesel fuel composition changes, this is normal and means that the fuel pump needs maintenance. The solution is to replace the seals with new ones. (BP Diesel Product Information January 2009) 3.2.3 Storage Requirements A single global fuel standard would eliminate the necessity for fuel change-over before entry into an ECA. This will limit the dangers of fuel incompatibility and the flocculation of asphaltenes blocking fuel pipelines and filters in dense traffic waters during the fuel switching process, (IMO: BLG12/INF10). This would have the corresponding advantage of optimum use of space within the ship where additional fuel mixing tanks are not required.
4
Selective Catalytic Reduction: is a means of converting nitrogen oxides (NOx) with the aid of a catalyst into diatomic
nitrogen, N2, and water, H2O 5
Cat fines are particles of spent aluminium and silicon catalyst that arise from the catalytic cracking process in the
refinery. The fines are in a form of complex alumino-silicates and, depending on the catalyst used, vary both in size and hardness. If not reduced by suitable treatment, the abrasive nature of these fines will damage the engine, particularly fuel pumps, injectors, piston rings and liners.
© SKEMA
Page 13
3rd June 2010
SKEMA –– Impact study on the future requirements of MARPOL Annex VI
3.3
Dual Fuel Operation (blending)
This is the currently the situation for ships entering and leaving the ECA whereby ships have to change from HSFO (high sulphur fuel oil) to LSFO (low sulphur fuel oil) or to Marine Diesel Oil/Marine Gas Oil (MDO/MGO) and then back again upon exiting the ECA. This option will not be feasible with a fuel sulphur content limit of 0.1%. The change-over options which are currently available: 1. Dilute the HSFO in the settling tank and service tanks with LSFO; 2. Blend HSFO and MGO/MDO onboard the ships. 3. Separate fuel systems
3.3.1 Required Capital Investment This may require the redesign of boilers and their injection system to prevent the danger of boiler furnace explosion in distillate operation as a result of switchover. In addition, for the proper operation of boilers, fuel cooling may be required to control viscosity during the switchover between fuel types. The preferred minimum number of storage tanks is four, to permit the ship to bunker HFO and LSHFO in empty tanks at any time even if both fuel qualities are available in other tanks.
The routine switching between marine distillate and HFO has safety implications for existing boilers. The boiler combustion systems may require to be modified to prevent the risk of boiler furnace explosion in distillate operation. For a ship with two service and settling tanks, the LSFO can be transferred and separated in parallel with running on HSFO. A ship can easily change to LSFO before entering the SECA, but will need to allow for dilution of the HSFO in the fuel system. The higher consumption results in faster the dilution and thus the faster the change-over. The HSFO in the fuel supply piping system also has to be diluted to 1.50% or less. In general this will be fast for Main Engines due to high consumption at sea, but far slower for auxiliary engines and boilers. This is an important aspect to consider for ships with two service and settling tanks Some vessels may need to modify their tanks and fuel handling system to increase their capacity for diverse grades of marine distillate fuel and to aid fuel switching. As an alternative to installing double tanks, a blending unit can be retrofitted, but onboard blending brings a real risk of fuel incompatibility. The unit is used to inject LFO (with low sulphur content) into the fuel booster system to reach the required Sulphur content of (e.g.,) 1.5%. Some vessels may be able to convert an existing HFO tank to a marine distillate fuel tank if a smaller HFO tank is available. © SKEMA
Page 14
3rd June 2010
SKEMA –– Impact study on the future requirements of MARPOL Annex VI
3.3.2 Running and Maintenance Costs A fuel switching operation could potentially require the carriage of two cylinder lubricants and/or control for differing feed rates. On-board lubricant management controls may be required. Engines may be operated for short time period, e.g., up to around 72 hours without a change in lube oil but feed rate changes may be required. However, when operated in excess of 72 hours, it is recommended that changes in lubricant type/BN and feed rate may be needed. In a change-over to a marine distillate operation the injection pump plunger fit could result in increased leakage due to variation in temperatures of the respective fuels and lubrication of the camshaft could be reduced due to lower lubrication capacity of marine distillate fuel compared to heavy fuel oil (variation of temperatures and viscosities between the two proposed fuel types). Due to temperature and characteristic differences between HFO and MDO it will be necessary to use suitable cylinder oil, optimise the gaps between sliding surfaces of plunger barrels, prevent
the
leakage
of
fuel
oil
from
the
fuel
pump,
and
tighten
up
on
the
inspections/management of lubrication oil. Allied to this, the work load of the crew is likely to increase. Conventional fuel purifiers/separators require manual control depending on the density and viscosity of the fuel. As the density and viscosity of LSFO is often quite different from that of HSFO, change-over from HSFO to LSFO and vice-versa will require the relevant modifications to the system to be undertaken by the crew. This will require adequate training procedures to be implemented. Without modifications to the fuel piping system, MDO/MGO to main engine and boilers will have to be supplied through the HFO service system. This gives additional challenges as cool-down also applies to piping (heat-tracing), fuel oil heaters and engine injection system/components. Too high temperature will result in too low viscosity, inadequate lubricity and possible in-system gasification of MDO/MGO. A notable operational requirement is the long change over times which may be incurred due to the sulphur levels in the HSFO and LSFO. In general, the higher the sulphur levels in HSFO and LSFO, the longer the change-over time. The cost of modification depends on ship and engine room design. If tank arrangements have to be modified, the costs could be considerable and the following should be observed: ·
Adding tanks and piping, mixing tanks, and purifiers may be required;
·
Modifications to fuel pumps, injectors, nozzles, lubrication systems may be required;
·
Class society approvals and inspections especially for NOx Technical Code compliance may be required;
·
Retrofitting of distillate fuel cooler may be required
© SKEMA
Page 15
3rd June 2010
SKEMA –– Impact study on the future requirements of MARPOL Annex VI
3.3.3 Storage Requirements When switching from heavy fuel to a lower aromatic distillate fuel or LSFO, some of the heavier material (asphaltenes) could be precipitated from the heavy fuel. If this happens, fuel filters could clog and fuel pumps stick, causing sudden loss of power. This mainly relates to the potential mixing of two dissimilar fuels in a common tank, which can occur during fuel switching lubricating/cylinder oils. One main issue with changing between HFO and MDO/MGO is that the risk of incompatibility between MDO/MGO and HFO is far greater than between different types of HFO. It is therefore recommended that the correct storage for mixing fuels should comprise separate tanks. Accordingly the following will be necessary: ·
Provision of additional bunker tank(s);
·
Additional bunkering system(s) for additional bunker tank(s);
·
Additional settling tank(s);
·
Additional transfer pumps to the settling tank;
·
Enhanced bunker-heating system to accommodate different fuel characteristics (pumping temperature, viscosity, etc.);
·
Measures on low-viscosity of distillate: Provide a cooler (cooling system) on fuel lines, increase the pressure of fuel lines, and optimise the ignition timing, etc.;
·
Additional set of fuel oil centrifuges with separate centrifuge room, including sludge tank, etc.;
·
Additional service (day) tank;
·
Additional piping and instrumentation.
© SKEMA
Page 16
3rd June 2010
SKEMA –– Impact study on the future requirements of MARPOL Annex VI
4
Impact of Installing Sulphur Abating Technologies
At present the European approach allows for trials with sulphur abatement technologies. The EU Marine Fuels Sulphur Directive (2005/33/EC) includes provisions for the testing and installation of emission abatement technologies (Article 4c). With regard to the sulphur abatement technologies, this study has focused on the use of exhaust scrubbers. This approach reflects the current trend within the industry due to the availability of expertise in this area and the completion of relevant studies. There are at present three types of sulphur exhaust scrubbers suitable for ships: the closed-circuit, freshwater scrubber, sea water scrubber and dry scrubbers. Currently tests are ongoing on a DFDS ship using interchangeable closed-circuit and sea water scrubbers; this is to facilitate the Danish band on the use of sea water scrubbers whilst in port. Insufficient information was not available during the course of this study on dry scrubbers and the DFDS study was at to early a stage to be included.
4.1
Freshwater (Closed-Circuit Scrubbers)
The freshwater scrubber’s ability to clean and to neutralise sulphur oxides relies on maintaining the water’s pH, using a lye (caustic) solution. The wash water’s pH in a closed loop is kept close to neutral throughout the process and the quality of the seawater does not affect the effectiveness of the cleaning operation. During the process the sulphur’s oxides are neutralised and converted into harmless sulphates, which can be separated and collected. The pH of the cleaned wash water that falls into the sea is neutral and thus barely differs from the pH of seawater. (Finnish report on Sulphur content in ships bunker fuel in 2015)
4.2
Sea Water Scrubbers
This study focuses on the use of sea water scrubbers as it is envisaged that this will be the type predominantly utilised by ship owners where scrubbers are to be installed. The following sections refer only to sea water scrubbers.
4.3
Early On-Board Trials
The seawater scrubber’s principle of operation is to pass the exhaust gas through seawater. The seawater absorbs the sulphur compounds (and any other impurities, such as particulate matter and heavy metals). The effectiveness of this method relies on the seawater’s alkalinity, and so in waters low in salt, such as the Baltic, more seawater has to be used than in the oceans. The sulphur washed out of the exhaust is conducted into the sea along with the wash water.
© SKEMA
Page 17
3rd June 2010
SKEMA –– Impact study on the future requirements of MARPOL Annex VI
The technology which the sea-water scrubber utilises dates from the 1930s. Although common among land installations, the prototype on marine engines was first installed on MS Kronprins Harald in 1991 (Trozzi and Vaccaro, 1998). The 2005 Entect study exhibits a selection of early trials of sea-water scrubbers in marine applications: ·
M/S Kronprins Harald serving the Oslo-Kiel route (1991). Tested over 1700 operating hours, demonstrating that 92% sulphur reduction was possible. During normal loading condition, sulphur removal rate was in the range of 71-73% for salinities down to 14%. The water discharged has a ‘low pH [with] various toxic organic pollutants and metals mainly associated with particles’.
·
MT Fjordshell, under the Kvaerner/Norske Shell project (1993). The tanker generated 90,000 Nm3/hr of exhaust gases through a 10,8MW main engine, three auxiliaries and two boilers. Efficiency of scrubbing was by average 90% (85-95%) with potential of more reductions if optimising the sea water/exhaust gas capacity ratio. Regarding the waste water, which included nickel, soot, vanadium and copper; an efficient diluting factor would reduce the toxic effect to marine organisms to negligible.
·
Laboratory tests, Zhou and Montogomery (1999). Achieved reductions 95% SO 2, 30% CO, signs of NOx and PM and ‘significant changes in fuel consumption’. Exhaust gases were cooled from 380oC down to 50oC, while waste water warmed up from 11oC to 50oC, pointing to possible corrosion-free scrubber materials.
·
Patent design, University of Dundee. Particulate matter is filtered from ‘the scrubbing liquid, which is in turn heated to re-evolve the SO 2’. Humidity is removed from SO2 gas, while a vanadium oxide catalyst converts the pollutant to SO3, which in turn dissolves into water to produce sulphuric acid (H2SO4), a toxic chemical for industrial use.
·
Marine Energy Ltd (MEL) conducted 22 days of testing on one of the three auxiliary engines of the Canadian ice-breaker using a prototype (i400). The study ‘outlined the possibility to further exploit the waste heat’ and reduce the usage of the three boilers. A 96% removal rate of SO2 and a 70-80% reduction of particles and some small reduction of NO were registered, Trivett et al., (1999).
·
Tests run by MEL and MAN B&W collaboration. Prototype of Eco-Silencer® on a 1500kW auxiliary engine running on heavy marine fuel with sulphur content 3,5% (soon to be the highest allowable content per weight by IMO in non-ECAs) and supplied by Marine Exhaust Solutions (MES), Gregory et al., (2002). The Eco-Silencer® treated the entire exhaust stream. SO2 was removed by 85 to 94%. Soot was visibly improved: PM2 was reduced by 98%, PM1.5 by 74%, PM1 by 59% and PM0.05 by 45%6. The tests in the RoPax ferry also aimed to investigate waste water quality and waste water treatment.
·
Pride of Kent. Four Eco-Silencer® scrubbers supplied by MES were tested on the four auxiliary engines during 11,680 hours of operation. Waste water quality showed that the
6
In reference to particulate matter PM, the smallest particles cause the most harm to the lungs.
© SKEMA
Page 18
3rd June 2010
SKEMA –– Impact study on the future requirements of MARPOL Annex VI
concentration of petroleum hydrocarbons was lower than the IMO OILPOL limits. There are no specifications regarding the pH, suspended solids and heavy metals from waste water discharge. ·
Tor Ficaria, DFDS Tor Line. The Ro-Ro cargo ship is reported to have installed a seawater scrubber as of June 2009 in order to comply with sulphur regulations during its service between Gothenburg, Sweden and Immingham in the UK.
4.4
The Chemical Process
Sea-water scrubbing is a case of wet flue gas desulphurisation (FGD). Flue gases containing SO2, which is acid, come into contact with sea-water. Sea-water is alkaline (excess of base over acid); but alkalinity does not refer simply to pH, it also refers to the ability of water to resist in changes of the pH. When SO2 comes into contact with the sea-water the sea-water acts as a buffer. Henriksson (2007) explains that buffering materials are primarily bicarbonate and carbonate, but also consist of hydroxide, borates, silicates, phosphates, ammonium, sulphides, and organic compounds. Total alkalinity is the sum of all these. Salinity describes the salt content of water. The salinity of ocean water is approximately 3.5%-weight. Water can have high alkalinity and zero salinity depending on the calcium concentration. As explained by Karle and Turner (2007) the chemical process and basic principle of sea-water scrubber is that the flue gases are exposed to sea-water, which dissolves the sulphur oxides; SO2(g) = SO2* The sulphur oxides of shipping exhausts typically consist of ~95% sulphur dioxide and the remaining ~5% of sulphur trioxide, SO3. Once dissolved, the sulphur dioxide can subsequently be ionised to bi-sulphite,
and sulphite,
Sulphite is a strong reducing agent, which for instance is used for de-oxygenation of solutes. Hence, in toxic seawater sulphite will to a large extent be further oxidised to sulphate’
On land, facilities may use scrubbers with a neutralising agent, such as limestone to produce solids with a commercial value, such as calcium sulphite.
© SKEMA
Page 19
3rd June 2010
SKEMA –– Impact study on the future requirements of MARPOL Annex VI
4.5
Discharge Water from Scrubbing
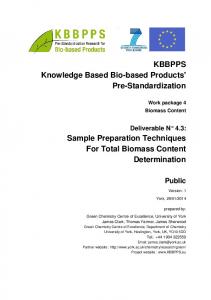
On-board installations exploit the properties of sea-water to buffer the acidic SO2. The more alkaline the water is the less water quantities are needed in order to scrub the SO2 exhausts, thus scrubbing efficiency is higher in the more saline waters. This relationship, nevertheless, is non-linear. The relationship between the sulphur removal and the water volumes is also non-linear. To scrub the exhaust of 3% sulphur fuel down to 0.5% requires almost the same amounts of water than to reduce it to 1.5%. However, further reductions to 0.2% or 0.1% fuel sulphur content require substantial increase of water volumes (Karle and Turner). Minimising water volumes is possible by oxidising or aerating the water. Adding a base, such as NaOH (caustic soda), sulphurous and sulphuric acid forms are neutralised. In effect, the scrubbing process cuts short the cycle of sulphur oxides so that the sulphur input does not go on land but is directly deposited to the sea, which acts as a large buffer. There is some concern that sending seawater back into the ocean with sulphur-containing wastewater is harmful enough to the marine ecosystem that it ‘’renders the technology impractical’’ (CEC, 2006). The sea-water scrubber has been tested on only a few ships to date and conclusions are not drawn (CEC, 2008). Yet, the IMO Marine Environment Protection Committee has approved this technology as long as its usage has no adverse/harmful effects on the ecosystems. The EU puts forth criteria for the use of the scrubber to be communicated with the IMO guidelines (Directive 2005/33/EC, Article 4c §3).
Figure 4.1: Mixing zones (Karle and Turner) The Environmental Protection Agencies and the IMO have adopted regulations for the mixing qualities of the effluents and the scrubbing water. Within 15 minutes of the discharge, the pH within the ‘acute mixing zone’ should not surpass 6.5, while within the chronic zone the difference with the ambient pH should not be more than 0,2 during a longer residence time. © SKEMA
Page 20
3rd June 2010
SKEMA –– Impact study on the future requirements of MARPOL Annex VI
Karle and Turner explain that the ‘chronic mixing zone’ encompasses a dilution of 1:40.000 dilutions for the discharged water. Results vary according to travelling speed but their main concern lies in the case of ‘semi-closed area or a mouth of a river’, where ‘hydrography, water chemistry and shipping activity’ should be studied. As sea-water scrubbing cuts shorts the cycle of SO2 directly deposited in the ocean, this technology ‘will speed up the pH decrease in ocean surface waters; however the effect is minor compared to ocean acidification due to increased carbon dioxide concentrations in the atmosphere’. Corbett & Fishbeck estimated that the pH would decrease by 0.02 within the next 100 years given that the sulphur is evenly distributed to the oceanic surface (100m deep). Karle and Turner point out that the Baltic Sea is a special case requiring further study according to the water characteristics and the sea traffic. In their study they took the worst case scenario to 2determine the potential environmental threat from the creation of sulphate SO4 assuming that
all scrubbed sulphur dioxide is instantaneously transformed to sulphate via sulphite, and that the equilibration of oxygen with the atmosphere sufficiently slow to be negligible. In that case, the scrubbing water that has been diluted to satisfy pH ambient-0.2 would require further slight dilution by up to 50%, in order to not lower the ambient oxygen saturation by more than 1%.
4.6
Fixed and Operating Costs
The following information is mainly retrieved from work carried out by Entec Consulting Ltd (2005).
4.6.1
Lifespan
Literature on the subject puts the lifespan at a minimum of 15 years. While scrubber suppliers claim a 20-25 year lifespan for their products, this study has assumed a 15 year lifespan in all its calculations.
4.6.2
Maintenance
There is little expenditure on maintenance. Entec Consulting Ltd (2005) has estimated operating and maintenance costs to be only a fraction of capital expenditure on the scrubber: 3, 2, and 1 % for small, medium and large vessels respectively. The operation of the sea-water scrubber increases the volume of sludge. While most ports have defined charges for receiving certain sludge wastes, definitive costs for the receipt of scrubber sludge have not being specified. Literature and suppliers report that sludge will not increase to the point where it shall create a substantial additional cost. Nevertheless, the ‘acidity of the sludge may cause additional disposal problems and costs’ (Entec, 2005).
© SKEMA
Page 21
3rd June 2010
SKEMA –– Impact study on the future requirements of MARPOL Annex VI
4.6.3
Capital Expenditure
Capital costs have been estimated by the previous study on the Price of Kent (EcoSilencer) with new build to cost 20-40% less than retrofits. For the retrofit, capital expenditure is estimated to be 168 Euros/KW installed and for new builds this drops to 118 Euros/KW installed. These costs were confirmed to mirror the situation in 2009, with an adjustment of a 10% decrease due to new entrants in the market. Entec provides the following example:
Table 4.1: Costs for sea water scrubbing Source: Entec
4.7
Available Scrubbers by Manufacturer
Following is a comparative presentation of five manufacturers of sea-water scrubber for marine use. Exact details of names have not been provided at this time.
4.7.1
Scrubber Supplier V
The system runs with fresh or sea water in an open loop without using chemical additives. Freshwater or seawater first goes through an electrolysis process to increase its alkalinity before scrubbing. Seawater is additionally treated for antifouling before adding to the ULFELS (Ultra-Low Frequency Electrolysis System) tank to control microbial growth in the system. Company material reports that the alkaline water is then pumped through the exhaust stack to scrub the flue gas. An electrical method is used to convert atmospheric CO 2 into bicarbonates in water, which are discharged back into the ocean, while SO 2 and NOx are converted into sulphate and nitrate which are naturally present in seawater. Particulate matter (PM) after scrubbing is removed and separated as solid waste. The system claims to reduce CO2 by 25%, SOx by 93% and NOx by 82%. The company is in the process of obtaining full type-approval from a classification society and has patented the technology. © SKEMA
Page 22
3rd June 2010
SKEMA –– Impact study on the future requirements of MARPOL Annex VI
4.7.2
Scrubber Supplier W
This is a wet system which can run on sea water or sea water and NaOH as an open loop or as sea/fresh water with NaOH in a closed loop (recirculation of scrubbing water). The scrubbing water is cleaned-up by skimming flocculants into a filter bag. The flocculants and other trapped materials are filtered into a bag and the liquid is drained off. Filled bags remain on-board until unloading/discharge. Regarding the discharged (scrubbing) water, pH is reported ‘well above 6.5 when adding base’. The system reduces sulphur oxides by 98% and PM by 85% (test in 1MW unit in the laboratory). Compliance is measured with the SO2/CO2 ratio.
4.7.3
Scrubber Supplier X
The system runs with sea water as an open loop system, where NaOH is optional for usage in geographies of low alkalinity water. Water is cleaned with hydro-cyclones before discharge. Residues are held in a tank for disposal at port. The pH in the tank is balanced with NaOH. The pH in the discharged water complies with relevant IMO rules7. In order to comply with 0.5 % and 0.1% sulphur limit, the fuel must not exceed 2.9% and 2.2 % in sulphur content respectively. Particulate matter (PM) is reduced up to 80%. Compliance is measured with the SO 2/CO2 ratio.
4.7.4
Scrubber Supplier Y
The system runs with sea water as an open loop or fresh water and NaOH hydroxide in a closed loop, where sodium salts and soot particles are collected in a tank. The sludge generated is treated as any other sludge material on-board. The pH outlet is at 6.5. Sulphur oxides are reported to be reduced up to 100%, while particulate matter (PM) is reduced by 80% (test in 1MW unit in the laboratory).
4.7.5
Scrubber Supplier Z
The system runs on clean water in an open loop with an option to chemically balance the pH of the discharge for geographies of low alkalinity. During the clean-up process carbon, hydrocarbons and other solids are separated from the water and stored in the sludge tank. The sludge (less than 0,1g/kWh) is discharged along with other oil wastes, while the water is aerated and discharged over board. The pH outlet is above 6.5 at port. The system has compliance confirmation EGCS by SO2 / CO2 method. Reduces sulphur oxides over 95% (test in 1MW unit in the laboratory). Particulate matter in distillates is reduced by 70- 80%, while in residuals it is reduced by 50-60%.
7
IMO, RESOLUTION MEPC.170(57), Guidelines For Exhaust Gas Cleaning Systems
© SKEMA
Page 23
3rd June 2010
SKEMA –– Impact study on the future requirements of MARPOL Annex VI
5
Unit Price Impact as a result of MARPOL Annex VI
Due to the modelling requirements of this study two models were used to provide a broader platform from which to draw conclusions for the impact of MARPOL Annex VI. The primary model, TAPAS, simulates the decisions affecting modal choice on the transport of TEUs of average value of €20k and weight 11ton on LoLo vessels on the East-West corridor identified in Task-1. The secondary model, NECL model, simulates the cost and duration of transporting a trailer on RoRo vessels on the East-West corridor identified in Task-1. Section 5.1 presents the inputs and assumptions common to both models. The assumptions and inputs specific to each of these models are presented in section 5.2 and 5.3.
5.1
Inputs and Assumptions Common to TAPAS & NECL Models
This study has been limited to sea and road transport only and does not cover the use of inland water ways or freight trains. This study does not allow for the low sulphur alternative marine fuels of LNG or LPG and only focuses on the use of petroleum based marine fuels. To complete this study the primary factors impacting the costs and emissions of intermodal transport chains needed to be modelled from 2009 to 2025. The following tables and figures represent the common inputs and assumptions utilised by both models.
5.1.1 Predicted Fuel Price Purvin & Gertz8 recently carried out a study for the Commission “Impacts on the EU Refining Industry & Markets of IMO Specification Changes & other Measures to Reduce the Sulphur Content of Certain Fuels”. This study predicts fuel prices until 2020. Price changes from 2020 to 2025 have been extrapolated from this data and are as follows: €/Ton Fuel Sulphur Content
1.50%
1.00%
0.10%
2009
€166.56
€178.72
€425.80
2010
€281.75
€293.91
€492.11
2015
€399.60
€411.76
€656.24
2020
€424.74
€434.34
€705.83
€466.38
9
€752.99
2025
Table 5.1: Price per ton for maritime fuel from 2009 to 2025
8
Purvin & Gertz, Impacts on the EU Refining Industry & Markets of IMO Specification Changes & Other Measures to
Reduce the Sulphur Content of Certain Fuels, 2009 9
Figure not required for this study
© SKEMA
Page 24
3rd June 2010
SKEMA –– Impact study on the future requirements of MARPOL Annex VI
In order to determine the sensitivity of the conclusions drawn from modelling the fuel prices, the scenarios were run a second time by the NECL model only with the fuel prices assumed to be 20% higher than those predicted in table 5.1.
5.1.2 Eurovignette Adoption The proposed amendments to the Directive 1999/62/EC on the charging of heavy goods vehicles for the use of certain infrastructures were stipulated in COM(2008) 436 final/2 and presented to the European Parliament in 2008. This proposal was based on the “Handbook on estimation of external costs in the transport sector”, produced within the study “Internalisation Measures and Policies for All external Cost of Transport” (IMPACT). In this report the Commission proposed that in addition to current infrastructural tolls, road users should also be charged, on a per kilometre basis, for: ·
air pollution
·
noise pollution and
·
congestion
The following tables are extracts from Annex IIIa from COM(2008) 436 final/2 and the values are displayed as Euro per vehicle kilometre. High Population Low Population Density Areas Density Areas (€/vkm) (€/vkm) EURO 0 €0.16 €0.13 EURO I €0.11 €0.08 EURO II €0.09 €0.08 EURO III €0.07 €0.06 EURO IV €0.04 €0.04 EURO V €0.03 €0.02 EURO VI €0.03 €0.02 Table 5.2: Air pollution cost of vehicle
Vehicle Classification
Day Time (€/vkm)
Night Time (€/vkm)
High Population Density Areas
€0.011
€0.02
Low Population Density Areas
€0.0013
€0.0023
Table 5.3: Chargeable noise cost of vehicles
© SKEMA
Page 25
3rd June 2010
SKEMA –– Impact study on the future requirements of MARPOL Annex VI
Time period A (€/vkm)
Time period B (€/vkm)
Time period C (€/vkm)
High Population Density Areas
€0.0
€0.20
€0.65
Low Population Density Areas
€0.0
€0.02
€0.07
Table 5.4: Chargeable congestion cost of vehicles Source: Estimated from Table 7 of the IMPACT Report Time period A is an off peak period with stable flow of traffic Time period B is a peak period or close to peak period with unstable flow of traffic Time period C is an extreme peak period with forced or breakdown flow of traffic For the purposes of this study these three charges will be combined into a single average figure utilising the following assumptions. 1. Trucks used within this study shall fall within the 16ton to 32ton weight category. 2. Truck journeys shall consist of 90% Rural/Inter-Urban and 10% Urban, by distance (kilometre). 3. Truck journeys shall take place during the day 50% of the time and during the night 50% of the time. 4. Truck journeys through congestion charge areas shall take place during ‘Time Period C’ 5% of the time and ‘Time Period B’ 10% of the time. 5. ‘Time Period A’ is taken as 85% of the time. Therefore no congestion charges shall apply during ‘Time Period A’. The average per kilometre charge for air pollution for a EURO IV vehicle is calculated as follows:
(4) ´ 10% + (4) ´ 90% =
4€ ct / vkm
The average per-kilometre charge for noise pollution is calculated as follows:
æ (1.1 + 2) ö æ 0.13 + 0.23 ö ç ÷ ´ 10% + ç ÷ ´ 90% = 0.317€ct / vkm 2 ø 2 è è ø The average congestion charge, during peak times, per kilometre can be calculated as follows:
(0) ´ 85% + (20) ´ 10% + (65) ´ 5% = 5.25€ct / vkm (0) ´ 85% + (2) ´ 10% + (7 ) ´ 5% = 0.55€ct / vkm Therefore the average congestion charge over the full journey shall be as follows:
5.25 ´ 10% + 0.55 ´ 90% = 1.02€ct / vkm Therefore the average internalised charge for ‘Air & ‘Noise Pollution’ and ‘Congestion’ is:
4 + 0.317 + 1.02 = 5.337€ ct / vkm
© SKEMA
Page 26
3rd June 2010
SKEMA –– Impact study on the future requirements of MARPOL Annex VI
This calculation is repeated for other EURO classification vehicles and is summarised as follows: Truck Classification
Average Charge (€/vkm)
EURO 0 €0.146 EURO I €0.096 EURO II €0.094 EURO III €0.074 EURO IV €0.053 EURO V €0.034 EURO VI €0.034 Table 5.5: €/vkm Environmental Tolls as proposed in the Eurovignette amendments The aforementioned per kilometre charges for environmental impact (external costs) are part of a proposed amendment to the current Eurovignette Directive and as such have not yet been ratified. For the purposes of this study it is assumed that these charges will be ratified by the European Parliament and fully implemented and enforced by 2015. The current Eurovignette Directive specifies the maximum per kilometre and per year tolls that can be applied uniformly to road users. The following table details the 100% infrastructural toll upper limits, by truck classification. Average Charge (€/vkm) Euro 0 €0.015 Euro I €0.013 Euro II €0.011 Euro III €0.010 Euro IV €0.009 Euro V €0.009 Euro VI €0.009 Table 5.6: €/vkm Infrastructural Tolls as per the current Eurovignette Truck Classification
The typical classification of trucks on the selected routes will vary over the study and are expected to change as detailed in the following table. Year
EURO Truck Class
2009 Euro IV 2010 Euro V 2015 Euro VI 2020 Euro VI 2025 Euro VI Table 5.7: Expected classification of Truck in modelled years
© SKEMA
Page 27
3rd June 2010
SKEMA –– Impact study on the future requirements of MARPOL Annex VI
5.1.3 Sulphur Directive The Sulphur Directive (2005/33/EC) requires that from the 1st of January 2010 ships at berth must not use fuel with a sulphur content exceeding 0.10% by weight. For the purposes of this study from January 2010 onwards it is assumed that ships will only use MGO whilst at berth. It is feasible and allowable for ship owners to use an exhaust scrubber whilst at berth and hence utilise higher sulphur content fuels. However, due to the concerns of discharging acidic water into restricted or fresh water areas it was assumed in this study that only closed circuit scrubbers could be used to remove sulphur whilst at berth. Due to the attractiveness of sea water scrubbers over closed circuit scrubbers additional information is available on their capital and operational costs. It is for this reason that the study has chosen to only model sea water scrubbers, see Section 4.2. For the purposes of operating in ports it is assumed that the cost of using an open water scrubber does not appreciably differ from that of a closed water scrubber. 5.1.4 MARPOL Annex VI The requirements of MARPOL Annex VI amendments as they apply to ECA’s have been discussed in detail in the Task-1 report and only the sulphur limits and their effect dates are listed as follows: Date
Sulphur Content in Fuel (% by weight)
st
1 July 2010
1.00%
1st January 2015
0.10%
Table 5.8: Sulphur content in fuel and year of introduction
© SKEMA
Page 28
3rd June 2010
SKEMA –– Impact study on the future requirements of MARPOL Annex VI
5.2
Inputs and Assumptions Specific to the TAPAS Model
TAPAS (Transportation And Production Agent-based Simulator) is a simulation tool for microlevel simulation of the production and the transportation of products. It is based on agent technology where the decision makers which appear in transport chains are modelled as software agents and their interactions are modelled according to an interaction protocol. The types of agents which are included in TAPAS are customer, transport chain coordinator, transport buyer, transport planner, product buyer, and production planner. The agents try to meet a consumer demand by transport and product ordering, selection of which transport and production resources as well as which infrastructure that should be used, and how the resources and infrastructure should be used. When the agents have agreed on how the production and transportation should be performed, the overall transport and production solution is simulated which gives performance indicators in terms of economical, logistical, and environmental performance, see Davidsson (2008) for more information. The TAPAS model simulates one consumer and one supplier at a time. Therefore the agents are not supplied with a modal choice decision but a route choice (routes 1-5) decision. The percentage modal share per route, however, does represent a modal preference. Due to the modelling of an individual supplier and an individual consumer the route choice is mutually exclusive. Therefore if under certain conditions the agents will select route-2 all of the freight will travel on this route. This is acceptable as the volume of TEUs transported between the supplier and the consumer is limited to approximately 5 TEUs per week.
© SKEMA
Page 29
3rd June 2010
SKEMA –– Impact study on the future requirements of MARPOL Annex VI
5.2.1 Routes & Services Modelled in TAPAS Established routes which were selected as part of Task-1 are displayed in figure 5.1.
Figure 5.1: Routes modelled as part of study The routes represent five competing services operating on the same corridor. The following charts display the relative percentage kilometres travelled by road and sea for each of the selected routes:
Figure 5.2: Percentage of routes travelled by sea and land
© SKEMA
Page 30
3rd June 2010
SKEMA –– Impact study on the future requirements of MARPOL Annex VI
5.2.2 Ships & Trucks Within this study the TAPAS model only assessed the impact of MARPOL Annex VI amendments on LoLo shipping. For these ship services it is assumed that the long term utilisation of ships (i.e. average % use of cargo space) is 65%. It is believed that in the long term services with utilisations of less than 50%, generally, become uncompetitive and cease. For the purposes of the TAPAS simulation it is assumed that truck utilisation will be 100%. The assumptions in terms of truck operational characteristics for the chosen land legs are listed in table 5.9.
Fuel usage Time-based costs (l/km) (€/h) 0.34
Distance-based costs (€/km)
30 0.75 Table 5.9: Truck characteristics
The loading and unloading times and costs in ports that are assumed in the TAPAS simulation are the same as used in previous simulation studies and are based on one port (Karlshamn, Sweden).
5.2.3 Order Size & Time Costs For the purposes of this study it is assumed that a customer placing an order consumes 3 TEUs each third day and place order requests to meet this demand. The customer may place an order once a day and can order 1, 2 or 3 TEUs. The customer’s initial inventory level is 30 TEUs, its safety stock is 10 TEUs and the capacity of the customer inventory level is 60 TEUs. The transport chain actors which are modelled in TAPAS attempt to find a solution which meets the consumer demand within their requested time-window. To model the trade-off between transport time and transport cost; slow transport alternatives carry a penalty cost proportional to the transport time.
5.2.4 TAPAS Scenarios The TAPAS model carried out simulations using the previously listed inputs and determined the resultant route selection (routes 1-5). The TAPAS model only simulated the ‘Lower Sulphur Fuel’ option as a result of the MARPOL Annex VI amendments and did not simulate the use of abatement technology. Therefore the results presented by TAPAS reflect the route selection based on the ship owners converting to the use of lower sulphur fuels only.
© SKEMA
Page 31
3rd June 2010
SKEMA –– Impact study on the future requirements of MARPOL Annex VI
5.3
Inputs and Assumptions Specific to the NECL Model
The NECL model simulated the cost and duration of transporting a trailer on the five selected routes. This model was used to determine the cost impacts of the future requirements of MARPOL Annex VI and allowed for the installation of abatement technology by ship owners. The NECL model also calculated the CO2 & SO2 emissions per trailer for each of the scenarios specified in Section 5.3.4.
5.3.1 Routes & Services Modelled by NECL The following routes were modelled by NECL based on the outputs of Task-1 and input received from stakeholders during the course of Task-2:
Figure 5.3: Routes Modelled by NECL (1 – 4)
Figure 5.4: Routes Modelled by NECL (5 – 6)
Figure 5.5: Routes Modelled by NECL (7 – 8)
© SKEMA
Page 32
3rd June 2010
SKEMA –– Impact study on the future requirements of MARPOL Annex VI
Figure 5.6: Routes Modelled by NECL (9 – 10) The routes represent 10 competing services operating on four corridors. The following chart display the relative kilometres travelled by road (in black) and sea for each of the selected routes: Route-10
Gothenburg to Dortmund
Route-9 Route-8
Dortmund to Manchester
Route-7
Vilnius to Dortmund
Route-6 Route-5 Route-4 Route-3
Klaipeda to Harwich
Route-2 Route-1 0
500
1000
1500
2000
2500
3000
Kilometres (km)
Figure 5.7: Modal share by kilometre of routes 1 – 10
5.3.2 Ships & Trucks The NECL Model only assessed the impact of MARPOL Annex VI amendments on RoRo shipping. For these ship services it is assumed that the long term utilisation of ships (i.e. average % use of cargo space) is 55%. It is believed that in the long term services with utilisations of less than 50%, generally, become uncompetitive and cease. For the purposes of this study it is assumed that truck utilisation10 will be 75%. The assumptions in terms of ship design speed, trailer capacity and engine-size and for each of the ships used are listed in table 5.10.
10
Truck utilisation is defined as the percentage of available driving time per truck spent carrying goods.
© SKEMA
Page 33
3rd June 2010
SKEMA –– Impact study on the future requirements of MARPOL Annex VI
Ship
Design Speed (Knots)
Capacity (Trailers)
Main Engine (kW)
A
22.5
332
20000
B&H
22.5
332
20000
C
17.5
154
9000
D
20
193
19000
E
23
273
20000
F
18
193
13000
G
17.5
194
12000
J
16
55
5300
K
21 178 Table 5.10: Ship characteristics
23000
The assumptions in terms of truck operational characteristics for the chosen land legs are listed in table 5.11 & 5.12.
2009
Distance-based costs (€/km) 0.39
2010
0.44
2015
0.57
2020
0.60
Year
2025 0.64 Table 5.11: Truck per kilometre costs
Fuel usage Time-based costs (l/km) (€/h) 0.35 4711 Table 5.12: Truck fuel usage per kilometre & time costs The emissions that are studied are carbon dioxide and sulphur. The sulphur and carbon content in the ship fuel is based on which fuel type is used. The emission factors for trucks are based on figures from the Finnish organisation VTT’s Lipasto database
Emissions
12
and are displayed in table 5.13.
SO2 (g/km)
Truck 0.007 Table 5.13: Vehicle emissions in g per km fuel for the year 2009 case.
11 12
Based on an annual driver salary cost of €30k. http://lipasto.vtt.fi/indexe.htm
© SKEMA
Page 34
3rd June 2010
SKEMA –– Impact study on the future requirements of MARPOL Annex VI
5.3.3 Installation of a Sea Water Exhaust Scrubber This scenario input facilitates a ship owner either switching to a low sulphur fuel or installing scrubbers. The installation of a sea water exhaust scrubber allows a ship operator to continue to use a high sulphur fuel after the 2015 deadline. The installation of a scrubber presently does not a guaranteed compliance solution as their continued use depends on the successful completion of long term scientific studies to prove they do not negatively impact the environment. As these studies have not yet been carried out, a ship owner is undertaking a certain level risk by installing a scrubber. It is possible that a ship owner may invest in installing a scrubber and then be required to remove the scrubber and convert to a low sulphur fuel a few years later.13 In the modelled scenarios it is assumed that the ships that use scrubbers between 2010 and 2015 will have the scrubbers retrospectively installed. From 2020 onwards it is assumed that the scrubbers will have been installed during ship construction. The following table delineates these criteria. Year
Scrubber Fitting
2009 Retro-fitted 2010 Retro-fitted 2015 Retro-fitted 2020 New Build 2025 New Build Table 5.14: Installation of Scrubber
5.3.4 NECL Model Scenarios Scenario Base Case
Brief Scenario Description No MARPOL
S1
MARPOL
S2
MARPOL + Infrastructural Toll
S3
MARPOL + Infrastructural Toll + Environmental Toll
S4
MARPOL + Infrastructural Toll + Environmental Toll + Scrubber
S5
Amended MARPOL Annex VI: 0.5% Sulphur
S6
MARPOL + Low Salary Truck Driver
The emissions per unit of CO2, SO2, NOx & Particulate Matter (PM) for each of the above scenarios are displayed in Section 6.
13
An environmental engineering development project between Aalborg Industries, MAN Die-sel, DFDS, the Danish
Environmental Protection Agency and Danish Shipowners' Association is currently (March 2010) in progress and should be reviewed when completed.
© SKEMA
Page 35
3rd June 2010
SKEMA –– Impact study on the future requirements of MARPOL Annex VI
5.4
TAPAS Result
The results from the simulation experiments show that for each scenario, one route is selected which offers the best transport solution for the product and transport demand of the customer. In the 2009 scenario, the route via Esbjerg is selected. Over 90% of the transport distance for this route (Route-5) is sea transportation (see Figure 5.1 & 5.2). When the fuel costs are increased for year 2010 due to the usage of fuel with lower sulphur content, the route via Cuxhaven (Route-2) is selected. From 2015 onwards the lower sulphur content requirement, which increases the fuel price to ship operators, results in the route via Rotterdam (Route-1) being selected. This route has the lowest share of sea transportation and is least susceptible to the fuel price increases that are a direct result of the MARPOL Annex VI amendments; table 5.15 displays the TAPAS results.
Year
Route Selected
Via
% Sea Share per Route
2009
5
Esbjerg
>90%
2010
2
Cuxhaven
>70%
2015
1
Rotterdam
>10%
2025 1 Rotterdam >10% Table 5.20: Alternative routes selected by TAPAS model
© SKEMA
Page 36
3rd June 2010
SKEMA –– Impact study on the future requirements of MARPOL Annex VI
5.5
NECL Model Result
The results of the NECL Model are presented graphically in the following sections. The first set of graphs show the average percentage change in costs from the Base Case for each of the six scenarios. The actual Base Case costs for each route can be seen in Appendix-F. 5.5.1 Routes 1 – 4
% Cost change from Base Case
25.0% 20.0% 15.0% 10.0% 5.0% 0.0% BC
S1
S2
S3
S4
S5
S6
-5.0% -10.0% Scenarios Route-1
Route-2
Route-3
Route-4
Figure 5.8: Percentage change from Base Case costs for Routes 1 – 4 for all scenarios
5.5.2 Routes 5 – 6
% Cost change from Base Case
25.0% 20.0% 15.0% 10.0% 5.0% 0.0% BC
S1
S2
S3
S4
S5
S6
-5.0% -10.0% Scenarios Route-5
Route-6
Figure 5.9: Percentage change from Base Case costs for Routes 5 – 6 for all scenarios © SKEMA
Page 37
3rd June 2010
SKEMA –– Impact study on the future requirements of MARPOL Annex VI
5.5.3 Routes 7 – 8
% Cost change from Base Case
25.0% 20.0% 15.0% 10.0% 5.0% 0.0% BC
S1
S2
S3
S4
S5
S6
-5.0% -10.0% Scenarios Route-7
Route-8
Figure 5.10: Percentage change from Base Case costs for Routes 7 – 8 for all scenarios
5.5.4 Routes 9 – 10
% Cost change from Base Case
25.0% 20.0% 15.0% 10.0% 5.0% 0.0% BC
S1
S2
S3
S4
S5
S6
-5.0% -10.0% Scenarios Route-9
Route-10
Figure 5.11: Percentage change from Base Case costs for Routes 9 – 10 for all scenarios
© SKEMA
Page 38
3rd June 2010
SKEMA –– Impact study on the future requirements of MARPOL Annex VI
5.5.5 Potential for Modal Shift Companies or individuals who purchase transport services each have specific requirements, and numerous factors influence their final choice. Some of the more common influencing factors are as follows: ·
Cost
·
Transit time
·
Reliability
·
Flexibility
·
Frequency of service
·
Probability of loss
·
Probability of damage
·
Cargo characteristics: Perishable nature of cargo, Value of cargo, Durability of cargo
Other, less quantifiable, factors also play a role in the decision of which transport service to purchase, factors such as: ·
Existing long term relationships with transport suppliers
·
Cargo Volume and Contract Duration discounts
·
Knowledge of transport purchaser
The NECL model only performs limited route selection; therefore a quantitative modal split cannot be presented for the RoRo scenario. Using expert opinion, reasoned argument and simplified assumptions it is possible to reach some outline conclusions on route selection. It has been found previous by NECL that cargo which utilises RoRo transport can be grouped into three broad groups in terms of value: ·
High value
·
Medium value
·
Low Value
A secondary broad classification is the durability of the goods: ·
Durable
·
Non-durable or perishable nature
In general, the higher the value of the goods the greater their time value; this refers to the Euro value of time ascribed to the time spent in storage or transit. In cases where the time value is very high, the shipper will always utilise the mode or route with the shortest transit time. This scenario assumes uniform levels of reliability for all routes, a necessary simplification in this discussion. Based on these assumptions it has been found through interviews with shippers by NECL that transporting goods by SSS must be approximately 15% cheaper than the land alternative to be considered equitable. That is to say that for the cargo types specified previously, when the SSS © SKEMA
Page 39
3rd June 2010
SKEMA –– Impact study on the future requirements of MARPOL Annex VI
option is 15% cheaper than the land alternative; approximately 50% of the cargo will travel by SSS and 50% by land. Using this fact a simple logistic equation was generated to provide an indication of the changes in route selection as a result of the six scenarios. The following graphs display the average market share per route for all six scenarios between 2015 and 2025. The share of cargo travelling by land within each of the graphs is indicated in black. 100% 90%
% Market Share
80% 70% 60% 50% 40% 30% 20% 10% 0% BC
S1
S2
S3
S4
S5
S6
Scenarios Route-1
Route-2
Route-3
Route-4
Figure 5.12: Percentage market share for Routes 1 – 4 for all Scenarios
100% 90%
% Market Share
80% 70% 60% 50% 40% 30% 20% 10% 0% BC
S1
S2
S3
S4
S5
S6
Scenarios Route-5
Route-6
Figure 5.13: Percentage market share for Routes 5 – 6 for all Scenarios
© SKEMA
Page 40
3rd June 2010
SKEMA –– Impact study on the future requirements of MARPOL Annex VI
100% 90%
% Market Share
80% 70% 60% 50% 40% 30% 20% 10% 0% BC
S1
S2
S3
S4
S5
S6
Scenarios Route-7
Route-8
Figure 5.14: Percentage market share for Routes 7 – 8 for all Scenarios
100% 90%
% Market Share
80% 70% 60% 50% 40% 30% 20% 10% 0% BC
S1
S2
S3
S4
S5
S6
Scenarios Route-10
Route-9
Figure 5.15: Percentage market share for Routes 9 – 10 for all Scenarios
© SKEMA
Page 41
3rd June 2010
SKEMA –– Impact study on the future requirements of MARPOL Annex VI
6
Emissions Impact as a Result of MARPOL Annex VI
6.1
CO2 Emissions
The following graph displays the average CO2 emissions (tonnes) per unit for the Base Case. 8.00 7.00
CO2 (Ton/Trailer)
6.00 5.00 4.00 3.00 2.00 1.00
10 R
ou t
e-
e9 R ou t
-8 R ou te
R ou te -7
R ou te -6
-5 R ou te
R ou te -4
R ou te -3
ou te -2 R
R ou t
e1
0.00
Figure 6.1: Average CO2 emission per unit for all years The installation of an exhaust scrubber results in a slight increase in CO 2 emissions due to the additional energy requirements of running the associated pumping equipment. This increase is displayed in the following graph. 0.14
CO2 (Ton/Trailer)
0.12 0.10 0.08 0.06 0.04 0.02
10 R
ou t
e-
e9 R ou t
-8 R ou te
R ou te -7
R ou te -6
-5 R ou te
R ou te -4
R ou te -3
ou te -2 R
R ou t
e1
0.00
Figure 6.2: Increase in tonnes of CO2 per unit following installation of a scrubber © SKEMA
Page 42
3rd June 2010
SKEMA –– Impact study on the future requirements of MARPOL Annex VI
6.2
SO2 Emissions
6.2.1 Scenario S1 – S4 & S6: Sulphur Dioxide Emissions The following graph displays the reduction in SO2 per unit as a result of the introduction of the MARPOL limits. As expected there is a ten fold reduction on SO2 emissions from 2010 to 2015. 40.00 35.00
kg(SO2) / Trailer
30.00 25.00 20.00 15.00 10.00 5.00 0.00 2010 Route-1 Route-7
2015 Route-2 Route-8
Route-3 Route-9
2020 Route-4 Route-10
2025 Route-5
Route-6
Figure 6.3: Emissions of SO2 per unit for the Base Case 6.2.2 0. Scenario S5: Sulphur Dioxide Emissions The following graph displays SO2 per unit as a result of the introduction of an amended MARPOL limit of 0.5% sulphur limit in 2015. 40.00 35.00
kg(SO2) / Trailer
30.00 25.00 20.00 15.00 10.00 5.00 0.00 2010
2015 Route-1 Route-6
Route-2 Route-7
2020 Route-3 Route-8
2025 Route-4 Route-9
Route-5 Route-10
Figure 6.4: Emissions of SO2 per unit assuming a 0.5% sulphur limit in 2015 © SKEMA
Page 43
3rd June 2010
SKEMA –– Impact study on the future requirements of MARPOL Annex VI
6.3
NOx Emissions
The following graph displays the NOx emissions for the base case. There is a slight reduction from 2010 onward due to the improved NOx performance of EURO-V and EURO-VI trucks. 120.00
NOx (kg per Trailer)
100.00 80.00 60.00 40.00 20.00
ou te -1 0 R
ou te -9 R
R ou te -8
R ou te -7
ou te -6 R
ou te -5 R
ou te -4 R
ou te -3 R
ou te -2 R
R ou te -1
0.00
Figure 6.6: Emissions of NOx per unit for the Base Case The NOx emissions calculated as part of this study did not account for the introduction of the Tier II and Tier III standards on the modelled route. Therefore this graph represents a worst case in terms of NOx emissions up 2025.
© SKEMA
Page 44
3rd June 2010
SKEMA –– Impact study on the future requirements of MARPOL Annex VI
6.4
PM Emissions
The following graph displays the PM emissions for the base case for all years. 5.00 4.50
PM (kg per Trailer)
4.00 3.50 3.00 2.50 2.00 1.50 1.00 0.50
R ou te -9 R ou te -1 0
R ou te -8
R ou te -7
R ou te -6
R ou te -5
R ou te -4
ou te -3 R
R ou te -2
R ou te -1
0.00
Figure 6.7: Emissions of Particulate Mater (PM) per unit for the base case Information on the reduction of particles as a result of conversion to lower sulphur fuel was not available to the consortium and the results presented above are based on figures available for particulate emissions as a result of using LS180. This graph also does not cover secondary particles that form as a result of slow chemical reactions between the NOx & SOx within the exhaust fumes and elements in the environments.
© SKEMA
Page 45
3rd June 2010
SKEMA –– Impact study on the future requirements of MARPOL Annex VI
7
Discussion
All of the comparative routes shall be reviewed in terms of the predicted impact of each of the six scenarios (S1 – S6) on market share and environmental emissions. 7.1
Routes R1 – R4
The introduction of MARPOL in it current format, scenario S1, predicts an 8% increase in market share by Route-1, the predominantly road transport route. This is principally at the expense of Route-3, which looses 5% of total market share, representing 64% of its Base Case cargo volumes. This is best illustrated in by the following graph:
% Change in cargo volumes per route
40.0% 20.0%
0.0% BC
S1
S2
S3
S4
S5
S6
-20.0%
-40.0% -60.0%
-80.0% Scenarios Route-1
Route-2
Route-3
Route-4
Figure 6.8: Percentage change in relative market share per route and per scenario As can be seen from Figure 6.8 the step change in market share as a result of S1 is essentially continued in S2 & S3. This serves to undermine the potential impact of the two Eurovignettes even if fully implemented. The current market share is only maintained for scenario S4 which facilitates the ongoing usage of high sulphur fuel in connection with an exhaust scrubber. The market share impact of amending the MARPOL 2015 limit to 0.5% does serve to reduce the impact though a modal shift would still be expected. The scenario S6 presents and case where truck driver salaries are held at reduced levels which leads to an inevitable shift from more expensive SSS to road resulting in a 25% increase in the relative market share of road on this corridor. This reduction in cargo flows on Route-3 is, however, beneficial to the environment as Route-3 is the highest contributor per trailer of CO2, SO2, NOx and PMs. It is felt that this service itself is uncompetitive and would not attract sustainable cargo volumes given the alternative routes available. © SKEMA
Page 46
3rd June 2010
SKEMA –– Impact study on the future requirements of MARPOL Annex VI
7.2
Routes R5 & R6
As displayed in the Figure 6.9; scenarios S1 – S2 see an approximately 10% shift in cargo volumes from the SSS option to the road option. On this corridor a slight advantage is afforded the SSS option in scenario S4 due to the introduction of see water scrubbers.
% Change in cargo volumes per route
20.0% 15.0% 10.0% 5.0% 0.0% BC
S1
S2
S3
S4
S5
S6
-5.0% -10.0% -15.0% -20.0% Scenarios Route-5
Route-6
Figure 6.9: Percentage change in relative market share per route and per scenario Scenarios S3 and S5 see similar results, however, either scenario would be politically very difficult to achieve before the 2015 MAROL 0.1% sulphur limit introduction. As with the previously corridor; scenario S6 results in a dramatic 15% change in relative market share from the SSS option to land. From an environmental perspective Route-5 produces 26% more CO2, 80% more NOx and 24 times the amount of PMs per trailer than Route-6.
© SKEMA
Page 47
3rd June 2010
SKEMA –– Impact study on the future requirements of MARPOL Annex VI
7.3
Routes R7 & R8
This corridor sees the same changes as those identified and described in the previous section (Section 6.5.2) with one notable exception; the scenario S4 does not lead to an advantage for the SSS option.
% Change in cargo volumes per route
40.0% 30.0% 20.0% 10.0% 0.0% BC
S1
S2
S3
S4
S5
S6
-10.0% -20.0% -30.0% Scenarios Route-7
Route-8
Figure 6.10: Percentage change in relative market share per route and per scenario 7.4
Routes R9 & R10
This corridor again tells the same story of increased market share by the predominantly road route (R9), however, S4 if implemented will retain the status quo.
% Change in cargo volumes per route
40.0% 30.0% 20.0% 10.0% 0.0% BC
S1
S2
S3
S4
S5
S6
-10.0% -20.0% -30.0% Scenarios Route-10
Route-9
Figure 6.11: Percentage change in relative market share per route and per scenario © SKEMA
Page 48
3rd June 2010
SKEMA –– Impact study on the future requirements of MARPOL Annex VI
8
Conclusions
The scenario for the LoLo shipping for the selected routes, as modelled by the TAPAS model, predicts a shift away from sea transport towards road transportation. The primary rationale for this change is the cost escalation imposed by the new MARPOL Annex VI amendments. The scenario for the RoRo shipping for the selected routes, as modelled by the NECL model, predicts an increase in the market share of road transportation for all corridors following the 2015 implementation of the MARPOL Annex VI amendments. The implementation of the Eurovignette infrastructural and environmental tolls does not sufficiently counteract the cost increases due to the MARPOL requirements. The installation of sea water exhaust scrubbers from 2015 onwards will essentially preserve the current modal split. These results must, however, be viewed in context and some additional points must be acknowledged with respect to the installation of scrubbers. As demonstrated in Section 5.5, the installation of a scrubber will result in savings for the ship owner when viewed against the option of converting to low sulphur fuel. In addition to this benefit, there is also an environmental benefit not quantified in this study and this is the removal of particulates from the exhaust. This study assumes that when a scrubber is installed the ship owner continues to use fuel with a sulphur content of 1.5% (i.e. LS180). It is however possible, depending on the specification of the scrubber, to utilise higher sulphur content fuel and still remain compliant with the regulations. Using a higher sulphur content fuel would further reduce the cost burden to ship owners and thereby introduce a cost advantage for shipping over road. As noted in Section 5.3.3 the utilisation of scrubbers does not currently guarantee compliance going forward as this technology is still in the process of being proven with regard to its long term impact on the marine environment. As anticipated the impending MARPOL Annex VI amendments has limited impact on CO2 emissions. There is a slight reduction in CO2 generated for the ‘Low Sulphur Fuel’ option due to the greater engine efficiencies achieved when using distillate fuel (MGO). However, if the industry shifts toward the use of scrubbers in conjunction with high sulphur content fuel (HFO) this will result in a further increase in CO2 emissions. A caveat to this is that the additional CO2 released as a result of the further refining required to produce low sulphur fuel is not accounted for in this study. The conclusions reached in this study apply to the routes modelled under the assumptions detailed in Sections 5.2 & 5.3. The routes selected for this study, whilst representing actual routes, are not a direct comparison between shipping and road. This is primarily due to the © SKEMA
Page 49
3rd June 2010
SKEMA –– Impact study on the future requirements of MARPOL Annex VI
geography of the navigable channels in the Baltic. For this reason it is difficult to compare directly the impact of MARPOL Annex VI amendments on shipping, with road held constant, as the two modes are interdependent on these routes. From an examination of the sensitivities of the assumptions made during this study it was found that mode utilisation14 had a significant impact on overall route costs and hence the differential in competitiveness between the modelled routes. A decrease in the utilisation of trucking and an increase in utilisation of shipping would change the unit cost ratios. Further details on these assumptions can be seen in Sections 5.2 & 5.3.
14
Refers to the degree to which a resource is fully utilised during a voyage; number of containers/trailers onboard
divided by ship’s container/trailer carrying capacity.
© SKEMA
Page 50
3rd June 2010
SKEMA –– Impact study on the future requirements of MARPOL Annex VI
9
References
Chengfeng and Corbett, The costs and benefits of reducing SO2 emissions from ships in the US West Coastal waters, 2007 Civic exchange, CEC, Green Harbours: Hong King and Shenzhen – Reducing Marine and Port related emissions, 2008 Civic exchange, CEC, Marine emissions reducing options for Hong King and the Pearl River Delta, 2006 Davidsson, P, Holmgren, J., Persson, J.A., Ramstedt, L., Multi Agent Based Simulation of Transport Chains, Proc. of 7th Int. Conf. on Autonomous Agents and Multiagent Systems (AAMAS 2008), Padgham, Parkes, Müller and Parsons (eds.), May, 12-16., 2008 Endresen Ø et al., Improved modelling of ship SO2 emissions—a fuel-based approach, Atmospheric Environment volume 39, 2005 Entec Consulting Ltd., Service Contract on Ship emissions: assignment, abatement and marketbased instruments, Teask 2c – SO2 abatement, 2005 European Union (EU), 2002. Communication from the Commission to the European Parliament and the Council: A European Union strategy to reduce atmospheric emissions from seagoing ships, COM(2002) 595 final, volume I, 2002, European Union (EU), 2004. Proposal for a Directive of the European Parliament and of the Council amending directive 1999/32/EC as regards to the sulphur content of marine fuels, Information note, 2004 Directive 2005/33/EC of the European Parliament and the Council, 2005 Finnish Ministry of Transport and Communications Sulphur content in ships bunker fuel in 2015 A study on the impacts of the new IMO regulations on transportation costs, 2009 Fortum Oyj, Raskaan polttoöljyn käyttöopas (Heavy Fuel Oil Guide) 2002. Gregory D. and Trivett A., ‘Using seawater for scrubbing SOx and PM from the exhaust of a marine heavy-fuel engine’ Internal report BP Marine and DME International Ltd. 2002. Hammingh et al, Effectiveness of international emission control measures for North Sea shipping on Dutch air quality, Netherlands Environmental Assessment Agency, 2007 © SKEMA
Page 51
3rd June 2010
SKEMA –– Impact study on the future requirements of MARPOL Annex VI
Henriksson, T, SOx scrubbing of marine exhaust gases, Wärtsila Technical Journal, 2007 International Energy Agency, IEA, Key Energy Statistics, 2007 International Maritime Organisation, IMO, Annex VI of MARPOL 73/78: Regulations for the prevention of air pollution from ships and NOx technical code. Publication IMO-664E, London, UK, 1998 IMO, International Maritime Organisation, Resolution MEPC.170 (57), Guidelines for exhaust gas cleaning systems, 2008 IMO, International Maritime Organisation, Revision of MARPOL Annex VI and the NOx technical code, BLG 12/INF.10, 2007 Litman, Todd, Transportation Cost and Benefit Analysis; Techniques, Estimates and Implications, Victoria Transport Policy Institute, 2001 Miola, et al External costs of Transportation, Case study: Maritime Transport, Institute for Environment and Sustainability IES, 2009 Olivier, J.G.J., Berdowski, J.J.M., 2001. Global emissions: sources and sinks. In: Berdowski, J., Guicherit, R., Heij, B.J. (Eds.), The Climate System. A.A. Balkema Publishers/ Swets & Zeitlinger Publishers, Lisse, The Netherlands, pp. 33–78 Purvin & Gertz, Impacts on the EU Refining Industry & Markets of IMO Specification Changes & Other Measures to Reduce the Sulphur Content of Certain Fuels, 2009 Ramstedt, L., Transport policy analysis using multi-agent-based simulation, Doctoral dissertation Series No. 2008:9, Blekinge Institute of Technology, 2008. Review of the Current Development and Commercial Availability of EGC systems for SOx and PM, Consolidated response from members of the Exhaust Gas Cleaning Systems Association, date unknown Smith, S.J., Andres, R., Conception, E., Lurz, J., 2004. Historical Sulfur Dioxide Emissions 1850–2000: Methods and Results, PNNL Research Report, Joint Global Change Research Institute, 8400 Baltimore Avenue College park, Maryland 20740, January 2004.
© SKEMA
Page 52
3rd June 2010
SKEMA –– Impact study on the future requirements of MARPOL Annex VI
Trivett, A., MacDonald, G. and Trivett, G. ‘A report on field trials of a novel wet scrubber for marine diesel engines’, Institute of Marine Engineering, Science and Technology, London, England. IMarEST conference paper. 1999. Trozzi, Carlo and Vaccaro, Rita, Methodologies for estimating future air pollutant emissions from ships, Techne report MEET RF98b, 1998 Karle, Ida-Maja and Turner, David, Seawater scrubbing – reduction of SOx emissions from ship Exhausts, Dept of Chemistry, Göteborg University, 2007 United States Environmental Protection Agency, US EPA, Indicators of the environmental impacts of Transportation, 1999 Zhou, P. L. and Montgomery, S. (1999) ‘Application of a water scrubber for cleaning diesel engine exhaust gases’ Institute of Marine Engineering, Science and Technology, London, England. IMarEST conference paper.
© SKEMA
Page 53
3rd June 2010
SKEMA –– Impact study on the future requirements of MARPOL Annex VI
10 Appendix – A: Sea Water Scrubbers Information
Figure 9.1: The scrubbing process
Figure 9.2: Emissions corresponding to fuel S content Source: Karle and Turner
Table 9.1: Accepted oily waste under direct fee, Port of Rotterdam Source: Entec
© SKEMA
Page 54
3rd June 2010
SKEMA –– Impact study on the future requirements of MARPOL Annex VI
11 Appendix – B: NECL Model Inputs Ship Details
Truck Details
Ship capacity (TEU or Trailer)
Truck Route & Schedule
Design speed (knots)
Average Distance per year (km)
Main engine size (kW)
Average speed (km/hr)
Bow thruster(s) engine size (kW)
Maintenance costs (€/year)
Auxiliary engine size (kW)
Tyres costs (€/year)
Rate of fuel usage for engines whilst at sea (g/kWh)
Truck class (EURO I-VI)
Rate of fuel usage for engines whilst in port (g/kWh)
Capital & driver cost (€/km)
Rate of fuel usage whilst manoeuvring (g/kWh)
Commission charge (€/Trip)
Daily charter rate (€/day)
Delays in port (hrs)
Ship Service Details
Data Reference Sets
Ship Service Route & Schedule
Port to Port distance (Nm)
Service speed (knots)
Port to Drop-off/Pick-up distance (km)
Reserve fuel allowance (Tons) Working hours per year per ship (hrs) Target number of trips per year Empties on board (TEU or Trailer) Departure time & date Delays imposed by weather Port Details Tie-up time (hrs) Delay in port (hrs) Ship charges per visit (€) Ship charges per TEU or Trailer (€/TEU or Trailer) Estuary length (km) Load/unload rate (TEU/hr)
© SKEMA
Page 55
3rd June 2010
SKEMA –– Impact study on the future requirements of MARPOL Annex VI
12 Appendix – C: Sample Calculation of CO2 Emitted by Ship Ship: Design Speed:
18knots
Design Fuel Consumption of Main Engine:
185g/kWh
Main Engine Size:
12,000kW
Trailers:
190
Fuel: Fuel Type:
LS180
Sulphur Content:
1.5%
Carbon Content:
87%
Percentage of Carbon Combusted:
99%
Ship Service: Voyage distance:
324Nautical Miles
Percentage cargo space used
65%
Molecular Masses: Carbon:
12kg/kmole
Oxygen:
16kg/kmole
Carbon Dioxide (CO2):
44kg/kmole
Sulphur:
32kg/kmole
Sulphur Dioxide (SO2):
64kg/kmole
Calculation:
æ 12723 ´ 185 ö ÷ = 2.35 Tons/hr 6 è 1 ´ 10 ø
Design Fuel Consumption = ç
3
æ 18 ö Actual Fuel Consumption = 2.35 ´ ç ÷ = 2.35 Tons/hr è 18 ø Fuel Consumed during Voyage = 2.35 ´ 21.11 = 49.69 Tons/voyage
æ 44 ö ÷ = 3.667 è 12 ø
Ratio of CO2 mass to Carbon = ç
CO2 emitted during Voyage = (49.69 ´ 87% ´ 99% ´ 3.667 ) = 157 Tons CO2/voyage
æ 157 ö ÷ = 1.27 Tons CO2/trailer/voyage è 190 ´ 65% ø
CO2 emitted during Voyage per trailer = ç
© SKEMA
Page 56
3rd June 2010
SKEMA –– Impact study on the future requirements of MARPOL Annex VI
13 Appendix – D: Sample Calculation of SO2 Emitted by Ship Using the same data specified in Appendix 12 the SO2 emitted by a ship is calculated as follows: Fuel consumed during voyage: ·
49.69tons of fuel with a 1.0% sulphur content
·
3.04tons of fuel with a 0.1% sulphur content
Sulphur emitted during voyage = (49.69 ´ 1.0% + 3 ´ 0.1% ) = 0.4999 tons sulphur/voyage Assuming 100% of sulphur (molecular mass = 32kg/kmole) is converted to SO2 (molecular mass = 64kg/kmole) this implies that 1kg of free sulphur will generate 2kg of SO2. SO2 emitted during voyage = = (0.4999 ´ 2) = 0.999 tons SO2/voyage
æ 0.999 ö ÷ ´ 1000 = 8.09 kg SO2/trailer/voyage è 190 ´ 65% ø
SO2 emitted during voyage per trailer = ç
© SKEMA
Page 57
3rd June 2010
SKEMA –– Impact study on the future requirements of MARPOL Annex VI
14 Appendix – E: Sample Calculation of NOx Emitted by Ship Using the same data specified in Appendix 12 the NOx emitted by a ship is calculated as follows: Fuel consumed during voyage = 49.69ton NOx emission per kilometre = 5164grams/km15 (based on a service speed of 18 knots) Distance travelled at service speed = 324 Nautical Miles Distance travelled in kilometres = 324 x 1.852 = 600km
æ 5164 ´ 600 ö ÷ = 3098 kg of NOx è 1000 ø
NOx emitted during voyage = ç
æ 3098 ö ÷ = 25 kg NOx/trailer/voyage è 190 ´ 65% ø
NOx emitted per Trailer = ç
15
Based on figures from the Finnish Lipasto database (http://lipasto.vtt.fi/indexe.htm).
© SKEMA
Page 58
3rd June 2010
SKEMA –– Impact study on the future requirements of MARPOL Annex VI
15 Appendix – F: Average Base Case costs for all Routes (2015 – 2025)
Average Cost (Base Scenario 2015-2025)
€4,000 €3,500 €3,000 €2,500 €2,000 €1,500 €1,000 €500 €0 Route-1
Route-2
Route-3
Route-4
Average Cost (Base Scenario 2015-2025)
€4,000 €3,500 €3,000 €2,500 €2,000 €1,500 €1,000 €500 €0 Route-5
© SKEMA
Route-6
Page 59
3rd June 2010
SKEMA –– Impact study on the future requirements of MARPOL Annex VI
Average Cost (Base Scenario 2015-2025)
€4,000 €3,500 €3,000 €2,500 €2,000 €1,500 €1,000 €500 €0 Route-7
Route-8
Route-9
Route-10
Average Cost (Base Scenario 2015-2025)
€4,000 €3,500 €3,000 €2,500 €2,000 €1,500 €1,000 €500 €0
© SKEMA
Page 60
3rd June 2010