Chapter 3: Microfluidic Directed Liposome Formation of Controlled Size. ...... primary mechanisms: encapsulation, partitioning, and reverse/remote loading.69 ...... power is maintained by manually adjusting the polarization optics to eliminate ...... Knight, J.B., Vishwanath, A., Brody, J.P. & Austin, R.H. Hydrodynamic focusing.
Abstract Title:
CONTROLLED LIPOSOME FORMATION AND SOLUTE ENCAPSULATION WITH CONTINUOUS-FLOW MICROFLUIDIC HYDRODYNAMIC FOCUSING Andreas Jahn, Doctor of Philosophy, 2008
Directed By:
Professor Don L. DeVoe, Department of Mechanical Engineering
Liposomes enable the compartmentalization of compounds making them interesting as drug delivery systems. A drug delivery system (DDS) is a transport vehicle for a drug for in vivo drug administration.
Drugs can be encapsulated, bound, or
otherwise tethered to the carrier which can vary in size from tens of nanometers to a few micrometers. Liposomal DDSs have shown their capability to deliver drugs in a new fashion, allowing exclusive sales of encapsulated drugs to be extended beyond the initial compound’s patent expiration date. However, existing methods to form liposomes and encapsulate drugs are based on bulk mixing techniques with limited process control and the produced liposomes frequently require post-processing steps. In this dissertation, a new method is demonstrated to control liposome formation and compound encapsulation that pushes beyond existing benchmarks in liposome size homogeneity and adjustable encapsulation. The technology utilizes microfluidics for future pharmacy-on-a-chip applications. The microfluidic system allows for precise control of mixing via molecular diffusion with reproducible and controlled physicochemical conditions compared to traditional bulk-phase preparation techniques (i.e. test tubes and beakers). The laminar flow and facile fluidic control in microchannels
enables reproducible self-assembly of lipids into liposomes in a sheathed flow-field. Confining a water-soluble compound to be encapsulated to the immediate vicinity where liposome formation is expected to occur reduces sample consumption without affecting liposome loading. The ability to alter the concentration and control the amount of encapsulated compounds within liposomes in a continuous-flow mode is another interesting feature towards tailored liposomal drug delivery. The liposome formation strategy demonstrated in this dissertation offers potential for point-of-care drug encapsulation, eliminating shelf-life limitations inherent to current liposome preparation techniques.
CONTROLLED LIPOSOME FORMATION AND SOLUTE ENCAPSULATION WITH CONTINUOUS-FLOW MICROFLUIDIC HYDRODYNAMIC FOCUSING
By
Andreas Jahn
Dissertation submitted to the Faculty of the Graduate School of the University of Maryland, College Park, in partial fulfillment of the requirements for the degree of Doctor of Philosophy 2008
Advisory Committee: Professor Don L. DeVoe, Chair Associate Professor Srinivasa Raghavan Associate Professor Keith Herold Assistant Professor Helim Aranda-Espinoza Associate Professor David Bigio, Dean’s representative
© Copyright by Andreas Jahn 2008
Acknowledgements I would like to thank my research advisor, Don L. DeVoe, and my NIST project leaders, Michael Gaitan and Laurie E. Locascio for their years of project guidance, and for, of course, their financial support. Additionally, I am especially indebted to Wyatt N. Vreeland whose expertise and support served as an excellent complement in the pursuit of my graduate studies. Finally, I am grateful to Srinivasa Raghavan, Keith Herold, Helim Aranda-Espinoza, and David Bigio for the participation in my defense committee. A must also express my gratitude to many of my coworkers at NIST who helped me with succeeding on my endeavors. These are in no particular order: Joseph E. Reiner, Sam Stavis, John Geist, Brian Nablo, Joey Robertson, Jane Wilkes, David Ross, Jennifer S. Hong, John J. Kasianowisz, Jason Karlj, and Nicole Morgan. Many thanks go to Russell E. Hajdaj at the NIST AML and John M. Moreland at NIST in Boulder for helping me with the chip fabrication. Lastly, and most importantly, I want to thank Steffi Jacob for her undivided support and love on all my endeavors; Roland Raederscheidt, Tammy Macartney, Vivian Luna, Ksenia Brazhnik for their continuous motivation and belief during my graduate studies.
ii
Table of Contents Acknowledgements ........................................................................................................... ii Table of Contents ............................................................................................................. iii Chapter 1: Introduction................................................................................................. 1 1.1 Motivation........................................................................................................... 1 1.2 What are Liposomes?.......................................................................................... 3 1.2.1 Classification of Liposomes........................................................................ 5 1.2.3 Traditional Liposome Bulk Formation Methods ........................................ 9 1.3 Nanoparticle Formation with Microfluidics ..................................................... 12 Chapter 2: Concept of Microfluidic Liposome Formation ......................................... 16 2.1 Liposome Formation with MHF ...................................................................... 16 2.2 Encapsulation with MHF ................................................................................. 20 2.3 Microfluidic Channel Design and Device Fabrication ..................................... 23 2.3 Characterization of Liposome Size, Size Distribution, and Encapsulation ..... 29 Chapter 3: Microfluidic Directed Liposome Formation of Controlled Size............... 33 3.1 Introduction....................................................................................................... 33 3.2 Description of Experimental Procedures .......................................................... 33 3.2.1 Device Fabrication .................................................................................... 33 3.2.2 Materials ................................................................................................... 35 3.2.3 Liposome Formation................................................................................. 35 3.2.4 Microscopic Imaging ................................................................................ 36 3.2.5 Cryogenic Transmission Electron Microscopy......................................... 36 3.2.6 Light Scattering and AF4 Procedure ......................................................... 37 3.3 Results and Discussion ..................................................................................... 38 3.3.1 Influence of Qt and Shear Forces on Liposomes Formation..................... 41 3.3.2 Influence of FRR on Liposomes Formation ............................................. 42 3.4 Summary .......................................................................................................... 47 Chapter 4: Geometric and Hydrodynamic Aspects of Liposome Formation ............. 48 4.1 Introduction....................................................................................................... 49 4.1 Description of Experimental Procedures ......................................................... 50 4.1.1 Device Fabrication .................................................................................... 50 4.1.2 Materials ................................................................................................... 52 4.1.3 Liposome Formation................................................................................. 52 4.1.4 Light Scattering and AF4 Procedure ......................................................... 52 4.2 Results and Discussion .................................................................................... 53 ....................................................................................................................... 54 4.2.2 Influence of Microchannel Geometry on Liposome Formation ............... 55 4.2.3 Influence of Qt on Liposome Formation at High and Low FRRs............. 58 4.2.4 Influence of Diffusive and Convective Mixing on Liposome Formation. 60 4.2.5 Reproducibility of Liposome Formation with MHF................................. 73 4.3 Summary .......................................................................................................... 75 Chapter 5: Controlled Encapsulation of a Model Drug in Nano-Liposomes ............. 77 5.1 Introduction...................................................................................................... 77 5.2 Description of Experimental Procedures ......................................................... 79 5.2.1 Materials ................................................................................................... 80
iii
5.2.2 Liposome Formation................................................................................. 80 5.2.3 Fluorescence Fluctuation Spectroscopy.................................................... 81 5.3 Results and Discussion .................................................................................... 86 5.3.1 Liposome Size Distribution after Gel Permeation Chromatography........ 86 5.3.2 Free SRB Dye Fluctuations ...................................................................... 88 5.3.3 High Encapsulation of Low Concentrated SRB in Nano-liposomes ........ 91 5.3.4 Reducing the Amount of Non-Encapsulated SRB with MHF .................. 96 5.4 Summary ........................................................................................................ 100 Chapter 6: Summary and Future Work..................................................................... 102 6.1 Future Work: Functionalizing Liposomes ..................................................... 105 Appendix A..................................................................................................................... 111 Gel Permeation Chromatography ............................................................................... 111 Lightscattering ............................................................................................................ 113 Quasi-Elastic Light Scattering ................................................................................ 114 Multi-angle Laser Light Scattering......................................................................... 118 Asymmetric Flow Field-Flow Fractionation .......................................................... 124 Separation Method with AF4 .................................................................................. 126 Fluorescence Correlation Spectroscopy...................................................................... 130 Fluorescence Cumulant Analysis................................................................................ 134 Nomenclature.............................................................................................................. 138 Bibliography ................................................................................................................... 140
iv
Chapter 1: Introduction 1.1
Motivation
Utilizing liposomes as drug delivery systems (DDSs) offers the ability to formulate drugs for sustained release, targeted delivery, and extended longevity of sensitive encapsulated molecules. A DDS is a combination of a transport vehicle and a drug for in vivo administration. Drugs can be encapsulated, bound, or otherwise tethered to the carrier, which can vary in size from tens of nanometers to a few micrometers. Examples for carriers are liposomes, solid lipid particles, polymeric particles, dendrimers, and functionalized particles.1,2
DDS products amount to about 13 % of the global
pharmaceutical market sales.3 The global drug delivery market is predicted to have revenues of $543.8 billion with an expected annual growth rate of 5 % between 2005 and 2010.4 The estimated sales of DDSs in the U.S. alone are expected to grow to $153.5 billion by 2011.5 The success of a DDS is not determined by its level of sophistication but the ability to add value to the pharmaceutical product. One such value is found in life cycle management of already marketed products.3 Drug companies face a substantial commercial demise of their major branded drugs as they reach their patent expiration date through reallocation of billions of dollars in revenues towards generic drug makers. DDSs can be applied to existing drugs to extend their commercial life. Doxil®,the first liposomal DDS approved by the Food and Drug Administration (FDA) in 19956, gained sales of $177 million in the US and 5 major European countries in 2005.7 Liposomal DDSs have shown their capability to deliver drugs in a new fashion, allowing exclusive sales of encapsulated drugs to be extended beyond the initial 1
compound’s patent expiration date. However, existing methods to form liposomes and encapsulate drugs are based on bulk mixing techniques with limited process control and the produced liposomes frequently require post-processing steps. In this dissertation, a new method is proposed to control liposome formation and compound encapsulation that pushes beyond existing benchmarks in liposome size homogeneity and adjustable encapsulation.
The technology utilizes microfluidics for future pharmacy-on-a-chip
applications. Microfluidics allows for explicit control of mixing via molecular diffusion with reproducible and controlled mechanical fluid forces over micrometer length-scales. Decreasing a sample streamwidth to sub-micrometer length-scales allows for controlled and reproducible mechanical and chemical conditions across the stream width, especially compared to traditional bulk-phase preparation techniques (i.e. test tubes and beakers). The laminar flow enables reproducible flow conditions for the self-assembly of lipids into liposomes in a sheathed flow-field.
Confining a water-soluble substance to be
encapsulated to the immediate vicinity of the alcohol stream where liposome formation is expected to occur reduces the sample consumption without adversely affecting the encapsulation of compounds into liposomes. The possibility of altering the concentration of the encapsulant from an initial starting concentration via controlled diffusive mixing enabling control over the loading efficiency of liposomes in a continuous flow mode is another interesting feature towards tailored liposomal drug delivery.
The liposome
formation strategy proposed in this dissertation could be implemented for point-of-care drug encapsulation eliminating shelf-life limitations of the liposome preparation method.
2
1.2
What are Liposomes?
Liposomes are microscopic spherical self-closed structures formed by one or more concentric lipid bilayers that can entrap water-soluble (hydrophilic) pharmaceutical agents in their internal water compartment and water-insoluble (hydrophobic) pharmaceuticals into the lipid-membrane, as shown in Figure 1.8,9 Liposomes are made of amphiphiles (molecules composed of a polar and apolar region) and have attracted great interest since their discovery in 1965 by A. Bangham et al. for a wide range of biological, pharmaceutical, and industrial applications.8,10-13 Liposomes are the smallest artificial vesicles of spherical shape, that can be completely produced from naturally occurring substances and are biocompatible, biodegradable, and non-immunogenic.8 All biological membranes contain lipids as primary constituents.
Lipid
molecules, the building blocks of liposomes, are surface-active amphiphiles with a head group that is strongly hydrophilic, coupled to a hydrophobic tail. Lipid molecules are insoluble in water and form colloidal dispersions.
In this proposal, lipids are
distinguished from detergent molecules by the fact that lipids are generally composed of two hydrocarbon chains, whereas detergent molecules contain only one hydrocarbon chain. If a large head group is attached to a single hydrocarbon chain, the molecule is wedge-shaped and will tend to form spherical micelles, which are spherical structures formed by a single layer of molecules that have a hydrocarbon core and a polar surface. A double tail yields a roughly cylindrical molecule. Such molecules can easily pack in parallel to form extended sheets of bilayer membranes with the hydrophilic head groups facing outwards into the aqueous regions on either side. The vesicle size ranges from 20 nm to several dozen micrometers while the thickness of the membrane is about 4 nm to 5 nm. 3
Figure 1 Schematic of a liposome that encapsulates a hydrophilic compound (red) in the interior and intercalates a lipophilic compound (green) within the lipid membrane. Shown is a lipid molecule that arranges into an ordered bilayer, which then closes into a spherical structure (liposome). Adapted from 14.
Because of their solubility properties the structure of liposomes involves the ordering of lipid molecules in such a way, that the polar head is in contact with water while the nonpolar hydrocarbon chain is hidden from water in the interior of the bilayered structures. Depending on the form factor of the lipid molecule they can form bilayers, micelles, or vesicles when in contact with water.
4
1.2.1
Classification of Liposomes Liposomes occur in a large variety of structures. Figure 2 groups liposomes
according to their structural properties and field of applications.15
An important
structural feature of liposomes is their size. Depending on its diameter liposomes are differentiated into small unilamellar (20 nm to 150 nm), large unilamellar (150 nm to 1000 nm), and multilamellar vesicles (>1000 nm). Liposomes can be composed of one or multiple bilayers and are distinguished into unilamellar or multilamellar vesicles. Further classification can be achieved by grouping liposomes according to their surface charge and surface property, which can be easily changed by modifying the lipid blend and adding new ingredients prior to the liposome preparation. Modifying the liposomes’ coatings can result in long-circulating liposomes in vivo. The bandwidth of diagnostic or therapeutic applications of liposomes is very large. An example is immunoliposomes, liposomes that have antibodies attached to their surfaces, which are able to accumulate in a specific location in the body as they recognizes and bind to its antigen. In this proposal primarily anionic, small unilamellar liposomes without further surface modification through additional substances are investigated.
5
According to size Small unilamellar vesicles (SUVs) Large unilamellar/multilamellar vesicles (LUVs/LMVs) Giant unilamellar/ mulilamellar vesicles (GUVs/GMVs) According to circulation in vivo Classical or conventional liposomes; sterically stabilized liposomes According to lamellarity Unilamellar, multilamellar According to application Diagnostic, therapeutic According to surface charge Cationic/Liposomal DNA vector, anionic, neutral Specialized liposomes, targeted liposome Immunoliposome, transferosome Liposomal DNA vector, LPDI (cationic with poly-L-lysine DNA complex), LPDII (anionic)
Figure 2 Classification
of
liposomes
according
applications.15
6
to
their
properties
and
1.2.2
Applications of Liposomes The ability to encapsulate and thereby segregate aqueous components led to a
variety of applications of liposomes. These include their use in biological systems as quantized reagent packets for the delivery of genes16,17 and deoxyribonucleic acid (DNA) vectors, drugs or other therapeutic agents18-27, contrast agents for enhanced magnet resonance imaging (MRI)28-31, model systems for the study of biological membranes and their fusion, transport studies, investigation of membrane proteins that can be reconstituted in liposomes,32 encapsulation of cells and proteins33, protective coatings for enzymes entrapped in silica sol-gel biocomposites34, or as templates for the formation of solid hydrogel nanoparticles.35,36
Liposomes are especially interesting as transport
vehicles for in vivo applications such as drug delivery systems (DDSs) where they can achieve selective and high localization of active drug at the disease site. Due to their biphasic character, liposomes can act as carriers for both lipophilic drugs that are compartmentalized in the bilayer and hydrophilic compounds that are encapsulated in their aqueous interior. A homogenous size distribution is important to assure a controlled drug dosage while liposome size ultimately influences the detection and clearance rate by the complement system.37 The extreme versatility of liposomes is due to the variability in their composition and surface modifications that allow liposomes to be tailored to a myriad of specific applications. Modifying liposomes with low molecular weight polyethyleneglycol (PEG) renders their surface more hydrophilic, which allows increased circulation times in the blood stream. These so called "stealth" liposomes are currently being used as carriers for hydrophilic anticancer drugs like doxorubicin, mitoxantrone and others.1
7
Other
modifications include rendering the liposome surface positive (cationic liposomes) for enhanced cell uptake or with antibodies for targeted drug delivery. Multiple liposomal DDSs that are FDA approved and have reached the market (i.e. Doxil/Caelyx (1995/1999), Myocet (2000), DepoCyt (1999), etc.) or are undergoing clinical evaluations are shown in Figure 3.1,8
Figure 3 Liposomal drugs approved for clinical application or undergoing clinical evaluation. Adapted from Torchilin.8
8
1.2.3
Traditional Liposome Bulk Formation Methods In order to produce liposomes, lipid molecules must be introduced into an
aqueous environment. However, most of the liposome-forming molecules, including all phospholipids, are insoluble in water. Mixing of dry powders or waxes with water results in inefficacious formation of liposomes: most of the lipid is not fully hydrated but instead trapped in the interior of structures, which are hydrated only in the outermost bilayers. Furthermore, in most cases the lipid mixture will not mix evenly into the particles formed. Additional treatment such as prolonged heat and mechanical treatments, even if successful in hydrating the lipids, generate lipid degradation. To facilitate the hydration of lipids one has to increase the surface-to-volume ratio of the lipid. This is commonly done either by preparing a dried thin lipid-film by evaporation from an organic phase, a porous cake of freeze-dried lipid, or fine powder of spray-dried lipid from the organic solution. The alternative possibility is to introduce lipids directly into water from the organic phase. This can be accomplished, depending on the miscibility of the particular organic solvent with water by emulsification, injection, solvent dialyses and extraction. Upon diffusion of the organic solvent into the surrounding water and vice versa, lipid monomers aggregate as the solvent mixes with the surrounding aqueous solution. There are a variety of methods available to produce liposomes in bulk solution processes (e.g., alcohol injection sonication
40,42
38-41
, membrane extrusion
40
, detergent dialysis
40
, and
), but in all cases they are formed by the self-assembly of phospholipid
molecules in aqueous solution to form a lipid bilayer membrane that encapsulates an aqueous core.
Comparison of liposome populations produced from those different
techniques reveals a great deal of variability in terms of average diameter and size
9
homogeneity, but the narrowest size distributions are most often obtained from multi-step methods that include an initial self-assembly followed by a post-processing step (most often, sonication or membrane extrusion). Figure 4 shows an overview of the most common procedures to generate liposomes from a lipid blend. In the commercially common thin-film-hydration method (Figure 4(Æ)) a lipid mixture is dissolved in an organic solvent, which is subsequently evaporated and results into a thin lipid-film on the inside wall of a glass flask. Hydration of the dry lipid-film with an aqueous solution and mechanical agitation results in the formation of liposomes.
LIPIDMIXTURE
dry lipid-film hydration
MLV dispersion
budd off
(colloidal) lipid solution
emulsification
(micro) emulsion
depletion / injection
fragmentation
detergent
extrusion
LUV
dissolution
miscible
SUV
LUV
immiscible
MLV
gel
LUV
Figure 4 Overview of common liposome preparation techniques. The blue arrows (Æ) depict a very common liposome formation procedure. The red arrow (Æ) shows the basic steps of the solvent injection method that can result in SUVs and LUVs (Æ).
10
Liposomes prepared with thin-film-hydration are characterized by a very heterogeneous dispersion of predominantly large multi-lamellar vesicles (LMV’s). Lipids can also be introduced into the aqueous phase directly from an organic solution (Figure 4 (Æ), (Æ)), so called alcohol injection method.38-41 Solvent injection is used when the organic solution is water-miscible, whereas demulsification is used when the solvent is immiscible with water. Injection of a lipid-containing organic solution yields liposomes when the organic solvent concentration in the final homogenous solution falls below the solubility limit of lipids. Additional mechanical, chemical, or electrostatic treatment will produce mixtures that form smaller less lamellar vesicles up to homogenous solutions of small unilamellar vesicles (SUV’s) depending on the intensity of the respective post processing procedure. Most frequently, extrusion through filters with pores of different diameters, high pressure extrusion of a suspension of multilamellar liposomes through a French pressure cell43, or sonication is applied to achieve a homogenous size of liposomes.
In these post-
processing techniques, the initial multilamellar vesicles are torn apart into small bilayered fragments or flakes, which upon fusion self-close into the desired small unilamellar vesicles.32 Small unilamellar liposomes with diameters of approximately 25 nm are usually obtained by either directly immersing a high-energy probe sonicator into the liposome solution or by suspending phospholipid dispersion in a glass vial in a lowenergy ultrasonic cleaning bath. High-energy sonication potentially causes oxidation and degradation of phospholipids and may damage the solute molecules it is desired to encapsulate in the liposomes interior space. Furthermore, titanium particles erode from the probe tip and have to be removed. Low-energy sonication as in the cleaning bath
11
varies often in its efficiency requiring prolonged periods of sonication, which at the end can also be destructive to the phospholipids molecules.38 In summary, traditional liposome preparation methods are generally conducted through mixing of bulk phases.
The bulk methods often produce inhomogeneous
chemical and/or mechanical conditions at the lipid phase–aqueous phase interface during liposome formation; resulting in liposomes that are polydisperse in size and lamellarity. To yield the desired homogeneous liposome populations traditional methods to formulate liposomes require additional steps such as solvent removal,33 membrane extrusion,38 or sonication42.
Methods that can control liposome size during formation obviating
additional steps would simplify their preparation. The challenge is to produce liposome formulations with a defined size for the specific application and with little size variation in their population, while guaranteeing batch-to-batch consistency. The methods for liposome production should also be flexible so that a protocol can be optimized for the desired concentration of encapsulated compounds and for functionalizing their surfaces. Lastly, shelf life of the formulation is of concern, and so the ability for production on demand would be of interest.
1.3
Nanoparticle Formation with Microfluidics
One of the great benefits of microfluidics is that it enables fine control and manipulation of fluids and fluid interfaces.
Small packets of fluids with volumes
measured in the picoliter- to attoliter-range can be manipulated, split, or combined with precise timing. Mixing can occur by simple diffusion or in a patterned channel that promotes folding of the fluid layers to reduce diffusion distances. Fluid streams flowing
12
toward one another can merge and form very sharp and well-defined interfaces by virtue of laminar flow.44 Application examples for microfluidic technologies which takes advantage of these features are synthesis, formation, and self-assembly of microscale and nanoscale particles.
Nanoscale particles that have been formed using microfluidics include
semiconductor quantum dots and lipid nanotubes49-51.
45
, metal colloids
46
, and more recently, liposomes
41,47,48
For both quantum dots and metal colloid formation,
microfluidic synthesis has been reported to be superior to benchtop methods for producing high quality, monodisperse particles due to the ability maintaining fine control of all solution variables including reactant concentration, timing of reagent addition, and temperature.52-55 Microfluidic methods for rapid mixing and exquisite control of reagent concentration can produce the precise conditions required for nanoparticle production. These methods include hydrodynamic focusing 56, flow lamination 57, and fluid folding 58 or chaotic mixing
59
.
Flow focusing has been applied to generate homogeneous
emulsion.60 Kuribayashi et al. showed electroformation of giant liposomes in microfluidic channels 61. Specifically, a polymethylvinylsiloxane sheet containing the microchannel is sandwiched between two indium tin oxide glass plates which serve as transparent electrodes. A thin lipid film is dried on the bottom of a microchannel, hydrated with deionized water by capillary filling, and subsequently exposed to an alternating current (AC) signal producing giant unilamellar vesicles. Electro-formation of liposomes in this manner resulted in giant unilamellar liposomes (liposomes composed of a single bilayer membrane) in contrast to giant multilamellar liposomes (liposomes composed of many
13
bilayer membranes) that are produced by gentle hydration of lipid films without the electric field. Liposomes prepared by electro-formation were overall larger with a mean liposome diameter of about 12 µm compared to those produced by gentle hydration without applying an AC field with a mean liposome diameter of about 5 µm. This is thought to be due to liposome fusion caused by the vibrational energy induced by the AC field. In another study Wagner et al. used the fluidic cross-flow ethanol injection method to produce homogenous liposome populations on an industrial scale.41 The cross-flow injection technique utilizes two welded stainless steel tubes that form a cross, as shown in Figure 5.
Figure 5 Welded steel tube arrangements of the Wagner41 cross-flow method. The injection pinhole is 100 µm to 250 µm in diameter at the welded intersection.
14
At the connecting point a hole with a diameter of 150 µm to 250 µm serves as an injection point for a lipid/ethanol mixture.
This method is an improvement to the
traditional ethanol injection method in which a lipid/ethanol mixture is slowly injected manually into a rapidly vortexing aqueous buffer. The cross-flow injection method provides better control and reproducibility compared to manual injection of the lipid. In this method, the ethanol/lipid stream is injected obliquely into the water stream. One part of the ethanol/lipid stream forms a non-miscible interface with the stainless steel tubing and the other forms an active liquid miscible interface with the buffer. Liposomes form at the miscible buffer/ethanol interface. The liposomes produced with the cross-flow injection method vary in diameter between 200 nm and 500 nm. Despite the development of a variety of new liposome formation methods there is still a limited understanding of the mechanism of lipid-to-liposomes self-assembly with conventional bulk methods. Vesicle formation is mostly determined by experimental parameters such as flow velocity, injection pressure, or stirring rate but precise control of the exact mixing parameters but their impact on formation remains untenable. This limited understanding is probably due to the often uncontrolled turbulent mixing conditions in batch processing38,39 or visual inaccessibility of mixing performance41. In the following chapter a new method is described to produce homogeneous unimodal liposome populations with average vesicle diameters that can be chosen between 45 nm to 150 nm. Microfluidic hydrodynamic focusing (MHF) takes advantage of laminar flow in microfluidics. The microfluidic approach to form liposomes allows controlling the vesicle diameter and offers high reproducibility of the vesicle size distribution.
15
Chapter 2: Concept of Microfluidic Liposome Formation 2.1
Liposome Formation with MHF
Hydrodynamic focusing has been applied in various fields such as micromixers56, flow cytometers62, and fluidic switches to name a few. The concept of hydrodynamic focusing is based on conventional flow cytometry with an axially symmetric sample and sheath flow. A sample stream is thinned or focused by an adjacent sheath-flow and passed through a detection region, where particles or cells are counted or separated.63 The focusing of the sample stream depends on the volumetric flow rate ratio between the sample and the surrounding sheath flow.
Although the concept of hydrodynamic
focusing and its rapid mixing on the micrometer length-scale is well established, hydrodynamic focusing to our knowledge has not been applied to control lipid selfassembly into liposomes in a microfluidic device until recently.47,48 The formation of vesicles with microfluidic hydrodynamic focusing (MHF) is adapted from the batch solvent injection method.38,39 The conventional standard solvent injection into a glass vial filled with aqueous solution or buffer does not allow for reproducible control of shear forces and mixing conditions and therefore generally results in polydisperse liposome populations.
Contrary, MHF enables the facile and
reproducible control of the fluidic mixing conditions under laminar flow, thereby producing predictable flow conditions, which can be studied by fluid momentum and mass transport simulations.
The focusing is visually accessible and allows the
comparison of experimental with simulated focusing profiles.
MHF produces a
controlled steady-state concentration distribution profile of the miscible alcohol/water system. The controlled environment of the MHF method allows further elucidating the 16
vesicle formation process and investigating it more thoroughly by extracting the mixing details of alcohol and aqueous buffer in this system with numerical simulations. These include the concentration profiles of alcohol/water mixtures as they change for different focusing conditions and velocities as well as the viscous anisotropy that is often inherent in these miscible solvent-buffer combinations.64-68 Liposome formation in MHF occurs by a diffusively driven process, when a stream of lipids dissolved in an organic solvent such as 2-propanol (IPA) is hydrodynamically sheathed between two oblique phosphate buffered saline (PBS) streams in a microfluidic channel. The main concept of hydrodynamic focusing is to reduce the streamwidth and consequently the mixing path length of the focused stream. A stream of lipids resolubilized in IPA is hydrodynamically focused into a very narrow sheet with a thickness varying from a few micrometers down to sub-micrometers depending on the respective PBS-to-IPA volumetric flow rate ratios (FRR). The laminar flow conditions facilitate controlled diffusive mixing at the two liquid interfaces reproducibly diluting the IPA concentration below the solubility limit of lipids and initiating lipid self-assembly into small unilamellar vesicles ranging in diameters from 40 nm to 150 nm. In Figure 6a simulation of the mixing of IPA as it is focused by two oblique aqueous buffer streams and vesicle formation at the alcohol/water interface is shown. A fluorescence microscope image is shown in Figure 6b that depicts the focusing of a lipid stream containing a fluorophore in a microfluidic device.
17
a)
b)
Figure 6 Schematic of the lipid self-assembly into liposomes with MHF (a). The color contours are generated by finite element analysis modeling of the flow field with Navier-Stokes convection and Stoke-Einstein diffusion equations and represent the concentration ratio of IPA to PBS.
Lipid vesicles are formed where the
concentration ratio of alcohol to buffer is at a critical condition and lipids are no longer soluble.47 (b) Fluorescence microscope image of the focused IPA stream on a microfluidic chip (double cross design). A non-polar fluorophore (DiIC18) is mixed into the IPA/lipid stream to visualize the focusing.
18
According to a theory by Lasic et al., lipids dissolved in an organic solvent transform into intermediate bilayer phospholipids fragment (BPF) structures. Reducing the solubility conditions of lipids by increasing inter-diffusion of water and alcohol leads to thermodynamic instabilities at the edges of BPFs which induces bending and closing of the BPF upon itself and formation of vesicles.32,47,48 Changes in FRR result in variable stream widths of the focused solvent/lipid stream.
As FRR decreases, the solvent stream width increases; therefore the
concentration gradient decreases providing a central region with higher solvent content. This potentially stabilizes BPFs and allows larger congregation of lipids to yield larger BPFs, which eventually results in larger vesicles and broader distribution. At higher FRRs the solvent stream is focused into a narrower stream, the results are smaller and more homogenous liposome populations. In contrast to batch solvent injection38,39, from which MHF is adapted, MHF enables the facile and reproducible control of the fluidic mixing conditions under laminar flow, thereby producing predictable flow conditions.
A controlled steady-state
concentration distribution profile of the miscible alcohol-water system is established and can be studied by fluid momentum and mass transport simulations. The controlled environment of the MHF method allows further elucidating the vesicle formation process and investigating it more thoroughly by extracting the mixing details of alcohol and water in this system with numerical simulations.
These include concentration profiles of
IPA/water mixtures as they change for different focusing conditions and velocities as well as the viscous anisotropy (discussed in Chapter 4) often inherent in these miscible solvent-buffer systems.64-68
19
2.2
Encapsulation with MHF
Encapsulation of compounds into liposomes can be accomplished by one of three primary mechanisms: encapsulation, partitioning, and reverse/remote loading.69 Encapsulation is useful for hydrophilic drugs, where the drug is dissolved in the hydration buffer. As the lipids self-assemble into liposomes in the hydration buffer they compartmentalize the drug in their aqueous interior. The partitioning strategy is suitable for lipophilic drugs, which are intercalated in the membrane interstitial of liposomes. The lipophilic drug is dissolved in a suitable organic solvent along with the phospholipids and subsequently added to the hydration buffer. solubilized in the intrabilayer space.
As liposomes form, the drug is
Residual solvent is removed under vacuum.
Reverse or remote loading can be used for weakly acidic or alkaline drugs. Drug loading is achieved with either a pH gradient or an ammonium salt gradient between the inside and the outside of the liposome membrane. The idea is that neutral drug molecules are shuttled into the aqueous interior of the liposome across the phospholipid bilayer and become subsequently charged inside the liposome due to the different pH. Once charged, the drug molecule is not lipophilic enough to permeate through the bilayer again and is trapped inside the liposome.69,70
The reverse loading method allows very high
accumulation of the drug inside liposomes that can be as high as 100-fold the compound concentration in the remote loading medium and can achieve up to 90 % encapsulation efficiency.71
Liposome loading of a hydrophilic drug simulant with MHF is
accomplished by means of passive encapsulation. Encapsulation with the multiple-inlet microfluidic channel device addresses a major drawback in encapsulating solutes with other bulk formation processes. In Figure 7 the encapsulation of a hydrophilic drug with the standard alcohol injection method is depicted. An alcohol/lipid tincture is injected 20
with a syringe into an aqueous hydration buffer solution containing a homogenous concentration of drug. As lipids self-assemble into liposome due to the polarity of the hydration buffer, they simultaneously sequester the surrounding medium into the liposomes interior. However, due to the maximum amount of solvent that can be mixed with the hydration buffer and still result in formation of stable liposomes, only a fraction of the drug is eventually encapsulated in the liposome’s interior. The non-encapsulated drug is subsequently separated from the liposome sample with gel filtration. To increase the encapsulation efficiency (the amount of drug encapsulated into liposomes versus the total amount of drug in the hydration buffer) it would be desirable to confine the drug only to the liposome formation region.
Figure 7 Schematic of drug encapsulation with standard alcohol injection and hypothetically increasing the encapsulation efficiency (E.E.) by confining the drug to the area where liposome formation occurs.
21
Confining a drug to the liposomes formation site as shown with the standard injection methods in Figure 7 is unfeasible.
However, the MHF approach allows
confining the drug to the immediate vicinity where lipids self-assemble into liposomes. This is shown in Figure 8 where the encapsulant carboxyfluorescein (CF) is confined to the liposome formation region, rather than throughout the entire aqueous fluid. This allows reducing the amount of non-encapsulated compound.
Figure 8 Micrograph of the multiple-inlet channel that allows confining the compound of interest to the immediate vicinity of liposome formation (left). 3Dconfocal micrograph at an angle that shows the sheathing of green CF (the compound to be encapsulated) in PBS to the IPA/lipid solution (DiIC18 fluorophore is added to visualize the focusing). Transparent PBS is sheathed next to the CF containing PBS and fills the majority of the center channel.
22
2.3
Microfluidic Channel Design and Device Fabrication
Liposome formation via hydrodynamic focusing was investigated with three different microfluidic devices, as shown in Figure 9. A T-channel served as a proof of concept for liposome formation in microchannels.
However, the T-channel design
produces solid-liquid interactions of lipids at the channel wall in addition to liquid-liquid interactions between the buffer and the lipid solvent stream. In order to limit the lipid interactions to the liquid phase, the T-channel design was replaced soon after by a second design, the double-cross channel design, as shown in Figure 9a. In the double-cross channel design the solvent stream is sandwiched between two buffer streams minimizing lipid interaction at the wall during lipid self-assembly. The channel layout in Figure 9b includes multiple inlets to allow separate injection of a solute of interest to be encapsulated into liposomes through the two inner side channels. Figure 9c shows a single cross microchannel layout that has narrower channels compared to the previous two designs and plays an integral part in the investigation of the effect of channel dimensions on liposome formation. The multiple-inlet design and single cross design have microchannel with a higher aspect-ratio (ratio of channel depth to channel width) and a rectangular cross sectional area compared to the shallower trapezoidal channels of the double-cross design. The goal is to homogenize the 3-dimensional parabolic flowprofile across the depth of the channel.
23
a)
b)
c)
Figure 9 Shown are three microchannel designs applied for liposomes formation with MHF. (a) The double-cross design has a trapezoidal channel cross-section. The channels are 200 µm wide channels (on the top) and 40 µm deep. (b) The multipleinlet design allows separate injection of an encapsulant. The channel cross-section area is rectangular. The channel width is 42 µm for the IPA/lipid, SRB, and three outlet channels and 65 µm for the PBS and mixing channel. All channels are either 100 µm or 120 µm deep. (c) A cross channel design with rectangular channel cross section. The channels are 10 µm wide and 36 µm deep.
24
Furthermore, in the multiple-inlet design, the fluid access holes at each channel terminus are confined within the microchannel; meaning the through-holes do not extend past the microchannel width (Figure 9b) in contrast to Figure 9a and Figure 9c where the access holes at the channel terminus are wider than the microchannel. Limiting the fluid access-holes to within the microchannel width reduces dead volume and vortices in the injection points. The three outlets in the double cross and multiple inlet designs serve the purpose of increasing the collected liposome concentration by removing excessive buffer through the two waste outlets. The double cross-channel design is fabricated with an anisotropic wet-etching technique. The anisotropy of the wet-etching technique depends on the orientation of the silicon crystal structure in the silicon wafer. Due to this constraint, the channels must be aligned orthogonally to each other and the etched structures will be of rectangular geometry with respect to the surface, while the cross-sectional area will be trapezoidal or triangular, depending on the depth of the channel. The multiple inlet and single-cross design is fabricated with deep reactive ion-etching (DRIE).72 The microchannel layouts were etched into a silicon wafer ( orientation, 75 mm diameter 0.3 mm thickness, Nova Electronics Material Inc., TX). The silicon wafer is then anodically bonded to a borofloat glass wafer (BSG) to seal the microchannels. Fluidic connectors are glued to the backside of the silicon wafer to facilitate the injection of fluid with syringes through PEEK capillary tubing. Figure 10 depicts the details of the fabrication process flow for the multiple-inlet channel designs. A silicon (Si) wafer is dipped into hydrofluoric (HF) acid to strip the native oxide layer, and subsequently dried on a hotplate for 5 min at 115 C.
25
Hexamethyldisiloxane (HMDS) is spin-coated at 2500 rpm for 50 s onto the frontside of a Si-wafer to improve the adhesion of a 3 µm thick layer of positive tone photo resist (Shipley SPR-220-3; Rohm and Haas, Marlborough, MA, USA), which is subsequently spin-coated at 2500 rpm for 45 s. A prebake on a hotplate at 115 C for 90 s solidifies the resist. The channel layout is transferred lithographically in hard-contact mode with a patterned chrom/glass mask and a mask aligner (MA6; Suss MicroTec, Waterbury, VT, USA) onto the photoresist. The photoresist is exposed to UV light (i-line) at 21 mW/cm2 for 30 s followed by a postexposure-bake on a hotplate at 115 C for 90 s. The photoresist is subsequently developed for approximately 1 min in a basic MF351 developer. A oxidized Si-wafer is spin-coated with SPR-220-3 and bonded to the first Si-wafer. Both wafers are hard-baked on a hotplate at 115 C for 30 min. The channels are etched 100 µm to 120 µm deep with DRIE.73 After the microchannels are etched into the front side of the Si-wafer, the wafers are separated. The microfluidic through-holes are etched into the backside of the Si-wafer in the same manner. After the through-holes are etched into the Si-wafer, the wafer is striped again of native oxide in buffered oxide etch (6:1 HF). Prior to bonding, the glass wafer (75 mm diameter, 0.1 mm thick, Corning Pyrex 7740) and the silicon wafer are thoroughly cleaned and dehydrated to ensure conformal contact between the wafers. Cleaning is accomplished by dipping the oxidized silicon wafers in RCA1 (NH4OH, H2O2, H2O; 1:1:5) at 80 C for 10 min to remove organic compounds, followed by a short dip into 2% HF and immersing for another 10 min into 80 C RCA2 (HCl, H2O2, H2O; 1:1:5) to remove remaining metal and alkali impurities. The wafers are then anodically bonded at 400 ºC for 60 min with a ramp rate of
26
25 ºC min-1 at a bonding voltage of 800 V. The glass is connected to the negative electrode while the silicon is connected to the positive electrode of the power supply, thus the sodium ions drift towards the negative electrode creating a very large electric field at the silicon/glass interface, which pulls the two surfaces together facilitating the bonding of the two surfaces. Fluidic nanoports (F-124S, Upchurch Scientific, USA) connect external capillary tubing to the microchannel network. These ports minimize fluid dead volume between the external capillary tubing and the microfluidic device. The nanoports are bonded to the backside of the silicon wafer using vendor supplied adhesive rings according to their instructions. Capillary tubes deliver the fluid from glass syringes to the microchannel network.
27
Figure 10 Schematic of the fabrication process for the multiple-inlet design.
28
2.3
Characterization of Liposome Size, Size Distribution, and Encapsulation
Light scattering is commonly used to determine the size and size distribution of colloidal systems. As light interacts with matter the electrical field of the electromagnetic wave separates charges in the particle. The amount of charge separation depends on the polarizability of the particle itself. If the wavelength of the light is much longer than the physical dimensions of the particle the separated charges produce a dipole field. The oscillating electric field of the light creates an oscillating dipole in the particle, which then reradiates the light predominantly in the plane perpendicular to the incident polarized light. Depending on the size of the particle the perpendicular scattering is characterized by an angular scattering dependence.74 When the particles are below a critical physical dimension compared to the wavelength of the oscillating field, its scattering is nearly independent of the angle perpendicular to the incident light. At a wavelength of about 690 nm of the incident light, as in the light scattering instrument utilized, isotropic scattering occurs at particle sizes of less than 10 nm radius and anisotropic scattering occurs with larger radii; this allows size characterization of small unilamellar vesicles (SUVs) with diameters of about 20 nm to 25 nm. Larger particles scatter more light and show a larger angular dependence of scattered light than smaller particles.
Analysis of the particle scattering pattern and intensity allows for
determination of particle size. To obtain an accurate characterization of the liposome size distribution it is necessary to fractionate liposomes.
Asymmetric flow field-flow
fractionation (AF4), a type of liquid chromatography that does not use a stationary phase, separates particles by a cross-flow field in an otherwise laminar flow. It allows the separation of particles with sizes ranging from 1 nm to several 1000 nm encompassing the separation of micelles, liposomes, emulsions, viruses, bacteria, cells, proteins, glyco29
proteins, and protein-complexes.75
The combination of AF4, multi-angle laser light
scattering (MALLS), and quasi elastic light scattering (QELS) allows for determination of liposome size distributions with very high resolution. Other commonly used techniques to measure liposome size and size distribution include transmission electron microscopy (TEM) and atomic force microscopy (AFM). TEM measurements of liposomes often require complicated sample preparation and can induce artifacts such as shrinkage and shape distortion as liposomes are removed from their native environment. The structural information about the morphology is very good and allows very precise particle characterization. Nevertheless, TEM measurements are very time consuming if one wants to obtain statistically meaningful and representative size distributions of a vesicle population and hence TEM is not amenable to being a routine measurement.76 On the other hand AFM, which was developed in 1986, allows for easy and fast sample preparation while still allowing the vesicles to remain preserved in their native aqueous environment. The ability of the AFM to operate in a non-contact mode prevents deformation of soft-matter particles such as liposomes. Nevertheless, even if using AFM in non-contact mode and operating in aqueous solution the measurement requires that the liposomes are deposited on substrate such as silicon or mica. Ruozi et al. reported recently that already 10 minutes after deposition liposomes showed a progressive tendency to turn into asymmetrical and flattened structures often describes as planar vesicles.77 This tendency to change their structure varies with the composition of the liposomes. While both AFM and TEM provide excellent information about the morphology in respect to lamellarity and nanometer-scale resolution on vesicles, they require meticulous sample preparation to minimize artifacts of the vesicle
30
size and shape.
The continuous improvement of AFM and TEM measurement
procedures in the field of soft-matter particles will eventually provide a very important tool to better characterize liposomes for drug delivery applications. Information about the bilayer structure can also be obtained with small angle neutron scattering (SANS), small angle X-ray scattering (SAXS) or nuclear magnetic resonance (NMR) spectroscopy.76
SAXS and SANS both belong to scattering
technologies just as light scattering but while light and X-rays are both scattered by electrons surrounding the atomic nuclei, neutron are scattered by the nucleus itself. The lower energy of the neutrons in SANS measurements compared to that of X-ray photons in SAXS makes the former more suitable for the study of sensitive biological samples such as lipid vesicles.78 In the case of SAXS Bouwstra et al.79 reported that the scattering curve changes dramatically when a small fraction of multilamellar vesicles is present in a sample of mostly unilamellar vesicles.
This could potentially lead to erroneous
interpretations about the overall lamellarity of the vesicle population. In the
31
P NMR
technique Mn2+, which interacts with the negatively charged phosphate groups of phospholipids, is added to a liposome sample to quench the
31
P NMR signal from
phospholipids on the exterior of the outermost phospholipids bilayer. The lamellarity can be subsequently determined from the signal ratio before and after Mn2+ addition to the liposome sample. However, this technique is quite sensitive to Mn2+ concentrations and buffer concentrations and the type of lipids used. While SAXS, SANS, and NMR are certainly important and mature techniques to analyze the lamellar structure of vesicles, the sample preparation and costs that are often associated with these techniques but also the required vesicle concentrations that are much higher than obtained with the
31
microfluidic focusing method make QELS and MALLS the preferred method to characterize the size distribution of submicrometer-scale liposomes.
Additionally,
cryogenic-TEM (cryo-TEM) is applied to investigate the lamellarity of liposomes prepared with the microfluidic hydrodynamic focusing method. Here, a liposome sample is rapidly frozen in liquid ethane cooled to -180 ºC by liquid nitrogen. The rapid freezing prevents ice-crystal formation which would otherwise result in the destruction of the liposomes. The common goal of drug delivery systems (DDSs) is to achieve a very high encapsulation efficiency and reduce the amount of solute waste that has to be preprocessed for subsequent use.
The number of molecules encapsulated within
liposomes is analyzed with fluorescence cumulant analysis (FCA).80
FCA is a
modification of fluorescence correlation spectroscopy (FCS). The latter is a widely used and powerful tool that measures temporal fluctuations of the fluorescence. The major drawback of FCS is its insensitivity to discriminate between similar sized particles. FCA resolves heterogeneous samples based on differences in fluorescent intensity instead of temporal fluctuations as in FCS. FCA exploits information from higher moment analysis of the probability distribution of photon counts.81 It therefore distinguishes molecular species by difference in their fluorescent intensity and not their diffusion coefficients. Combining the results from FCA with the liposome size distribution obtained from light scattering provides information about the average fluorescence or number of entrapped molecules in a liposome.
32
Chapter 3: Microfluidic Directed Liposome Formation of Controlled Size 3.1
Introduction
A new method to tailor liposome size distributions in a microfluidic format is presented. A method is described to engineer liposomes of a particular size distribution by changing the flow conditions in a microfluidic channel, obviating the need for postprocessing. A stream of lipids dissolved in IPA is hydrodynamically focused between two sheathed aqueous streams in a microfluidic channel.
The laminar flow in the
microchannel enables controlled diffusive mixing at the two liquid interfaces where the lipids self-assemble into vesicles. The liposomes formed by this self-assembly process are characterized using asymmetric flow field-flow fractionation (AF4) combined with quasi-elastic light scattering (QELS) and multi-angle laser light scattering (MALLS). It is observed that the vesicle size and size distribution are tunable over an average diameter from approximately 50 nm to 150 nm by adjusting the ratio of the buffer-to-alcohol volumetric flow rate ratio (FRR). Furthermore, it is observed that liposome formation depends more strongly on the focused alcohol stream width and its diffusive mixing with the aqueous stream than on the shear forces at the solvent-buffer interface.
3.2
Description of Experimental Procedures
3.2.1
Device Fabrication Microfluidic channels are fabricated in a silicon wafer (76.2 mm (3 in.) diameter,
305 µm to 355 µm thick, Nova Electronics Materials, Inc., Carrollton, TX) with deep reactive ion etching (DRIE) using the Bosch process and sealed by anodic bonding to a borosilicate glass (BSG) wafer (75 mm diameter, 0.1 mm thick, Corning Pyrex 7740), as
33
described in the previous chapter.
The microchannels in the multiple-inlet design
(Figure 9b) have a rectangular cross section with a depth of 100 µm and a width of either 42 µm (center inlet channel) or 65 µm (side channel and mixing channel). A schematic of the assembled wafers and fluid-ports is depicted in Figure 11. PEEK capillary tubes (Upchurch Scientific, Oak Harbor, WA) with an inner diameter of 254 µm (0.01 in.) connect the Nanoports to a syringe. A 0.02 µm filter (Anatop, Whatman, NJ) is placed on the syringes to ensure that all fluids introduced to the microchannel network are dustfree to prevent clogging of the channels.
Fluidic reagents are introduced to the
microfluidic network from glass gastight syringes (Hamilton, Reno, NV) by syringe pumps (model PHD2000, Harvard Apparatus Inc., Holliston, MA).
Figure 11 Schematic of the microfluidic device. Exploded view showing the fluid ports attached to the backside of the silicon wafer, the channel network etched into silicon with five inlet channels (a-e) on the left and three outlet channels (g-i) on the right, and the sealing with a glass wafer via anodic bonding.
34
3.2.2
Materials Saturated 1,2-Dimyristoyl-sn-Glycero-3-Phosphocholine (DMPC), cholesterol
(both Avanti Polar Lipids Inc., Alabaster, AL), and dihexadecyl phosphate (DCP) (Sigma-Aldrich) in a molar ratio of 5:4:1 are dissolved in dry chloroform (Mallinckrodt Baker Inc., Phillipsburg, NJ). The chloroform solvent is evaporated under a stream of nitrogen at room temperature to form a dry lipid film on the bottom of a scintillation vial. The scintillation vial is subsequently placed into a vacuum desiccator for at least 24 h to ensure complete solvent removal. The dried lipid mixture is resolubilized in dry IPA at a 5 mmol/L concentration of total lipid.
Phosphate buffered saline (PBS) solution
(10 mmol/L phosphate, 2.7 mmol/L potassium chloride, 138 mmol/L sodium chloride, pH 7.4, 3 mmol/L sodium azide) is used as a hydration buffer.
3.2.3
Liposome Formation Unilamellar liposomes are prepared by injecting a lipid mixture dissolved in IPA
into the center channel of the microfluidic network shown in Figure 11. PBS is injected into the oblique side channels intersecting with the center channel. The flow rate ratio (FRR), defined as buffer volumetric flow rate (QB) to IPA volumetric flow rate (QS), is varied from 10 to 60. Liposome formation at different shear forces is investigated by changing the total volumetric flow rate (Qt) from 31 µL/min to 186 µL/min maintaining a constant FRR of 30.
35
3.2.4
Microscopic Imaging The hydrodynamically focused flow in the microfluidic channel is imaged with a
confocal laser-scanning microscope (LSM 510 Meta, Carl Zeiss, Thornwood, NY) with a 30 mW HeNe laser (excitation, 543 nm; power output, 18 %; objective LD-Achroplan, 20x/0.4; detector gain, 468; amplifier gain, 1.00 V; amplifier offset, 0.1 V; filter, LP 560; beamsplitter, MBS HFT 488/543; 12-bit image resolution; 1.6 µs pixel time; 94 µm pinhole). Vendor supplied image processing software is used (Carl Zeiss, Thornwood, NY). The alcohol concentration is determined by measuring the fluorescent intensity of sulforhodamine B (SRB) as a function of IPA concentration.
3.2.5
Cryogenic Transmission Electron Microscopy Cryogenic
transmission
electron
microscopy
(cryo-TEM)
involves
the
examination of a vitrified hydrated sample directly on a cryo stage in the TEM. Five microliter drops of liposome suspensions were placed on 1000-mesh copper electron microscope (EM) grid. Specimens were frozen by clamping each grid into spring-loaded forceps of a Leica KF80 freezing machine. The grid was blotted with filter paper to leave a thin film of liposome suspension just prior to plunging the grid into liquid ethane cooled to -180 ºC by liquid nitrogen. The frozen grid was then loaded under liquid nitrogen into a Gatan model 626 specimen holder and cryotransferred into an FEI CM120 transmission electron microscope (Philips) equipped with Gatan anticontaminator blades. Suitably thin specimen regions were imaged at a beam voltage of 120 kV and at an electron dose of less than 1000 electrons per square nanometer using a Gatan GIF100 post-column imaging filter equipped with a 1024x1024 pixel cooled CCD camera.
36
Contrast was enhanced by energy-filtering the transmitted electrons and by underfocusing the objective lens to about 500 nm.
3.2.6
Light Scattering and AF4 Procedure High-resolution size-based separation of the liposome population is carried out
using asymmetric flow field-flow fractionation (AF4) with multi-angle laser light scattering (MALLS) and quasi-elastic light scattering (QELS) detection and characterization (model DAWN EOS and QELS, Wyatt Technology, Santa Barbara, CA). A vendor-supplied spacer (250 µm thickness) is used to define the flow channel thickness with a 10 kg/mol MWCO (molecular weight cut-off) regenerated cellulose membrane (Millipore, Bedford, MA) for the cross-flow partition. PBS is used as the carrier liquid in the particle size separation.
The flow is controlled with vendor-supplied software
(Eclipse 2, Wyatt Technology, Santa Barbara, CA). A sample volume of 100 µL is injected with an auto-sampler at a flow rate of 0.2 µL/min and focused into a thin band in the separation flow-channel at a flowrate of 3 mL/min for 4 min. The injection step is followed by a second focusing step at 3 mL/min for 3 min. The cross-flow is ramped linearly from 3 mL/min to 0 mL/min over 60 min while eluting the separated particles at 0.8 mL/min. The radii of the eluted vesicle fractions are monitored using MALLS and QELS detection with data processing, using software supplied by the vendor (ASTRA, Wyatt Technology, Santa Barbara, CA). simultaneously.
MALLS is measured at 15 angles
The liposome sample is measured at 1 s and 5 s intervals for the
MALLS and QELS, respectively. The autocorrelation function (ACF) of the QELS is fitted to a single-mode exponential decay model to determine the hydrodynamic radius
37
(Rh). A coated sphere model (i.e., a spherical structure with two radial regions of differing refractive index) showing good fit with the MALLS data is applied for size analysis of the geometric radius (Rg) of the fractionated samples.
3.3
Results and Discussion
Hydrodynamic focusing in a microfluidic device allows for fast and controlled mixing of miscible liquids with the benefit of reduced sample consumption. In the microfluidic device presented in Figure 11, four aqueous buffer streams (channels a, b, d, and e) hydrodynamically focus a lipid tincture entering through the center channel (channel c) at the cross junction. Hydrodynamic focusing reduces the center channel stream width and consequently the diffusion length for liquids to mix. The sample stream injected into channel c is focused into a thin sheet. Simple mass flow balance within the microchannel can provide a theoretical model to estimate the absolute minimum continuum width of the focused sample stream QS = v f ⋅ w fs ⋅ h = vc ⋅ Dc ⋅ h
(3.1)
assuming a parabolic flow profile in the rectangular channel with
vf =
3 ⋅ vc 2
(3.2)
so that w fs =
2⋅ Df ⎛ Q 3 ⋅ ⎜⎜1 + B ⎝ QS
⎞ ⎟⎟ ⎠
,
(3.3)
where wfs is the stream width of the focused sample stream in the center of channel f, QS and QB are lipid mixture and buffer volumetric flow rate, vc and is the average flow
38
velocities of channel c and vf the maximum flow velocity in the center of channel f, Dc and Df are the widths of channels c and f, respectively, and h is the channel depth, which is constant for the entire microchannel network. The estimated focused stream width, wfs, in eq. 3.3 idealizes the otherwise complicated system by assumimg that (1) all liquids entering the channels have the same density, (2) all liquids have a parabolic flow-profile across the width of the channel, and (3) diffusive mixing is negligible. It can be seen from eq. 3.3 that wfs than only depends on the microchannel geometry and the buffer-tosolvent flow rate ratio (FRR). Because eq.3.3 does not consider molecular diffusion of IPA into PBS it really only provides an estimate of the focused sample streamwidth within the first 100 µm of the entrance of channel f of the hydrodynamically focused stream at low FRRs. The high flow velocities result in sub-millisecond residence time over a distance of 100 µm where diffusive spreading of the focused stream is minimal due to the short convective residence time. Although diffusion is neglected in eq. 3.3, it gives a rough estimate of the width of the focused stream in the entrance region of channel f. The estimated stream width roughly agrees with the measured stream width from Figure 12 for FRRs of 5 and 10. At higher FRRs IPA diffusion becomes substantial compared to the estimated stream width and diffusion must be considered for accurate streamwidth estimates. Figure 12 shows a confocal microscope image sequence of the IPA concentration across and along the center channel as a function of varying FRRs increasing from 5 (left) to 35 (right) in increments of 5.
39
Figure 12 False color confocal microscope images showing hydrodynamic focusing of an IPA stream by two adjacent aqueous buffer streams (not visible). The focused IPA stream, containing sulforhodamine B for visualizing purposes, enters from the top. Shown are 7 different FRRs, increasing from 5 to 35 in increments of 5 from left to right at a constant Qt of 100 µL/min.
As the FRR increases, the alcohol stream width decreases. A smaller alcohol stream width results in a shorter diffusion length, and therefore the IPA concentration decreases more rapidly. The hydrodynamic focusing process due to extensional flow is completed once the focused stream enters the mixing channel (channel f). While mixing in the focusing region is due to both convection and diffusion, in the mixing channel it is dominated by molecular diffusion. Laminar flow conditions in the channel allow for mixing that is based entirely on molecular diffusion in a direction normal to liquid flow streamlines.
At a critical
alcohol-to-water ratio the lipid monomers in the alcohol stream become insoluble and spontaneously self-assemble into closed spherical structures concomitantly sequestering
40
the surrounding fluid. A smaller wfs results in reduced diffusion lengths for mixing between the alcohol center stream and aqueous side stream, thereby reducing the distance downstream of the focusing region to reach the critical alcohol concentration where lipids spontaneously self-assemble into spherical vesicles. The effects of Qt and FRR between sheath and sample flow on liposome formation are investigated using MALLS and QELS combined with AF4.
3.3.1 Influence of Qt and Shear Forces on Liposomes Formation Figure 13 shows the liposome size distributions for six different Qts ranging from 30 µL/min (Re ≈ 6) to 180 µL/min (Re ≈ 6) at a constant FRR of 30. At a constant FRR, the width of the focused lipid/alcohol stream remains constant because the liquid is incompressible, and therefore the stream width, does not depend on the magnitude of the inlet and side channel volumetric flow rates but on the FRR. By maintaining a constant FRR and increasing the flow rates, the streamwidth and dilution rate remain constant; however, the shear forces at the interface of the two fluids increase. As Qt increases 6fold from 30 µL/min to 180 µL/min, the eluted liposomes are of approximately the same size and size distribution with a number weighted average geometric radius (Rg) of 29 nm and a distribution width of ±4 nm (≈3σ), as shown in Figure 13. This indicates that the absolute magnitude of the shear forces between the parallel layered streams has no significant impact on liposome size or size distribution. The increased noise in the data at a geometric radius less than 27 nm is due to lower concentrations and smaller sizes of particles, yielding a lower scattering intensity of the molecular solution.
41
Qt=186µL/min; FRR=30
Number density (normalized)
1.0
Qt=155µL/min; FRR=30 Qt=124µL/min; FRR=30 Qt=93µL/min; FRR=30
0.8
Qt=62µL/min; FRR=30 Qt=31µL/min; FRR=30
0.6
0.4
0.2
0.0 20
25
30
35
40
45
50
Geometric Radius, Rg, [nm]
Figure 13 Liposome size and size distribution at a constant FRR of 30 and different Qts. Increasing Qt 6-fold does not change the size distribution significantly. This indicates that the magnitude of shear stresses during liposome self-assembly has no or only little influence on the liposome size distribution.
3.3.2 Influence of FRR on Liposomes Formation Figure 14 and Figure 15 show liposome size distribution at different FRRs. As the FRR decreases the mean liposome size increases and the size distribution broadens. One possible mechanism to explain this phenomenon is as follows: assuming that the lipids are homogeneously distributed in the alcohol stream, when the alcohol stream first comes into contact with the aqueous streams, the lipids at that interface will quickly reach the critical alcohol concentration and self-assemble into liposomes.
The resulting
liposomes have a markedly decreased diffusion coefficient and will convect along the stream lines of the fluid flow. It is then possible that as the alcohol continues to diffuse, the alcohol concentration will increase in a direction normal to the streamlines. If enough 42
alcohol is in the common alcohol-aqueous stream (i.e., the alcohol portion of the stream is wide enough), it will cause the local alcohol concentration around the liposomes, that were formed at the initial interface, to increase above the critical concentration for liposome formation and the liposomes to partially disassemble. As the two streams continue to mix, the alcohol concentration near the initially formed liposomes will again decrease below the critical concentration, causing the liposome to reassemble. As the FRR decreases, the amount of alcohol introduced into the system and the alcohol stream width increase, causing the alcohol concentration to remain above the critical alcohol concentration for a longer length of the channel, and the magnitude of this phenomenon will increase. In contrast, as the FRR increases, the amount of alcohol in the system decreases, and fewer liposomes will experience alcohol concentrations high enough to induce this disassembly-reassembly phenomenon.
Further increases in FRR lead to
smaller changes in the stream width and the size and size distribution asymptotically approach limits, which depend on the maximum focusing of the center stream by the four buffer streams.
43
Number density (normalized)
Qt=122µL/min; FRR=60 Qt=102µL/min; FRR=50
1.0
Qt=82µL/min; FRR=40 Qt=62µL/min; FRR=30
0.8
Qt=42µL/min: FRR=20 Qt=32µL/min; FRR=15 Qt=22µL/min; FRR=10
0.6
0.4
0.2
0.0 20
30
40
50
60
70
80
90
Geometric radius, Rg, [nm]
Figure 14 Liposome size distribution for different FRRs. Increasing FRR 6-fold reduces the liposome radius from approximately 55 nm to 25 nm and the size distribution from ±25 nm to ±5 nm (≈3σ).
The QELS measurements of the hydrodynamic radii of the liposomes produced at different FRRs as a function of time as the liposomes elute from the AF4 channel is presented in Figure 15. QELS allows determining the diffusion coefficient of particles through the autocorrelation of its time-dependent fluctuations of scattered light. Typically, this is transformed into Rh through the Stoke-Einstein relation, where Rh represents the radius of a solid sphere that has the same diffusion coefficient as the measured particles. Measurement of Rh with QELS and Rg with MALLS allows for additional compositional characterization of the liposomes with respect to lamellarity.
44
From the data observed for Rh and Rg, it can be concluded that the liposomes are predominantly unilamellar.
Qt=122µL/min; FRR=60 Qt=102µL/min; FRR=50 Qt=82µL/min; FRR=40
80
Qt=62µL/min; FRR=30
70
Qt=42µL/min: FRR=20
60
Qt=32µL/min; FRR=15 Qt=22µL/min; FRR=10
50 40 30 20
1.0
10
Rayleigh-Ratio Normalized
Hydrodynamic Radius, Rh, [nm]
90
0 20
30
40
50
60
70
Time [min]
Figure 15 QELS measurements of the hydrodynamic radius Rh of liposomes at different FRRs as a function of time. A low FRR results in a rather broad liposome distribution with Rh varying between 30 nm and 70 nm. As the FRR increases (30 and higher) the average Rh decreases and the liposome size distribution becomes narrower with Rh varying between 22 nm and 27 nm.
The excess Rayleigh
scattering ratio of the liposomes which depends on the number of liposomes and liposome size is shown on the right axis. The Rayleigh-ratio or excess Rayleigh scattering is the excess of scattered light intensity of the liposome suspension above that scattered by the solvent itself.
45
Figure 16 shows a cryo-TEM image of approximately 100 nm diameter liposomes. Cryo-TEM allows studying the shape, size, and morphology of the vesicles. As can be seen in Figure 16 the larger vesicles prepared with microfluidic hydrodynamic focusing appear to be unilamellar which is in agreement with the light scattering data. However, it can also be seen in Figure 16 that the vesicles are not perfectly spherical, which is most likely due to the liposome sample preparation for the cryo-TEM measurements.
Figure 16 Cryo-TEM of unilamellar liposomes at 120 kV beam voltage and less than 1000 electrons per square nanometer electron dose.
The image shows
unilamellar liposomes produced by the microfluidic hydrodynamic focusing method.
46
3.4
Summary
The creation of liposomes using microfluidic techniques has been demonstrated to produce narrow liposome size distributions. The average liposome diameter can be controlled by adjusting the fluid flow rates of alcohol and buffer in the microfluidic network. Microfluidics allows for precise control of mixing over micrometer lengthscales.
Decreasing the sample streamwidth to micrometer length-scales allows for
controlled and reproducible physicochemical conditions across the streamwidth, especially compared to more traditional bulk-phase preparation techniques (i.e., test tubes and beakers). The laminar flow and precise fluidic control in a microchannel enables reproducible flow-fields for the self-assembly of lipids into liposomes in the sheathed flow-field.
The lipid self-assembly strategy described here, could potentially open
applications for on-demand liposome mediated delivery of point-of-care personalized therapeutics; thus, liposome-mediated drug delivery could eliminate procedure dependent liposome shelf-life limitations.
47
Chapter 4: Geometric and Hydrodynamic Aspects of Liposome Formation The previous chapter showed that liposome size distributions can be controlled by varying the FRR between the solvent and aqueous buffer phase.
Discussions at
conferences often raised the question if geometric parameters of the microchannel could possibly influence the liposome size distribution. This chapter will show that similar liposome size distribution can be obtained from different microchannel geometries. Especially, the investigation of the microchannel geometry provided more detail and helped to further elucidate the liposome formation process. This chapter also describes that reducing the microchannel geometry provides a means to increase the liposome concentration without affecting the final size distribution. This is especially interesting in regards to increasing the encapsulation efficiency of compounds within liposomes.
48
4.1 Introduction
A more thorough investigation of microfluidic hydrodynamic focusing (MHF) shows that the vesicle size distribution is not only a function of the FRR as previously reported47,48 but a rather complex function of multiple parameters. While the FRR suffices to describe vesicle formation in one channel size and at a single flow rate, it is not predicable between different mixing channel designs and flow rates. This chapter shows that the vesicle formation process depends strongly on the geometric parameters of the microchannel design (i.e. channel width and cross sectional area) and hydrodynamic parameters (i.e. FRR and flow velocity). The numerical simulation section summarizes the results for vesicle formation based on the concept of two mixing regions; convectivediffusive mixing in the focusing or transition region and diffusive mixing in the outlet or mixing channel. It will be shown that microchannels with a smaller cross sectional area produce comparable average vesicle diameters at lower FRRs than wider microchannels. The findings indicate that neither the focused streamwidth nor the final alcohol concentration solely determine the vesicle formation process. In certain flow regimes the flow velocity provides an additional parameter to modulate the vesicle diameter distribution. Numerical simulations of the experimental parameters that influence the mixing of alcohol with water show that liposome formation with MHF, though relatively simple experimentally implemented, is a complex system of mass and momentum transfer as well as self-assembly. Additionally, batch-to-batch consistency is evaluated, which turns out to be another hallmark of the MHF method and strengthens its future applicability in drug delivery and point-of-care applications
49
4.1
Description of Experimental Procedures
4.1.1 Device Fabrication Two different channel intersection layouts with varying microchannel widths are prepared. The first design consists of a double-cross intersection in which two oblique side channels intersect with the corresponding end of the central channel at an angle of 45 º. The slanted inlet configuration is fabricated as described in the previous chapter. The microchannels have rectangular cross-sections as a result of the chosen dry etching technique (DRIE) with a depth of 120 µm, a center inlet width of 42 µm, and mixing channel width of 65 µm. The side channel width is either 65 µm (Figure 17a) or 42 µm (Figure 17b). The second design consists of two orthogonally intersecting microchannels with a rectangular cross section with a depth of 36 µm and a width of 10 µm (Figure 17c). The latter design is fabricated in a similar manner as previously described with the microchannels on one side of the silicon wafer and the fluid access ports on the opposite side. Fluidic reagents are introduced into the central microchannel using a gastight glass syringe (Hamilton, Reno, NV) and into the oblique side microchannels with standard syringes (BD, Franklin Lakes, NJ) by syringe pumps (model PHD2000, Harvard Apparatus Inc., Holliston, MA). All fluids are filtered with 0.2 µm pore sized filters (Anatop, Whatman, NJ) to prevent particulate contamination and clogging of the microfluidic device.
50
a)
b)
c)
Figure 17 Microscope images of the different channel layouts. (a,b) All microchannels are 120 µm deep, the left center inlet channel is 42 µm wide, the right mixing channel is 10 mm long and 65 µm wide, and the oblique side channels are (a) 65 µm and (b) 42 µm wide. (c) All channels are 10µm wide and 36 µm deep.
51
4.1.2 Materials The lipid-blend (DMPC:Cholesterol:DCP in a molar ratio of 5:4:1) is prepared identical as described in the previous chapter. The dried lipid blend is resolubilized in IPA at a 5 mmol/L concentration of total lipid. PBS solution as previously described is used as a hydration buffer.
4.1.3 Liposome Formation Unilamellar liposomes are prepared by injecting a lipid-blend dissolved in IPA at a concentration of 5 mmol/L into the center channel of the microfluidic network shown in Figure 17a-c. PBS is injected into the two oblique side channels intersecting with the center channel. The buffer-to-solvent flow rate ratio (FRR) is varied from 12 to 48 and from 6 to 36 in the 65 µm wide and 10 µm wide microchannels, respectively. The average flow velocity in the mixing channel of the 65 µm and the 10µm device is held constant at 0.25m/s, when comparing the FRR. Additionally, liposome formation at three different Qts (25 µL/min, 50 µL/min, and 100 µL/min) is investigated for different FRRs of 14, 19, 29, and 49 in the 65 µm wide microchannel design.
4.1.4 Light Scattering and AF4 Procedure High-resolution size-based separation of each liposome population is carried out using AF4 with MALLS and characterization (model DAWN EOS, Wyatt Technology, Santa Barbara, CA) as described in the previous chapter. The injected sample volume is 120 µL.
52
4.2
Results and Discussion
It is important to point out that the scaling of the devices is not ideal. The aspect ratio between channel depth and nozzle width is approximately 3 for the 65 µm wide outlet channel (Figure 17a and b) and 3.6 in the 10 µm wide channel design (Figure 17c). The side channels in the 10 µm channel layout are perpendicular to the center channel, whereas in the in the 65 µm device they are at an angle of 45º. The maximum average Reynolds number (Re) is approximately 3 in the 10 µm channel and approximately 20 in the 65 µm channel. Nevertheless, the following results will show that the different channel layouts can be compared with each other. The liposome size distribution for 65 µm (Figure 17a) and 42 µm (Figure 17b) wide side channels is nearly identical, as is shown in Figure 18. Similar FRRs between the two designs mean that the flow velocity in the 42 µm side channels is higher than in the 65 µm, while the average flow velocities in the mixing and lipid injection channel are about equal. As can be seen from Figure 18 a minor deviation between the liposome size distributions is apparent at a low FRR of 12. Due to the increasing sensitivity of the liposome size distribution towards low FRRs the small deviation may not be attributed to a different side channel width but may be an artifact of a slight variation at the low FRR. The very similar size distributions shown in Figure 18 suggest that the width of the side channel and the minor change in the area of the transition region where the lipid/IPA stream is focused do not strongly impact the liposome size distribution. At similar FRRs, both designs produce comparable liposome size distributions. With a Re of less than 40 at a maximum Qt of 200 µL/min in the mixing channel inertial effects are small.
Hence, mixing of the focused stream with the surrounding fluid should be
independent of the angle between the side channels and the outlet channel.82 From these 53
results a comparison between the 65 µm (with 65 µm wide side channels) and 10 µm
Vesicle number fraction [1/nm]
device is justified.
0.35
65µm side channel FRR=48 FRR=24 FRR=12 42µm side channel FRR=48 FRR=24 FRR=12
0.30 0.25 0.20 0.15 0.10 0.05 0.00 20
40
60
80
100
Geometric radius, Rg, [nm]
Figure 18 Comparison between 65 µm and 42 µm wide side channels at identical FRRs and a constant vm of 0.25 m/s. The inlet channel width (42 µm) and mixing channel width (65 µm) is identical for both designs.
54
4.2.2 Influence of Microchannel Geometry on Liposome Formation A lipid blend resolubilized in IPA is injected through the center inlet channel and hydrodynamically focused into a narrow stream by two oblique buffer streams. The total average flow velocity (vm) is held constant and is limited to 0.25 m/s for both channel geometries to ensure complete mixing of the focused IPA by the sheathing PBS streams before exiting the mixing channel. Figure 19a and Figure 19b show the distribution of Rg for liposomes produced with the 10 µm and 65 µm wide mixing channels, respectively. Decreasing FRR from 36 to 6 in the 10 µm wide channel design produces peak vesicle number fractions with Rgs ranging from approximately 25 nm to 74 nm, while decreasing the FRR from 48 to 12 in the 65 µm wide channel design produces peak vesicles number fractions with Rgs ranging from about 28 nm to 70 nm. The 10 µm channel geometry produces comparable liposome size distributions at about half the FRR of the 65 µm channel and hence about double the final alcohol concentrations in the liposome suspension. Furthermore, it can be seen from Figure 19a and Figure 19b that the distribution shape changes from a skewed distribution to a more symmetric distribution as the FRR increases.
55
0.30
Vesicle number fraction [1/nm]
a)
vm=0.25m/s 10µm channel width FRR=36 FRR=24 FRR=12 FRR=9 FRR=6
0.25 0.20 0.15 0.10 0.05 0.00 20
40
60
80
100
b)
Vesicle number fraction [1/nm]
Geometric radius, Rg, [nm]
0.35
vm=0.25m/s 65µm channel width FRR=48 FRR=36 FRR=24 FRR=17 FRR=12
0.30 0.25 0.20 0.15 0.10 0.05 0.00 20
40
60
80
100
Geometric radius, Rg, [nm]
Figure 19 Distribution of the average geometric radius (Rg) of liposomes produced at different buffer-to-solvent flow rate ratios, FRR, and constant total flow velocity vm=0.25 m/s. Liposome size distribution produced in a 10 µm wide and 36 µm deep channel (a) and in a 65 µm wide and 120 µm deep channel (b).
56
The results indicate that liposome formation is not solely dependent on focused stream width or on the final solvent concentration in the sample, in contrast to previous results where the injection of a larger amount of lipid-alcohol into pure buffer solution gives a larger polydispersity39. Neglecting a slightly flattened parabolic flow profile in the channel due to a higher solvent viscosity, the focused stream width scales linearly with the mixing channel width, so that the focused stream width is approximately 6.5 times larger in the 65 µm channel than in the 10 µm channel at a given FRR. For an arbitrary FRR of 6 in the 10 µm device and 44 in the 65 µm device the focused stream width equals to approximately 1.4 µm in both mixing channels. As can be seen from Figure 19 the liposomes size distributions vary significantly for these two cases. Although no liposome size distribution is shown for a FRR of 44 in the 65µm device, the liposome size distribution must be between that of a FRR of 36 or 48. This can be explained by the fraction of convective-diffusive mixing of the focused alcohol-lipid stream with the sheathing buffer streams that occurs in the focusing region versus the diffusive mixing region in the outlet channel.
57
4.2.3 Influence of Qt on Liposome Formation at High and Low FRRs In the previous chapter it was shown that the vesicle size distribution remains nearly unaffected by Qt at high FRRs.47,48 While Qt has little impact on the average vesicle size at high FRRs (i.e. FRR > 30 in the 65 µm wide channel), its affect on the vesicle geometric radius increases noticeably towards lower FRRs (i.e. FRR < 20 in the 65 µm wide channel), as seen in Figure 20. Figure 20 a shows that decreasing Qt results in smaller vesicle radii and increasing homogeneity apparent by the increasing peak height. Furthermore, it clearly shows that increasing Qt changes the shape of the vesicle distribution from a skewed distribution to a more symmetric distribution, similar to decreasing FRR. From Figure 20 a it can be seen that a FRR of 14 at a Qt of 25 µL/min produces a peak number fraction of the vesicle Rg at about 40 nm similar to a FRR of 19 and a Qt of 100 µL/min (Figure 20 b). However, a higher FRR produces a narrower vesicle radii distribution. Figure 20b suggests that increasing Qt beyond 100 µL/min at a FRR of 19, can possibly produce larger and more homogenous liposomes than is possible with a lower FRR. However, substantially increasing Qt beyond 100 µL/min at low FRRs requires a longer channel; otherwise mixing of IPA with PBS will be incomplete within the mixing channel. Although the width of the vesicle radii distribution changes slightly, the peak height increases towards lower Qt at low FRRs, indicating an improving homogeneity. As the FRR increases, the vesicle radii distribution changes only subtly with Qt. Since Qt does not affect the vesicle size distribution at high FRRs it provides a means to increase the vesicle production rates. Figure 21 shows that the same trend is apparent in the 10 µm wide channel design.
58
a)
b) 0.12
FRR=14 Qt=25µL/min
0.08
Vesicle number fraction [1/nm]
Vesicle number fraction [1/nm]
0.10
Qt=50µL/min Qt=100µL/min
0.06 0.04 0.02 0.00 20
30
40
50
60
70
80
Qt=50µL/min Qt=100µL/min
0.08
0.04
0.00 20
Geometric radius, Rg, [nm]
30
40
50
60
70
Geometric radius, Rg, [nm]
c)
d) 0.20
0.25
FRR=29 Qt=25µL/min
Vesicle number fraction [1/nm]
Vesicle number fraction [1/nm]
FRR=19 Qt=25µL/min
Qt=50µL/min
0.15
Qt=100µL/min
0.10
0.05
0.00 20
30
40
50
60
70
80
Geometric radius, Rg, [nm]
FRR= 49 Qt=25µL/min
0.20
Qt=50µL/min Qt=100µL/min
0.15 0.10 0.05 0.00 20
30
40
50
60
70
80
Geometric radius, Rg, [nm]
Figure 20 Liposome size distributions are determined with MALLS. Increasing Qt from 25 µL/min to 100 µL/min at a constant FRR in the 65 µm wide channel increases the average liposome diameter. The velocity dependence is subtle at high FRR of 49 and increases noticeably towards low FRR of 14 in the 65 µm wide microchannel while only slightly affecting the vesicle homogeneity.
59
Vesicle number fraction [1/nm]
0.08
FRR=6 Qt=2.7µL/min
0.07
Qt=5.4µL/min Qt=8.1µL/min
0.06 0.05 0.04 0.03 0.02 0.01 0.00 40
50
60
70
80
90
100
110
120
130
Geometric radius, Rg, [nm]
Figure 21 Liposome size distribution determined with MALLS. Increasing Qt from 2.7 µL/min to 8.1 µL/min at a constant FRR of 6 increases the average liposome diameter in the 10 µm wide channel noticeably.
4.2.4 Influence of Diffusive and Convective Mixing on Liposome Formation MHF does play an important role in applications that require short mixing times and low sample consumption. In the MHF method a central stream is sandwiched between two adjacent streams and focused into a thinner stream, thereby reducing the mixing length, according to the FRR between the miscible center and adjacent streams. The width of the focused stream is proportional to the width of the mixing channel and inversely proportional to the FRR, neglecting a slightly flattened flow profile that deviates from a parabolic flow profile due to the different viscosities between IPA and water.48 The laminar flow in the microchannel makes this system very suitable for numerical analysis.83,84 The mixing of IPA with water is investigated by simulating the experimental flow conditions. The obtained vesicle size distribution for the a FRR of 14
60
and 49 at a Qt of 25 µL/min and 100 µL/min (Figure 20a and d) and FRR of 6 at a Qt of 2.7 µL/min and 8.1 µL/min (Figure 21) is explained on the concept of two mixing regions, the convective-diffusive transition region and the diffusive region in the outlet channel to explain the different vesicle size distribution. The concentration distribution of IPA sheathed by two adjacent water streams is simulated with a 2-dimensional model in FEMLAB 3.4 (Comsol, MA). The simulation couples the convective and diffusive mass transfer of IPA with the full Navier-Stokes equation for incompressible flow, considering spatially varying viscosity that depends on the local IPA/water volume fraction. The mass diffusivity of IPA and water results from the mass flux due to diffusion and the concentration gradient at the diffusive IPA/water interface. The directionality of the mass flux occurs from high concentration towards low concentrations of the respective solute. This means IPA diffuses from high concentration of IPA towards the aqueous phase whereas the water diffuses towards the focused IPA stream. The model approximates flow at the vertical midplane with two-dimensional flow simulations which is an idealization of the three-dimensional channel flow in the microchannel. The following state equations are solved iteratively,
(
)
− ∇ ⋅ η ∇u + (∇u )T + ρu ⋅ ∇u + ∇p = 0
(4.1)
∇ ⋅u = 0
(4.2)
− ∇ ⋅ (− D∇c + cu ) = 0
(4.3)
61
where η is the dynamic viscosity, u is the velocity with components u and v in the x and y directions, ρ is the density, p is the pressure, D is the diffusivity, and c is the concentration of IPA. Equations 4.1 - 4.3 are subject to the following boundary conditions:
u (x w ) = 0
(4.4)
∇c ⋅ nˆ = 0
(4.5)
where xw denotes the location of the wall and n is the wall unit normal vector. Equation 4.4 accounts for the no-slip condition and no penetration boundary condition at the wall, while equation 4.5 enforces the condition of zero diffusional flux at the walls.85 The boundary conditions at the inlets and outlets are as following (Table 1):
Concentration
Center-inlet
Side-inlet
Outlet
c=1
c=0
Convective flux
(− D∇c ) ⋅ n = 0 Velocity
average velocity
average velocity
outlet flow, pressure
u: in x-direction
u=u0
u=0
p0=0 Pa
v: in y-direction
v=0
v=v0
η ∇u + (∇u )T ⋅ n = 0
(
)
Table 1 Inlet and outlet boundary conditions for the momentum and mass-diffusion analysis.
62
At the outlet, the diffusive mass transport is neglected in the normal direction of the microchannel cross-section and the mass-transport is mainly driven by convection. The convective flux boundary condition in regards to mass transport at the channel outlet eliminates concentration gradients in the flow direction; it is an appropriate boundary condition for convection dominated mass balances where the outlet concentration is unknown as in this simulation.
The average velocities in x- and y-direction are
determined by the volumetric flow-rate (Qt) at the respective buffer-to-solvent flow rate ratio (FRR) across the respective inlet channel cross-section. The center- and side-inlet channel length of the simulated geometry is approximately twice as long than the minimum channel length required for a constant velocity to develop into a parabolic flow profile according to Shah and London86
⎛ ⎞ 0.6 Le ≈ Dh ⋅ ⎜ + 0.056 ⋅ Re Dh ⎟ , ⎜ 1 + 0.035 ⋅ Re D ⎟ h ⎝ ⎠
(4.6)
where Le is the entrance length, Dh is the hydraulic diameter of the channel, and ReDh is the Reynolds number for the respective hydraulic diameter. Hence, it can be safely assumed that a parabolic flow-profile is completely developed before the different fluids intersect at the channel intersection. In order to build a memory efficient model an unstructured mesh is chosen with low node numbers or low mesh densities far from the focused center stream and high node numbers (i.e. high mesh densities) within and in the immediate vicinity of the hydrodynamically focused stream. The reasoning being that the concentration gradient is
63
the steepest in the immediate vicinity of the mixing interface and therefore requires a higher mesh density to reduce the error across the mesh elements. Furthermore, the convective term leads to instabilities in the solutions; therefore a fine mesh is required to obtain a stable solution for the concentration field. The minimum mesh element quality of 0.47 is above the acceptable value of 0.3. Overall the mesh element quality is close to 1. In the incompressible Navier-Stokes application mode a triangular Lagrange p2-p1 element is used. Here, the velocity components are modeled with second-order Lagrange elements while the pressure is modeled with linear elements. geometry are shown in Figure 22
64
The final mesh and
Figure 22 Shown are the respected meshes for the 10 µm (a) and 65 µm (b) wide microchannel geometries.
The discontinuous rectangle in a) and b) show the
truncated region for which the simulation results are shown in the following figures. The mesh of each geometry contains approximately 26.000 mesh elements, with higher mesh densities at the diffusive interface region between alcohol and water.
65
Homogenous mixing of IPA with water at the molecular scale is assumed in the simulation
thereby
neglecting
micro-heterogeneities
due
to
alcohol
cluster
formation64,65,68, which showed that the motion of water molecules is strongly correlated with those of alcohol in alcohol rich mixtures above 50 mol % and alcohol cluster formation below 20 mol %. Viscous anisotropy due to mixing of IPA and water is accounted for by a fifth-order polynomial function fitting empirical data for the viscosity and mutual diffusion coefficient (D12) at different volume fractions reported by Pratt et
-3
1.4x10
-9
-3
1.2x10
-9
3.0x10
1.0x10
-9
2.5x10
-3
8.0x10
-10
2.0x10
-3
6.0x10
-10
4.0x10
-10
2.0x10
-10
-3
1.0x10
-3
5.0x10
-4
0.0
-1
1.5x10
2
3.5x10
D12 [m s ]
dynamic viscosity [Pa s]
al.67 (seeFigure 23).
0.2
0.4
0.6
0.8
0.0 1.0
IPA volume fraction, x
Figure 23 Experimental data for the dynamic viscosity (�) and the mutual diffusion coefficient for IPA/water mixtures (�) are obtained from Pratt et al. for a temperature of 25 ºC. The dashed curves represent fifth-order polynomial fits to the experimental data for the dynamic viscosity (- - -) and the mutual diffusion coefficient (- - -) that are applied to the simulation model.
66
The following simulations show the resulting IPA concentration profile and the corresponding diffusive flux qualitatively for two different FRRs and Qts in the 10 µm (Figure 24) and 65 µm (Figure 25) wide channels, respectively. It is pointed out that the length of the focusing region between the 10 µm and the 65 µm channel design differs substantially. The length of the focusing region is with 10 µm in the 10 µm device approximately 9 times shorter than in the 65 µm device, while the average flow velocity is about the same in both devices. It can be seen from Figure 24a and Figure 24c that a higher FRR causes a stronger focused stream at a specific Qt. As the FRR increases the volume of the focused stream in the transition region decreases, while the surface area at the buffer-solvent interface increases.
The result of the inverse relationship between decreasing volume and
increasing interface area at increasing FRR is, that the lipid depletion rate due to selfassembly is higher than at lower FRRs. The more lipid molecules are depleted within the convective-diffusive transition region, the less lipid molecules are available to form larger liposomes in the diffusion dominated mixing channel. Conversely, at low FRRs the jet volume increases and the interface area decreases in the transition region resulting in a lower depletion rate of lipid molecules as a result of their self-assembly into liposomes. The fraction of lipid self-assembly in the mostly diffusion dominated mixing channel increases compared to the liposomes formed in the convective-diffusive focusing region, resulting in a greater amount of larger liposomes.
67
a)
b)
c)
d)
e)
FRR=6; Qt=2.7 µL/min
f)
FRR=6; Qt=8.1 µL/min
g)
FRR=36; Qt=2.7 µL/min
h)
FRR=36; Qt=8.1 µL/min
Figure 24 Simulated IPA concentration (a-d) and diffusive flux (e-h) profiles of the focused stream at a low FRR of 6 and a high FRR of 36 for a volumetric flow rate Qt of 2.7 µL/min and 8.1 µL/min in the 10 µm wide channel device.
68
Modulating Qt affects the convective-diffusive mixing of IPA and water in the focusing region as well as in the outlet channel section resulting in varying concentration profiles of IPA in water. A decrease of Qt from 8.1 µL/min to 2.7 µL/min at a constant FRR of 6 for the 10 µm channel device results in a steeper IPA concentration gradient (Figure 24a and c). Figure 24 shows the diffusive flux at low Qt, where a large fraction of the total diffusive flux is concentrated in the convective-diffusive transition region (Figure 24e). On the contrary, as Qt increases a high diffusive flux can be seen over an extended region in the mixing channel (Figure 24f). The shape of the focused stream changes only minutely, considering a slightly different flow profile due to a different mixing and hence viscosity profile. This means that the surface-to-volume ratio does remain approximately constant at varying Qt and constant FRR. Similar to decreasing Qt, increasing the FRR increases the amount of mixing of the focused stream in the focusing region. At a high FRR of 36 IPA in the focused stream is strongly diluted within the focusing region and most of the diffusive flux occurs within or close to the convectivediffusive mixing region, as can be seen in Figure 24c and Figure 24g. Increasing Qt only slightly shifts the diffusive flux into the solely diffusive region in the outlet channel (Figure 24h). Furthermore, the high focusing (high surface-to-volume ratio) depletes the lipid molecules due to self-assembly into liposomes at a higher rate.
Hence, the
remaining lipid-molecules in the diffusive mixing region form not as many larger liposomes. The same applies to the 65 µm wide channel and can be seen qualitatively in Figure 25.
69
a)
b)
c)
d)
e)
FRR=14, Qt=25 µL/min
f)
FRR=14, Qt=100 µL/min
g)
FRR=49, Qt=25 µL/min
h)
FRR=49, Qt=100 µL/min
Figure 25 Simulated IPA concentration profiles of the focused stream at the lowest FRR of 6 and the highest FRR of 36 for a volumetric flow rate Qt of 2.7 µL/min and 8.1 µL/min in the 65 µm wide channel (a-d) and their respective diffusive flux (e-h).
70
The following image sequence in Figure 26 shows a comparison of the focused IPA stream in a the 65 µm wide microchannel imaged with a fluorescence microscope and the 2-dimensional model simulation for the respective FRRs of 14 and 49 and Qts of 25 µL/min and 100 µL/min. It also shows that the shape of the focused IPA stream is represented correctly in the simulation. A measurement of the width of the focused stream is not possible as IPA and water continuously interdiffuse along the interface.
Figure 26 A comparison of the fluorescent microscope image (a-d) with the respective simulation (e-h) shows a very good correlation in the shape and the approximate width of the focused stream. This shows that the 2-dimensional model qualitatively represents the 3-dimensional experimental system. The fluorescence microscope images are obtained with 30 µmol/L SRB dissolved in PBS injected from the oblique side channels and IPA injected through the center inlet channel at the respective FRRs and Qts shown in the images (e-h).
71
The results show that similar vesicle size distribution can be obtained in both channel geometries, despite the fact that lipid molecules convect through different concentration gradient per time along the symmetry line. This suggests that the lipid selfassembly time scale is shorter than the convective time scale for lipid molecules to convect along the steep concentration gradient in the 10 µm channel. A high ratio of diffusive flux within the transitions region tends to produce smaller more homogeneous liposomes, while a higher fraction of the diffusive flux in the mixing channel region produces vesicles with a larger average Rg and broader size distribution. The qualitative description of IPA/water mixing and depletion along the interface and the separation of the vesicle formation into two different mixing domains provide a unifying concept to explain the obtained vesicle size distributions at different flow conditions and geometries. From the results of both channel designs it can be concluded that increasing the FRR and thereby increasing the focusing of the IPA stream increases the fraction of lipid selfassembly in the convective-diffusive transition region versus the diffusive mixing channel. Figure 19 shows that a higher FRR results in smaller liposomes, suggesting that they are primarily formed in the transition region before the focused jet enters the mixing channel. In contrast, a low FRR results in larger liposomes, which are primarily formed in the diffusively dominated mixing channel. The results clearly indicate that the lipid self-assembly strongly depends on the solvent-buffer interface and not solely on the final solvent concentration or focused stream width.
72
4.2.5 Reproducibility of Liposome Formation with MHF The ability to produce similar average liposomes diameter with the same FRR and Qt repeatedly suggests a fundamental underlying mechanism and rules out that the formation occurs after the microchannel exit, where mixing is uncontrolled. Figure 27 shows the vesicle size distributions at a FRR of 19 and 49 and a Qt of 50µL/min, and 150µL/min prepared on three different days with a complete new set of reagents. The dynamic and static light scattering instruments have an accuracy of 2 % to 5 % for their respective particles size range (MALLS 10 nm to 500 nm, QELS 1 nm to 30 nm in flow mode) and obtain reproducibility between measurements of better than 1 %. As can be seen in Figure 27, the average liposome geometric radius shows only minor variations that are within less than 10 % of the number-weighted average radii for each set of experiments. It can also been seen that the weighted average radii varies less than 5 % for liposomes formed at a high FRR of 49. The number-weighted average radii of liposomes prepared on different days but with the focus on applying similar conditions vary less than 10 % for larger vesicles and less than 5 % for smaller vesicles. Variations in the sample preparation procedure such as desiccation time and the use of dry IPA vs. regular IPA reduce the batch-to-batch consistency especially for liposomes obtained from a less focused stream. Batch-to-batch consistency is especially affected by the use of proper inline filters. It is advisable to use syringe-filters with low to no dead volume and carefully wet them, paying specific attention to the removal of entrapped gas bubbles. Entrapped gas bubbles in the filter can induce oscillations during focusing and hence affect the liposomes size distribution in consecutive runs.
73
a)
b)
FRR=19, Qt=50µL/min Rg= 35.4nm±3.9nm
0.14
Rg= 36.4nm±4.3nm
0.12
Rg= 38.2nm±5.1nm
0.10 0.08 0.06 0.04 0.02
Vesicle number fraction [1/nm]
Vesicle number fraction [1/nm]
0.16
0.00
0.08
FRR=19, Qt=150µL/min
0.07
Rg=46.3nm±6.6nm
Rg=45.4nm±6.0nm Rg=48.3nm±7.6nm
0.06 0.05 0.04 0.03 0.02 0.01 0.00
25
30
35
40
45
50
30
Geometric radius, Rg, [nm]
c)
50
0.25
70
FRR=49, Qt=150µL/min
Rg=29.0nm±3.0nm Rg=29.5nm±3.3nm 0.15
0.10
0.05
0.00 25
30
35
Vesicle number fraction [1/nm]
Rg=28.7nm±3.4nm
0.20
20
60
d) FRR=49, Qt=50µL/min
Vesicle number fraction [1/nm]
40
Geometric radius, Rg, [nm]
Rg=28.5nm±2.4nm Rg=28.6nm±2.6nm
0.20
Rg=28.6nm±3.5nm 0.15
0.10
0.05
0.00
40
20
Geometric radius, Rg, [nm]
25
30
35
40
Geometric radius, Rg, [nm]
Figure 27 Shown are liposome size distribution of liposomes prepared in the 65 µm wide multiple-inlet channel design on three different days under various flow conditions; (a) FRR=19 and Qt=50 µL/min, (b) FRR=19 and Qt=150 µL/min, (c) FRR=49 and Qt=50 µL/min, and (d) FRR=49 and Qt=150 µL/min.
74
4.3
Summary
The results of these experiments are used to elucidate several phenomena related to microfluidic directed liposome formation including the effects of focused stream width, alcohol concentration gradients, and flow velocity. The combined effect of the technological advances and improved understanding of formation processes will potentially facilitate on-chip integration of this technique as well as its use in point-ofcare medical treatment. Using a narrower channel width, the channel length can be reduced due to smaller focused stream width and shorter mixing times, reducing the footprint of the device for on-chip integration. The smaller microfluidic device presented produces comparable liposome size distribution that are slightly narrower particularly between 60 nm to 80 nm liposome geometric radii, and higher liposome concentrations for a given size distribution due to lower buffer-to-solvent flow rate ratios. Changing the device geometry provides a simple means to increase the liposome concentration in a sample.
A higher vesicle concentration in the smaller channel
geometry should therefore allow higher encapsulation efficiencies and may increase the applicability of liposome formation with MHF for drug delivery applications. Reproducibility measurements demonstrate that microfluidic liposome formation allows for consistency beyond that of other techniques, which is essential for the integration and application of this technique. The laminar flow conditions prevalent in MHF allows simulating mass and momentum transport and enables a more thorough investigation of the vesicle formation process. The combined experimental and simulation results suggest that the obtained liposome size distribution can be correlated in a first approximation by considering the
75
formation in the convective-diffusive focusing region and the diffusive mixing channel region. The results discussed herein provide directions to be used in numerical simulation to improve channel design and optimize vesicle size distributions to hopefully provide very narrow vesicle size distributions of larger vesicles in the future. The facile control of liposome formation with MHF provides a means to systematically investigate the liposome formation process. A complete understanding of the formation process requires further investigation including viscous anisotropy of alcohol/buffer systems and the polarity and chemical potential of different alcohols. Considering the viscous anisotropy and polarity of various alcohols is a next step that may help to understand the different vesicle size distributions obtained with other solvent-water combinations such as ethanol or methanol in water. Another effect not yet investigated experimentally but through simulation is viscous anisotropy. The viscosity of an IPA-buffer mixtures increases from the viscosity of pure IPA, peaks at about 3 times the viscosity of water, and decreases to the viscosity of water in the absence of IPA. This viscous anisotropy retards molecular diffusion at the IPA/water interface and can have a pronounced effect on the lipid self-assembly into liposomes. A big role to further elucidate the lipid self-assembly process could come from molecular dynamics simulations combined with mass and momentum transport simulation.
76
Chapter 5: Controlled Encapsulation of a Model Drug in Nano-Liposomes The previous chapter focused on details of the liposomes formation process of with microfluidic hydrodynamic focusing (MHF). It was demonstrated that geometric aspects regarding the channel design and hydrodynamic aspects such as FRR and Qt influence the final liposome size distribution. This chapter focuses on the encapsulation characteristic of liposomes formed with MHF.
5.1
Introduction
Nanoparticles can either be used for drug delivery applications to achieve selective and sufficiently high localization of “active” drug at the disease site, or as container for single molecules studies. A promising candidate for both spectra, high loading as in drug delivery applications as well as encapsulation of single or few molecule, are liposomes. While selective localization by means of passive and active targeting is not in the scope of this work, the encapsulation characteristic of compounds into liposomes is. In order to successfully apply liposomes in drug delivery applications it is important to controllably load the compounds (i.e. drugs, vaccines, therapeutics, etc.) of interest into liposomes. This can be achieved by passive or active loading. In the microfluidic approach as discussed in this work, the loading of liposomes is facilitated by passive means. In conventional passive loading techniques, liposomes are formed in a bulk aqueous solution containing a homogenous concentration of water-soluble encapsulant. Unfortunately, due to the formation method only a small fraction of the compound is eventually encapsulated and a large fraction of non-encapsulated compound needs to be recycled for further use. In contrast to macro-scale batch liposome formation 77
and loading, microfluidics allows minimizing the amount of non-encapsulated compound by confining it solely to the immediate vicinity where liposomes formation and concomitant encapsulation occurs. A common approach to determine the amount of encapsulated compounds requires one to measure the liposome concentration, lyse the liposomes, and measure the fluorescence intensity of the new solution.76,87-89
This approach has several
shortcomings. First, the characterization process destroys the sample; second, lysing the liposome sample requires the addition of a surfactant (Triton X-100, etc) which itself typically shows strong fluorescent properties; finally, this approach assumes one can measure the absolute concentration of a liposome sample or that the concentration in a liposomes equals that in the initial medium90,91. Techniques such as direct counting, used for cellular analysis, will not work for nanometer-sized liposomes and scattering experiments require model dependent parameters to estimate the true particle concentration. These models can lead to large uncertainties in absolute particle numbers. The fluorophore sulforhodamine B (SRB) serves as a hydrophilic drug simulant that is encapsulated into liposomes to investigate the loading characteristic with MHF. The number of encapsulated SRB molecules is determined with fluorescence fluctuation analysis, which is a non-destructive technique.92-94
Specifically, we combine FCS
analysis with the first two cumulants of the fluorescence intensity fluctuations to quantify the number of encapsulated SRB molecules. In the analysis it is not assumed that the liposomes in a given sample are equally bright, but rather, the number of SRB molecules per liposome follows a Poissonian. This allows analyzing the number of encapsulated
78
SRB molecules at low dye concentrations where the average number of encapsulated dye molecules is less than one. The ability to control the entrapped amount of compound by adjusting the flow parameters in the multiple-inlet microfluidic channel network is discussed. Additionally, it is demonstrated that in the applied passive continuous-flow microfluidic encapsulation strategy, the number of encapsulated molecules depends on the liposome size and the compound concentration in the mobile phase. It is shown that the microfluidic system allows controlling the number of encapsulated SRB molecules while minimizing the compound consumption.
5.2
Description of Experimental Procedures
The multiple-inlet microchannel design is used to investigate the loading characteristics of liposomes with MHF. The fabrication of the microchannel is according to the previous chapters. Briefly, the microchannels have a rectangular cross section due to DRIE. The width of the center inlet channel is 42 µm, the mixing channel and the oblique side channels for PBS are 65 µm, and the two inner side channels for the compound to be encapsulated are 42 µm wide. All microchannels are 120 µm deep. High resolution separation of the liposome population according to their hydrodynamic radius and subsequent size distribution analysis was performed using AF4 with multi-angle laser light scattering (MALLS) and quasi-elastic light scattering (QELS) (model DAWN EOS and QELS, Wyatt Technology, Santa Barbara, CA) as described in the previous chapters.
79
5.2.1 Materials The lipid-blend composed of DMPC:Cholesterol: DCP at a molar ratio of 5:4:1 is prepared as described previously. Sulforhodamine B (SRB) was dissolved in PBS at multiple concentrations ranging from 500 nmol/L to 500 µmol/L. Polyethyleneglycol with a molecular weight of 6 kDa (from hereon referred to as PEG-6000) is mixed into a liposome sample at a concentration of 10 % by weight to determine if fast fluctuation measured with FCS stem from background SRB or encapsulated SRB.
5.2.2 Liposome Formation A lipid mixture dissolved in IPA is injected into the left center channel of the microfluidic network, SRB dye is dissolved in PBS at a concentration of 0.5 mmol/L and injected into the two inner side channels, and PBS without SRB dye into the two outermost side channels all intersecting with the center channel, as is shown in Figure 28. Encapsulation studies to reduce the amount of non-encapsulated SRB were performed with a constant FRR of 35 and a Qt of 200 µL/min. The total SRB dye content in the system was varied between 5 v/v % to 40 v/v % of the total liquid volume by adjusting the volumetric flow rate of the outer and the inner side-channels, respectively. A volume of 500 µL of the liposome effluent was collected from the outlet channels of the microfluidic network and subsequently filtered through a polyacrylamide column with a MWCO of 6 kDa to remove non-encapsulated SRB. In order to determine if gel filtration affects the liposome size distribution, multiple liposomes samples are prepared at a Qt of 100 µL/min and 200 µL/min and at FRRs of 19, 29, and 39. The samples are measured before and after gel filtration.
The number of SRB molecules encapsulated into
80
liposomes is investigated with vesicles prepared at a Qt of 100 µL/min and two FRRs of 19 and 49; all side channels contained SRB dissolved in PBS at concentrations varying from 500 nmol/L to 250 µmol/L.
Figure 28 False color confocal fluorescence micrograph of the microchannel network showing the fluorescent intensity of 0.5 mmol/L SRB in PBS injected into the left two inner side channels. PBS without SRB dye is injected into the left two outer side channels, and lipid mixture is injected into the left center channel.
5.2.3 Fluorescence Fluctuation Spectroscopy The experimental work is performed on a confocal fluorescence microscopy setup built upon an inverted microscope (Axiovert 200, Carl Zeiss, Germany), as shown schematically in Figure 29.
A frequency doubled Nd:YAG laser (SLM-532-50,
Crystalaser, Reno, NV) operating in continuous wave mode at 532 nm is sent through the back aperture of a 63x, 1.2 NA, water-immersion microscope objective (Carl Zeiss, Germany). The laser beam underfills the back aperture of the objective to create an
81
excitation volume greater than the diffraction limited volume. The laser power measured after the light passes through the microscope objective is 150 μW. A constant laser power is maintained by manually adjusting the polarization optics to eliminate intensity fluctuations between sample runs (on the order of 10 minutes).
sample
iris
APD
532 nm laser
Figure 29 A schematic drawing of the experimental setup.
Not all lenses and
mirrors are shown. The adjustable iris before the microscope objective shutters down the input beam in order to increase the excitation volume. The fluorescent light is sent back through the objective and passes through a dichroic mirror and is directed into the single photon counting module (APD). TTL pulses from the APD are sent to a computer for processing.
A chamber for the 100 µL of the sample solution (liposomes and free SRB dye) is made by drilling a 1 cm hole through a microscope slide and sealing both sides of the microscope slide with a #1.5 glass coverslip using vacuum grease. Fluorescence light from the sample is focused down onto a 100 μm pinhole, appropriate dichroic mirrors and optical filters (Omega Optical, Brattleboro, VT) direct the fluorescence light of 82
interest onto the active area of an avalanche photodiode (AQR-SPCM-14, Perkin Elmer, Ontario, Canada). Most photon arrivals create transistor-transistor logic (TTL) pulses that are sent to a peripheral component-interconnect (PCI) hardware counting card (PCI6602, National Instruments, Houston, TX). The TTL pulses are counted and analyzed with a homemade software (Labview 8.0, National Instruments) multi-tau correlator having a temporal range from 4 μs to 2 s.95 The software bins the number of photons arriving within 16 μs integration time to create a photon counting histogram (PCH). The ACF and PCH is stored every 10 s. Typically, 30 data sets are collected for each sample from which the first two moments along with standard deviations are calculated. Deadtime and afterpulsing effects are corrected for following a method described elsewhere.94 Occasionally, large photon bursts occur from a cluster of liposomes diffusing through the laser beam. Any 10 s data-set that leads to a value greater than 4 standard deviations from their respective means for either of the first two fluorescence moments is discarded. All results are reported with standard error bars at the 95 % confidence interval. The fluorescence properties of the detection system are calibrated with 1 nmol/L SRB in PBS. A stock solution of 1 nmol/L SRB in PBS is prepared and 100 μL of it is measured before and after each liposome sample.
From the calibration data three
parameters of interest are extracted; the free SRB diffusion time, τD(SRB), the ratio of the axial extension and waist of the excitation volume, z/w, and the molecular brightness of a single SRB molecule, xSRB. The measurements result in a laser exaction volume and standard deviation of 11.2±0.5 fL, corresponding to a full beam waist w0 of 1.4 µm and a
83
diffusion coefficient D of 4 x 10⁻¹⁰ m2/s. The brightness of a single SRB molecule is determined with a photon counting histogram as following, ΔP 2 − P
xSRB =
P
.
(5.1)
A non-systematic error of 5%-10% is present in the values for xSRB throughout the course of the day. This drift is not dependent on laser power fluctuations because it is monitored before and after each sample run, and is stable during the measurement time of approximately 2-3 minutes. There are also no moving parts in the laser path (e.g., flipper mount mirrors). Therefore, this error is propagated as a standard deviation throughout all the relevant calculations. The autocorrelation of each liposome sample is used to extract the average number of background SRB molecules, NSRB, contained within the laser excitation volume.
It is assumed that the liposomes are non-interacting and point-like (no
significant contribution of Brownian fluctuation from encapsulated SRB). For this type of system, Qian et al. developed relationships between the mean and variance of the number of photon counts detected per unit time from this arrangement and the brightness, xi, and number, Ni, of the fluorescent species within the excitation volume.96 k
P = ∑ N i xi + PB ,
(5.2)
i=1 k
(ΔP) − P = ∑ N i xi2 , 2
i=1
84
(5.3)
where
is a time average, 〈P〉 is the average number of photons detected per
unit time, and PB is the average background count rate (count rate for a sample with no fluorescent species) which we assume to be Poissonian. Each liposome in a given ensemble contains an integer number, n, of SRB dye molecules (n = 0, 1, 2, …). Liposomes containing n SRB molecules will be n times brighter than a free SRB molecule as long as the concentrations are within the non-selfquenching regime of SRB. The number of encapsulated SRB molecules across the liposome population is described with the brightness probability distribution, Π(n), defined as the probability for a given liposome to contain n fluorescent SRB molecules. It is assumed that not all SRB in our sample is sequestered into the liposomes, but rather, some amount of SRB is freely diffusing in the exterior of the liposomes.
For an
ensemble of liposomes, each having an integer number of SRB molecules, the first two cumulants of the fluorescent signal can than be rewritten from eq. 5.2. and 5.3 as,
P = N SRB ⋅ Q SRB + N lip ⋅ x SRB ⋅ [n ] + P
(ΔP )2
[ ]
2 2 − P = N SRB ⋅ xSRB + N lip ⋅ xSRB n2
B
and
(5.4) (5.5)
where, xSRB is the free SRB dye molecular brightness measured in the number of detected photons per molecule per unit time, Nlip and NSRB are the average number of liposomes and free SRB dye molecules (independent of n) within the laser excitation volume, ΔP = P − P are the fluctuations about the mean number of detected photons per unit
time, and
[n ] = ∑ Π(n)n x
x
,
n
85
(5.6)
where [ ] represents and average over the brightness probability distribution. Combining eq. 5.4 and 5.5 results in the following expression,
[n ] = (ΔP ) − J= 2
2
[n]
xSRB ⋅ P − P
(
2 P − N dye ⋅ xSRB B
− N dye ⋅ xSRB
).
(5.7)
Assuming all liposomes in a given sample are equally bright (a common assumption) is equivalent to setting [n2] = [n]2 and J = [n] equals the average number of dye molecules contained per liposome. A more realistic assumption is that the number of molecules per liposome is given by a Poisson distribution ([n2] = [n]2 + [n]). From this distribution we find an expression for the average number of molecules per liposome,
[n ] = J −1.
(5.8)
Equation 5.8 is a critical result, namely a proper assumption of the brightness distribution function, Π(n), will avoid overestimates of encapsulated SRB in liposomes.
This
observation becomes especially important in the low concentration limit ([n] < 1).
5.3
Results and Discussion
5.3.1 Liposome Size Distribution after Gel Permeation Chromatography Before analyzing the fluorescence intensity of the liposomes the non-encapsulated SRB in PBS must be removed. This is accomplished by filtering 500 µL of the sample containing
liposomes
and
polyacrylamide gel column.
non-encapsulated
SRB
through
a
6 kDa
MWCO
A major concern during gel-filtration is the possible
interaction of liposomes with the gel matrix of the column and thereby a change of the original liposome size distribution. Figure 30 shows the liposome size distribution for two different sets of liposomes before and after gel permeation chromatography.
86
Vesicle number density (normalized)
a)
Qt=100µL/min
1.0
no gel filtration FRR=19 FRR=29 FRR=39 with gel filtration FRR=19 FRR=29 FRR=39
0.8
0.6
0.4
0.2
0.0 20
30
40
50
60
70
b)
Vesicle number density (normalized)
Geometric radius, Rg, [nm]
Qt=200µL/min,
1.0
no gel filtration FRR=19:1 FRR=29:1 FRR=39:1 with gel filtration FRR=19:1 FRR=29:1 FRR=39:1
0.8
0.6
0.4
0.2
0.0 20
30
40
50
60
70
80
90
100
110
Geometric radius, Rg, [nm]
Figure 30 Shown are the liposome size distributions before and after gel permeation chromatography for liposome prepared at a FRR of 19, 29, and 39, at a Qt of 100 µL/min (a) and 200 µL/min (b).
87
It can be seen from Figure 30 that the liposomes size distributions remain nearly unaffected after the gel filtration process within the investigated liposome diameter, ranging from approximately 60 nm to 90. The results show that no artificial selection for a particular vesicles diameter occurs during the filtration process and the filtered liposome sample represents the liposome size distribution obtained during the formation process in the microchannel.
5.3.2 Free SRB Dye Fluctuations The gel filtration process is sufficient for removing free SRB from the liposome sample. Nevertheless, a small quantity of free SRB is often detectable. The fluorescent contribution of the free SRB is negligible when the liposomes encapsulate a large number of SRB molecules. However, in the case of low SRB loading into the liposomes, the background SRB component can become significant, as is shown in Figure 31. As mentioned before, FCS allows extracting the background SRB concentration.
To
estimate the free SRB concentration it is important to ensure that the fast component of the FCS measurement truly originates from external SRB in PBS and not from internal fluctuation of SRB inside liposomes as the vesicles translate across the focal volume. In order to prove that the background SRB concentration in our FCS measurements originates from freely diffusing SRB in PBS outside the liposomes and not from fluctuations of SRB inside the liposomes we add PEG-6000 at a concentration of 10 % by weight to the sample. PEG-6000 does not permeate through the liposome membrane; hence, it will increase the viscosity of PBS only outside but not inside the liposomes.
88
fast component slow component
Figure 31 ACF from FCS measurements of liposomes with low SRB concentration fitted to a two component fit.
Figure 32a shows the fast dye component FCS data for free SRB in PBS and with addition of PEG-6000 to PBS at a concentration of 10% by weight. The addition of PEG-6000 increases the viscosity of the exterior PBS and increases the diffusion time of the contained particles. An FCS measurement is performed on a liposome sample before and after the addition of the PEG-6000. It can be seen from Figure 32 b that the liposome solution fit before the PEG addition has a fast component that matches the same time constant as the free dye in solution. The liposomes after the PEG addition shows the fit is best performed with the slow diffusion component. This is direct evidence that the fast component in the FCS measurement of the liposome sample indeed stems from background dye diffusing in the exterior PBS and is not due to fluctuations of SRB encapsulated within liposomes.
89
a)
b)
Figure 32 (a) Free SRB in PBS at 1 nmol/L concentration (red curve with τ=280 µs) and mixed with PEG-6000 at 10% by weight (blue curve with τ=850 µs). The addition of PEG-6000 increases the viscosity and therefore decreases the diffusion of SRB. (b) Liposomes formed at a SRB concentration of 500 nmol/L in PBS and subsequently mixed with PEG-6000 at a concentration of 10 % by weight. The data is fit with a fast component (red curve with τ=280 µs) and slower component (blue curve with τ=850 µs). The fit strongly suggests the fast dye component is affected by PEG-6000, which suggests that the fast component originates from free SRB and not from SRB encapsulated inside liposomes.
90
5.3.3 High Encapsulation of Low Concentrated SRB in Nano-liposomes The encapsulated SRB concentration in liposomes versus the SRB concentration dissolved initially in PBS was investigated for 60 nm and 80 nm vesicles at initial SRB concentration in PBS ranging from 500 nmol/L to 250 µmol/L. SRB is a is membrane impermeable zwitterionic fluorophore with a net charge of zero at neutral pH (~7.4).97 The maximum non-selfquenching SRB concentration is limited to about 1 mmol/L of SRB in PBS. The maximum SRB concentration is a result of increasing background SRB after gel filtration and a maximum brightness of the liposomes measurable with the used avalanche photo diode (APD). Higher concentration can certainly be encapsulated but require an optical density filter that reduces the fluorescence signal to avoid damage of the sensitive avalanche photo diodes. Furthermore, SRB quenching needs to be considered at higher loading concentrations. Figure 33 the liposome size distribution is shown for the 60 nm and 80 nm vesicles produced at a FRR of 19 and 49.
91
Vesicle number fraction [1/nm]
0.25
FRR=19; Rg=40.4nm±4.2nm FRR=49; Rg=30.0nm±2.2nm
0.20
0.15
0.10
0.05
0.00 20
30
40
50
60
Geometric radius,Rg, [nm]
Figure 33 Vesicle size distributions obtained at a Qt of 100 µL/min and a FRR of 19 and 49.
It can be seen from Figure 34a, that the SRB concentration in the 80 nm vesicles amounts to approximately 39 % of the initial SRB concentrations within 10mmol/L and 100 µmol/L dissolved in PBS. In between we can see that the concentration of encapsulated SRB is slightly higher but always below the starting concentration of SRB in PBS.
However, as can be seen in Figure 34b, the 60 nm vesicles show an
unexpectedly high SRB concentration that exceeds the starting concentration of SRB dissolved in PBS at SRB concentrations below 100 µmol/L. Notice the experimental data approaches zero, which suggests the Poissonian loading assumption is valid and also, that the molecular brightness is unaffected by being encapsulated in the liposomes. A single encapsulated SRB molecule appears as bright as a single free SRB molecule in PBS.
92
Avg. # SRB molecules per liposome
a)
10 measured for Rg=40.4nm 8
100% encapsulation 39% encapsulation
6
4
2
0 1
10
100
b)
Avg. # SRB molecules per liposome
Concentration of SRB in PBS [µmol/L] 10 measured for Rg=30nm 100% encapsulation 8
6
4
2
0 1
10
100
Concentration of SRB in PBS [µmol/L]
Figure 34 Average number of encapsulated SRB molecules in 80 nm (a) and 60 nm (b) diameter vesicles. The red curve represents the number of encapsulated SRB molecules where the concentration in the liposome equals the starting concentration of SRB in PBS. The blue curve is the best weighted fit for encapsulated SRB that amounts to 39 % of the SRB concentration in PBS. The error bars show the 95% confidence interval calculated by multiplying the error propagated standard deviation by 1.96 and dividing by the square root of number of 10-second intervals measured for a given loading concentration (generally 25 sets).
93
The higher SRB concentration in the smaller vesicles, although not yet confirmed, may be due to a spatial SRB concentration enhancement induced by viscous anisotropy and partitioning of SRB in the microchannel as IPA mixes with aqueous solutions. The number of encapsulated SRB molecules generally increases with increasing SRB concentrations. The fluorescence measurement show that liposomes with a diameter of 80 nm encapsulate a slightly larger average numbers of SRB molecules than 60 nm liposomes at concentrations of SRB in PBS > 100 µmol/L.
This seems obvious
considering that 80 nm diameter vesicles have an approximately 2.5-fold larger interior volume than 60 nm vesicles. Despite the larger aqueous interior of the 80 nm vesicles the number of encapsulated SRB molecules is only 50 % higher than that of the 60 nm vesicles (within the measured range) and therefore results in an overall lower SRB concentration than the SRB concentration in PBS for the larger vesicles. Considering the larger volume of the 80 nm vesicles it is surprising that the 60 nm vesicles encapsulate more SRB molecules when the SRB concentration in PBS falls below 100 µmol/L. From the simulation it can be seen in Figure 35 that the mixing of IPA and PBS in the sheathed flow results in a viscous anisotropy across the two mixing streams that is highly nonlinear. The viscosity increases three-fold from the viscosity of PBS as it mixes with IPA. This viscous anisotropy and a possible partitioning of SRB between IPA and PBS could manifest in an SRB enhancement in the highly viscous region where the diffusion coefficient of SRB reaches a minimum. Investigations are currently underway to further validate this phenomenon.
94
Figure 35 Simulation of IPA and PBS mixing during hydrodynamic focusing. The resulting concentration profile (a), viscosity distribution (b) and mutual diffusion coefficient (c) are shown for the mixing of IPA and PBS. The viscosity ratio and normalized diffusion coefficient for SRB within of the simulation in (b) and (c) are shown in the graph in (d). Greatly exaggerated shown is the enhancement of SRB as a results of viscous anisotropy and possible partitioning between IPA and PBS.
95
5.3.4 Reducing the Amount of Non-Encapsulated SRB with MHF Control of the number of encapsulated SRB into liposomes was studied by injecting different volume fractions of SRB (2.5 v/v %, 5 v/v %, 10 v/v %, 20 v/v %, 30 v/v %, 40 v/v %) with a total VFR of 200 µL/min. The confocal fluorescence images in Figure 36 illustrate the fluorescence intensity of SRB for various PBS-to-SRB flow rate ratios. It can be seen that increasing the volumetric flow rate of SRB, while keeping the overall PBS flow rate constant, reduces the amount of mixing of SRB prior to the focusing region (see Figure 36). The degree of mixing between SRB and the adjacent PBS depends on the flow velocity, SRB-to-PBS flow rate ratio, and length of the channel section between the SRB injection and the center inlet channel over which mixing can occur. Figure 36d illustrates a side channel that is completely filled with SRB, which would be analogous to encapsulation with the batch solvent injection method, in which the buffer contains a homogenous distribution of the solute to be encapsulated into the liposomes. In addition to controlling the number of molecules loaded into the liposomes, a reduced volume fraction of SRB was determined that allowed encapsulation without adversely affecting the SRB concentration in the liposomes. Figure 37 shows the liposome size and size distribution obtained during the encapsulation studies. It further demonstrates the high reproducibility of liposome formation achievable in a microfluidic format.
96
a)
b)
c)
d)
Figure 36 False-color confocal fluorescence micrograph of the microchannel network showing the fluorescent intensity of 0.5 mmol/L SRB in PBS injected into the left two inner side channels. PBS without SRB dye is injected into the left two outer side channels, and lipid mixture is injected into the left center channel. The total Qt is 200 µL/min and the FRR is constant at 9. The SRB volume fractions shown are 5 % (a), 25 % (b), 50 % (c), and 100 % (d).
97
Figure 37 shows the normalized vesicle size distribution for a FRR of 35 and a Qt of 200 µL/min at different volume fractions of SRB. It can be seen from Figure 37 that the vesicle size distributions remains approximately constant and the largest fraction of the
-1
Vesicle number fraction (norm.) [nm ]
vesicles have a geometric radius, Rg, which varies slightly between 29 nm and 32 nm.
SRB=2.5 v/v% SRB=5.0 v/v% SRB=10 v/v% SRB=20 v/v% SRB=30 v/v% SRB=40 v/v%
1.0
0.8
0.6
0.4
0.2
0.0 20
30
40
50
60
70
Geometric radius, Rg, [nm]
Figure 37 Similar liposome size and size distribution at constant Qt of 200 µL/min and FRR of 35 for 6 different volume fractions of SRB in the total sample volume.
Figure 38 shows that the volume fraction of SRB can be reduced significantly before a moderate change in the amount of encapsulated SRB is detected. A 40-fold reduction in SRB content reduces the total number of encapsulated SRB molecules by about a factor of 2. In contrast to common batch fabrication methods, microfluidics has the ability to spatially localize the encapsulant to the immediate vicinity where encapsulation is expected and thereby reduce the encapsulant waste substantially without 98
adversely affecting the concentration of compound inside the liposome. Control of the encapsulated SRB concentration in liposomes can be achieved below 20 v/v % of SRB of the total sample volume.
This allows for tuning the concentration of compound
Avg. # of SRB molecules per liposome
encapsulated in the liposome from an initial SRB concentration.
14 13 12 11 10 9 8 7 6 5 0
5
10
15
20
25
30
35
40
45
SRB volume fraction [v/v%]
Figure 38 Data shows the number of SRB molecules per liposome along with the 95 % confidence interval. Reducing the SRB volume fraction reduces the number of encapsulated SRB molecules from about 14 to 7. Maximum encapsulation is already achieved at 20 % volume fraction of SRB in the channel, reducing the SRB waste by almost 80 %.
Varying SRB concentrations inside the liposomes are facilitated by the laminar flow conditions in the microchannel which enables controlled diffusive mixing at the liquid interfaces prior to mixing with the center stream. In macro-scale batch-processing
99
this can only be achieved by replacing the entire buffer volume. Filling all side-channels with PBS containing SRB is representative of common batch processing. In addition to reduced sample consumption, which is desired from an economical standpoint, the continuous-flow microfluidic approach allows controlling the concentration of the substance to be encapsulated from an initial starting concentration via controlled diffusive mixing. This enables facile control of the concentration of encapsulated SRB into liposomes.
5.4
Summary
The formation of liposomes and encapsulation of a hydrophilic drug simulant (SRB) has been demonstrated using a microfluidic technique. Microfluidics enables reproducible and fine control over liposome size and size distribution, tunable loading of liposomes, and substantially reduced encapsulant consumption, without adversely affecting the encapsulation. The waste of compound (SRB) can be reduced significantly by confining it to the immediate vicinity where liposome formation and concomitant encapsulation occurs.
The perturbation of the liposome size distribution after gel
permeation chromatography is minute. Additionally, results showed an unexpectedly high loading of low concentrated SRB for small vesicles produced at high FRRs. It is hypothesized that viscous anisotropy and partitioning of SRB, as a result of the mixing between IPA and PBS, leads to diffusive retardation at locally high viscosities at the diffusive liquid-liquid interface and therefore spatial concentration enhancement of SRB. This new technique could yield an improvement over the generally low encapsulation efficiencies of liposomes observed with passive loading methods, especially with a
100
smaller channel design which increases the liposome concentration and thereby could further enhance the encapsulation efficiency. The simplicity of this liposome formation and drug encapsulation strategy could allow for implementation in point-of-care drug encapsulation, eliminating shelf-life limitations of liposome preparation and reducing encapsulant consumption. Furthermore, fluorescence correlation spectroscopy in combination with fluorescence cumulant analysis provides a non-destructive approach to determine average loading efficiencies and has the potential for integration in future lab-on-a-chip applications and for online liposome characterization.
101
Chapter 6: Summary and Future Work This dissertation demonstrates a novel microfluidic method to continuously produce liposomes with an average diameter in the range of 50 nm to 150 nm and controllably encapsulate a hydrophilic drug simulant. The liposome size range is relevant for drug delivery applications from the standpoint of clearance rate by the mononuclear phagocyte system and permeation through for example fenestrated tumor vasculature. Furthermore, the achievable liposome size range is also interesting for nanometer-scale confinement strategies in single molecule studies. A single or a few molecules can be compartmentalized in nanometer-scale liposomes which can be subsequently tethered to a surface while enabling free Brownian motion of the entrapped molecules. This is in contrast to common single molecules studies where the molecule of interest is tethered to a surface to facilitate long observation times. The narrow liposome size distributions obtained with MHF do not require sizealtering post-processing procedures which often decrease the yield of the liposome sample through further dilution. A comparison of liposome size distributions obtained with different methods is shown in Figure 39. It shows the liposome size distribution obtained with MHF without any further post-processing, after 11 cycles of membrane extrusion through a 100 nm pore filter at elevated temperatures, and with the cross-flow method by Wagner et al.41.
102
Vesicle number fraction (norm.)
MHF (Jahn et al.) Avanti (100nm membrane extrusion, 11 cycles) Wagner (J. Liposomes Research, Vol. 12, No.3)
1.0
0.8
0.6
0.4
0.2
0.0 0
100
200
300
400
500
600
700
800
Vesicle diameter [nm]
Figure 39 A comparison of liposome size distribution obtained with different methods.
The continuous-flow approach maintains a stable solvent/buffer concentration distribution. This is in contrast to the standard solvent injection method where the solvent concentration changes continuously during the injection process until the entire desired amount of solvent/lipid mixture is injected into the beaker. The liposome size distribution remains constant for a particular flow condition and channel geometry and can be continuously collected. The MHF method allows facile control over the liposome diameter by adjusting the FRR or Qt that has not been reported with any other method. A non-destructive methodology was developed to determine the true concentration of encapsulated SRB in liposomes using fluorescence fluctuation
103
spectroscopy. This technique can potentially be integrated into a microchip format and hence, can enable real-time on-chip characterization for purposes of quality control. It was shown that the encapsulation depends on the concentration of the compound in the mobile phase as well as the size of the liposomes. The loading behavior of the liposomes can potentially contribute to understanding the self-assembly process in the solvent injection method with MHF. The comparison of different channel geometries and fluid dynamic parameters revealed that the liposome concentration can be increased by reducing the channel widths without affecting the liposome size distribution.
The investigation of the channel
geometry resulted in the distinction of liposome formation in convective and diffusive mixing regimes.
Increasing the liposome concentration is especially interesting in
regards to improving the encapsulation efficiency of compounds into liposomes. In addition, reducing the footprint of the microchannel network makes it more amenable to integration in lab-on-a-chip devices. The MHF method pushes the benchmark in regards to reproducible liposome formation. Liposomes of constant diameter can be formed over extended periods of time as long as the hydrodynamic parameters are not varied, with the time only being limited to the size of the containers or syringes that contain the buffer and solvent. Liposome formation with MHF provides predictable momentum and mass transport due to laminar flow and enables the investigation of non-observable parameter with fluid dynamics and mass transport simulations. A continuation towards molecular dynamics simulation may eventually elucidate the assembly process on a molecular scale.
104
The investigation of fundamental parameters instead of process parameter can help to increase the understanding of lipid self-assembly. The facile control of lipid self-assembly into liposomes with MHF combined with highly sensitive (single molecule detection) fluorescence fluctuation spectroscopy showed an unexpected encapsulation behavior at low compound concentrations. The concentration of encapsulated compounds exceeds the initial concentration in the mobile phase. The origin of this phenomenon is not yet clearly understood and requires further investigation.
6.1
Future Work: Functionalizing Liposomes
The successful formation of liposome and encapsulation of compound was demonstrated with this technique. Future work will focus on two topics; (a) entrap medically relevant drugs into liposomes with MHF and conduct cell-uptake studies of these liposomes in vitro as well as with animal studies, (b) reconstitute membrane proteins into the lipid bilayer during the lipid self-assembly process with MHF. Membrane proteins are key factors in many vital functions of the cell and their investigation is essential to understanding their ligand and signaling pathways which are fundamental for a wide spectrum of physiological processes. The goal of the second project is to develop a microfluidic method for the screening of membrane protein inhibitors in a solution-based format. As an example of this screening of inhibitors of the cell surface receptor CD47 is envisioned. CD47 will be reconstituted into liposomes created by the MHF technique47,48. One of CD47 natural ligands is thrombospondin 1 (TSP-1); currently known as the only protein-ligand relationship that blocks physiologic nitric oxide (NO) signaling.98 The control of the 105
regulatory function of TSP-1 on NO signaling is of paramount importance for the recovery from ischemic injuries and to overcome a deficit NO-responsiveness in aging.98 Microfluidically engineered liposomes carrying the reconstituted CD47 will be exposed to potential blocking agents; as the agent interacts with CD47 it will prevent the interaction of CD47 (and the liposomes attached to it) with a surface bound CD47 agonist of a liposome binding assay.99 Currently, screening of potential therapeutic agents that block NO-signaling via CD47 is accomplished with cell culture assays100 which lack efficiency and consistency, often cause false positives, are very elaborate, and add complexity because of the variable and somewhat uncontrolled nature of primary vascular cells. Engineered liposomes that have a controlled size, a high concentration of encapsulated marker, and that only display the membrane receptors for a specific application would provide a sufficient and simplified cellular mimic for a microfluidic binding assay. The continuous-flow microfluidic chip shown in Figure 40 will be produced in low-fluorescence cyclic olefin copolymer (COC). COC is a halogen-free, high purity plastic that is known to be useful in diagnostic and medical devices.101 Precision micromilling of COC allows rapidly designing and optimizing a microchannel layout. Exposure of the COC microchannel network to O3 allows it to easily bond to a glass microscope slide patterned with several molecules including CD47 blocking antibodies, TSP-1, or signal-regulatory protein α (SIRPα).102
106
a)
b)
c)
Figure 40 (a) Schematic of a microfluidic immunoassay that combines liposome formation,
liposome
functionalization
with
membrane
bound
proteins,
immobilization of the liposomes to a specific target printed on a glass microscope slide, and fluorescent evaluation of fluorescent laden liposomes immobilized to its therapeutic agent. (b) Bottom view through the microscope slide of the assembled COC microchannel. (c) Cross section view along the symmetry line, showing the lower channel height in the immobilization chamber.
Two continuous-flow microfluidic methods are proposed to functionalize liposomes with CD47. CD47 is reconstituted either into preformed liposomes (two step process) or reconstituted during the lipid self-assembly into liposomes (one step process). The inhibition of CD47 is addressed by producing fluorescent/biotinylated liposomes from a lipid blend and reconstitute purified CD47 (readily available through the laboratory of Dr. David Roberts at NCI, NIH, Bethesda, Maryland)100 in the lipid membrane. A schematic of the functionalized liposome containing either entrapped SRB or membrane intercalated biotin is shown in Figure 41.
107
Figure 41 Liposome with reconstituted CD47 and encapsulated fluorophores (SRB) for fluorescent readout. (c) Liposome-CD47 complex with biotinylated lipids to which a horseradish peroxidase-streptavidin complex can be attached for a subsequent colorimetric readout.
In the two step process fluorescent liposomes with controlled average diameters from 50 nm to 150 nm are formed separately in a continuous-flow microfluidic device as previously demonstrated47,48 and injected into the two inner side channels at the star-like intersection of the flow focusing device shown in Figure 40. Secondly, phosphate buffered saline (PBS) containing soluble CD47 and a low concentration of a mild detergent (to prevent the aggregation of CD47), n-octyl-Dglucopyranoside (OG) is injected into the center channel and sheathed between the two adjacent buffer streams containing fluorescent liposomes. 108
Alternatively, CD47 is
solubilized in the outer sheath-flow and the liposomes are injected into the center stream. The narrow streamwidth in both scenarios rapidly dilutes OG into the surrounding buffer solutions, similar to the detergent dialysis methods, originally developed for the reconstitution of membrane proteins with OG103, to achieve subsequent intercalation of CD47 into the lipid membrane. In the one step procedure a lipid tincture is injected into the center channel of the flow-focusing device and PBS containing soluble CD47 and a low concentration of OG is injected adjacent to the center lipid stream. CD47 reconstitution into the liposomes occurs during the lipid self-assembly process and can be optimized by either injecting PBS containing CD47 into the inner or the outer two side channels of the microfluidic device shown in Figure 40. Incorporation of CD47 into the lipid membrane and determination of the binding constant will be evaluated with epi-fluorescence microscopy or colorimetrically as liposomes bind to surface tethered CD47 antibodies, TSP-1, SIRPα, or agonist peptides, i.e., 7N3 or 4N1K104,105. A liposome binding assay will be used to optimize the process parameters for the reconstitution of CD47 into liposomes with microfluidics. For the colorimetric readout of the liposomes binding assay the lipid blend contains a low molar fraction of biotinylated lipids which are incorporated into the liposome during the lipid selfassembly process. CD47 antibodies, TSP-1, or SIRPα are adsorbed to a commercially available polystyrene microtiter plate according to standard protocols. The surface is then treated with (i) liposomes functionalized with CD47 and biotin that bind to the surface adsorbed proteins of interest and unbound liposomes are washed away; and (ii) a
109
solution containing the peroxidase-streptavidin complex. After the unbound enzymecomplex is washed away substrate is added to the wells. The product formation can be monitored colorimetrically. For the fluorescent readout SRB dissolved in PBS will be encapsulated into the aqueous interior of the liposome. Highly fluorescent functionalized liposomes are suitable for future highthroughput screening of NO-signaling blocking agents in the volume-limited microfluidic domain where binding events will be evaluated with epifluorescent microscopy. Once the optimal parameters to reconstitute CD47 are developed the liposome-CD47 complex will be tested against a therapeutic agent to determine its functionality. This will be achieved with a liposome binding assay in which TPS-1, SIRPα, or CD47 antibodies are tethered to the surface of a polystyrene titer plate and functionalized liposomes as well as the therapeutic agent are added.
110
Appendix A Gel Permeation Chromatography
Gel permeation chromatography is a method that allows separating molecules of different dimension based in their relative abilities to penetrate into a suitable stationary gel matrix. The stationary matrix consists of very small, uncharged porous particles and is packed into a column. Based on the pore size of the stationary phase different levels of separation can be achieved.
In the context of this dissertation gel permeation
chromatography is used to separate non-encapsulated fluorescent dye molecules from a sample containing vesicles with encapsulated dye. A mixture sample containing nonencapsulated fluorophores and vesicles with encapsulated fluorophores are added to the top of a column.
As the mixture passes through the column the much smaller
fluorophores penetrate into the porous gel beads and follow a convoluted pass through the bead while the larger vesicles remain in the mobile solvent phase and hence elute faster than the fluorophores. Figure 42 shows a cartoon of the separation process where the larger particles elute faster compared to the small fluorophores that are slowed down by their convoluted pass through the porous beads. The technical grade fluorophore sulforhodamine B (SRB) (Sigma Aldrich) with a molecular weight of 580.6 g/mol is separated from the vesicles through a 5 mL polyacrylamide column with an exclusion limit for globular proteins of 6 kDa MWCO (Pierce, Rockford, IL, USA). The polyacrylamide column has a void volume of 1.75 mL and a wet bead diameter of 90 µm to 180 µm. The columns are flushed with 60 mL (at least 5 column volumes) of PBS at a flow rate of 150 µL/min to equilibrate the column. To obtain an optimal sample separation the sample size should not exceed 10 % of the 111
column volume. A sample of 500 µL is collected from the outlet of the microfluidic network and subsequently filtered through the polyacrylamide column. 2mL of prefiltered PBS solution (PBS is filtered with a 0.2 µm filter) is added to the column after the 500 µL of sample has entered the gel. The initial 500 µL effluent is discarded as waste because it will not contain any vesicles since the column size has a volume of 1.75 mL of which 500 µL are sample. This approach reduces the dilution of the sample after gel permeation chromatography. The remaining 1.5 mL is collected in black 1.5 mL volume centrifugation tubes (Daigger, Vernon Hills, IL, USA) to prevent photobleaching of SRB by ambient light. After the separation is completed the columns are equilibrated with 60 mL of PBS to separate subsequent samples.
Figure 42 Schematic of the separation of a mixture of fluorophores and vesicles with encapsulated fluorophores based on their size.
112
Lightscattering
A variety of measurement methods exist to determine the average vesicle size. While the repertoire of methods is manifold, only few accurate and convenient methods that do not require assumptions about the fundamental nature of the particle size distributions are available. Transmission Electron microscopy (TEM) (e.g., cryo- and freeze fracture-TEM), sedimentation field-flow fractionation, nuclear magnetic resonance (NMR) spectroscopy, and static and dynamic light scattering are among these methods. TEM can introduce artifacts and is destructive of the liposome sample whereas sedimentation field-flow fractionation requires a complex centrifugation apparatus. Size exclusion chromatographic methods require column calibrations, often standards whose molecular weight values have been previously measured with light scattering.74 Nondestructive methods based on dynamic light scattering and NMR can yield accurate average vesicles sizes but require user input of the size distribution functional form. The lack of complete understanding of the vesicle size distribution shape that results from various synthesis methods does not allow to measure the vesicle size distribution unambiguously with DLS or NMR.106
However, combining a separation method,
asymmetric flow field-flow fraction (AF4) with continuous-flow multi-angle laser light scattering (MALLS), provides a convenient non-destructive method for measuring absolute vesicle size distributions without any prior assumptions about the nature of the distribution function form. A great advantage of light scattering over other technologies for particle size analysis such as optical and electron microscopy, sedimentation, centrifugation, filtration, diffusion, size exclusion chromatography is that the system under study can be observed in situ without significant perturbations. The theory permits reduction of the data directly 113
to the final result without the need of secondary calibration schemes as often required in size exclusion chromatography. The measurements are almost instantaneous and can be recorded continuously so that rate processes may be followed.107 Particle analysis by light scattering requires that the particles are randomly positioned in space and hence the system must be sufficiently dilute. The result of this dilution is that the scattering of an array of particles is incoherent, meaning that the phase shift of the scattered light by the particles is random and the scattering intensities are simply added. This assumption allows using the scattering function or form factor corresponding to an isolated particle.
Quasi-Elastic Light Scattering Quasi-elastic light scattering (QELS), also known as dynamic light scattering, is a method to determine the average radius of a sample of vesicles in solution. In QELS rapid time-intensity fluctuation in the scattered light by the suspended vesicles are analyzed, which are a result of the Brownian motion of the vesicles in solution. The rate of the time-intensity fluctuations is directly related to the translational diffusion coefficient of the vesicles. Figure 43 shows schematically that the rate of the timeintensity fluctuations is inversely proportional to the vesicles size, in that smaller vesicles produce higher time intensity fluctuations and vice versa. While the analysis of QELS data is straightforward for monodisperse samples, it becomes more complicated for unfractionated polydisperse samples. Major limitations of QELS are its sensitivity to large vesicles in the dispersion and that it requires a priori assumptions of the size distribution of the vesicles in the sample.108 It has been demonstrated by Wong et al., that if a dispersion containing 10 % or more of larger vesicles of a mixture of 20 nm and
114
90 nm diameter vesicles, the size detected by QELS is that of the larger 90 nm vesicles.109
Due to successive improvements of computational analysis of intensity
fluctuations, a priori assumption of the vesicle diameter distribution are not required anymore. However, the results remain still biased in favor of the larger vesicles in a polydisperse sample.108 The size determined with QELS is therefore most meaningful if the sample is either monodisperse or fractionated according to the vesicle size before the measurement.
Figure 43 Schematic graphs of the light intensity fluctuations of 40 nm (a) and 4 nm (b) diameter vesicles in water showing the higher intensity fluctuation rate for the smaller vesicles. The graphs in (c) and (d) schematically show the respective autocorrelation function on a log time scale from which the diffusion coefficient can be derived.
115
The result of a QELS measurement is a second order correlation function g (τ ) =
I (t ) ⋅ I (t + τ ) I (t )
2
,
(6.1)
where I(t) is the scattered light intensity at a time t, and the brackets indicate averaging over all t. The correlation function g(τ) embodies all the information regarding the diffusion of vesicles within the sample being measured. It depends on the delay time τ, which is the amount that a duplicate intensity trace is shifted from the original before the averaging is performed.
Fitting eq. 6.1 to an exponential decay function allows
extracting the diffusion coefficient g (τ ) = β + α ⋅ e − 2q
2 ⋅ D ⋅τ
,
(6.2)
where β is the baseline of g(τ) at infinite delay, α is the correlation function amplitude at zero delay τ, D is the diffusion coefficient of the vesicles, and q is the scattering vector q=
4π ⋅ n0
λ0
⎛θ ⎞ sin ⎜ ⎟ ⎝2⎠
(6.3)
where n0 is the refractive index of the solvent, λ0 is the vacuum wavelength of the incident light, and θ is the scattering angle. A schematic representation of the autocorrelation function of a scattering intensity fluctuation is shown in Figure 40 where smaller particles have a shorter diffusion time and vice versa. The hydrodynamic radius Rh for a diffusing sphere is then interpreted from the diffusion constant D via the StokeEinstein equation Rh =
kB ⋅ T 6π ⋅ η ⋅ D
,
(6.4)
where kB is the Boltzman constant, T is the temperature, and η is the dynamic viscosity.
116
The integrated on-line WyattQELS instrument (Wyatt Technology, Inc., Santa Barbara, CA) applied in the continuous-flow system allows determining the hydrodynamic radii of vesicles ranging from 2 nm to 30 nm. The upper limitation of the hydrodynamic radius to 30 nm is due to the short residence time of the particles in the observation volume as they flow through the flow cell. While smaller particles below 2 nm generate a highly fluctuating intensity profile that can be auto-correlated within the short residence time in the observation volume, larger particles do not produce intensity fluctuation long enough to properly fit an autocorrelation function. Figure 44 shows the schematic of the QELS arrangement. The sample flows at a defined velocity through the bore of the flow cell. The laser is aligned such that the incident laser light passes through the same bore.
The hydrodynamic radius is derived from the scattered laser light
intensity fluctuations of the vesicle and is detected at a user-defined angle.
Figure 44 Schematic of the QELS detection configuration.
117
Multi-angle Laser Light Scattering Multi-angle Laser light scattering (MALLS) is also known as static light scattering (SLS) and allows the determination of the size, shape, mass, and vesiclesolvent interaction of vesicles in solution. Instead of measuring the scattered lightintensity fluctuation rates as in QELS, MALLS measures the angular excess Rayleigh ratio of the laser light scattered from a dilute suspension of vesicles. The angular dependence of the excess Rayleigh ratio scattered by particles smaller than the wavelength of the incident light is described by the Rayleigh-Gans-Debye (RGD) approximation.74 An expression for the vesicle size distribution can be derived from the expression of Zimm (1948) based on the fluctuation theory of light scattering110, R(θ ) = K ⋅ M v ⋅ cv ⋅ P(θ ) ⋅ [1 − 2 ⋅ A2 ⋅ M v ⋅ cv ⋅ P(θ )] ,
(6.5)
where R(θ) is the excess Rayleigh scattering (excess of scattered light intensity of the molecular solution above that scattered by the solvent itself), θ is the detector angle, Mv is the vesicle molecular weight, P(θ) is the vesicle scattering function (it relates the vesicle size and shape to the angular dependence of scattered light intensity), cv is the vesicle concentration, A2 is the second virial coefficient (it is a measure of the solute-solvent interaction), and K* is a scattering coefficient for vertically polarized laser light, K* =
4 ⋅ π 2 ⋅ n02 ⎛ dn ⎞ ⋅⎜ ⎟ N A ⋅ λ20 ⎝ dc ⎠
2
.
(6.6)
In eq. 6.6, dn/dc is the differential refractive index increment with respect to a change in vesicle concentration, n0 is the refractive index of the solvent, NA is Avogadro’s number, and λ0 is the vacuum laser wavelength.
118
The RGD approximation embodies the two basic principles of light scattering; (a) the intensity of light scattered is directly proportional to the product of the vesicle molecular weight and the vesicle concentration, ⎛ dn ⎞ I scattered ∝ M ⋅ c ⋅ ⎜ ⎟ ⎝ dc ⎠
2
,
(6.7)
and (b) the angular variation of the scattered light is directly related to the size of the molecule. The measurable quantity of light is the intensity (I), which is proportional to the square of the electric field amplitude (E), i.e., I∝|E|2. This RGD approximation is only valid if the incident wave remains essentially unaffected by the scattering molecule. This includes two important conditions: 1.
The scattering molecule must be effectively indistinguishable from the refractive
index of the solvent m − 1


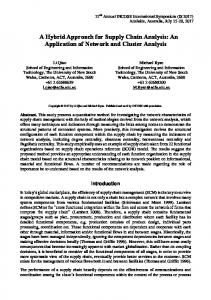


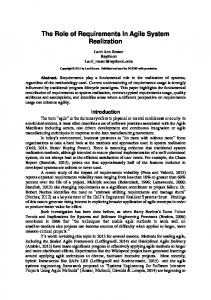


![New template instructions - National Grid [PDF]](https://m.moam.info/img/260x300/new-template-instructions-national-grid-pdf_6479ae66098a9ef16d8b45f9.jpg)


