Computing and Informatics, Vol. 28, 2009, 763–779
TEMPORAL CHANGES IN LOCAL TOPOLOGY OF AN EMAIL-BASED SOCIAL NETWORK Krzysztof Juszczyszyn, Katarzyna Musial Przemyslaw Kazienko Institute of Computer Science Wroclaw University of Technology Wybrzeze S. Wyspianskiego 27 50–370, Wroclaw, Poland e-mail: {krzysztof, katarzyna.musial, kazienko}@pwr.wroc.pl
Bogdan Gabrys Computational Intelligence Research Group Bournemouth University BH12 5BB, Poole, United Kingdom e-mail:
[email protected]
Revised manuscript received 19 January 2009
Abstract. The dynamics of complex social networks has become one of the research areas of growing importance. The knowledge about temporal changes of the network topology and characteristics is crucial in networked communication systems in which accurate predictions are important.The local network topology can be described by the means of network motifs which are small subgraphs – usually containing from 3 to 7 nodes. They were shown to be useful for creating profiles that reveal several properties of the network. In this paper, the time-varying characteristics of social networks, such as the number of nodes and edges as well as clustering coefficients and different centrality measures are investigated. At the same time, the analysis of three-node motifs (triads) was used to track the temporal changes in the structure of a large social network derived from e-mail communication between university employees. We have shown that temporal changes in local connection patterns of the social network are indeed correlated with the changes in the clustering coefficient as well as various centrality measures values and are detectable by means of motifs
764
K. Juszczyszyn, K. Musial, P. Kazienko, B. Gabrys analysis. Together with robust sampling network motifs can provide an appealing way to monitor and assess temporal changes in large social networks. Keywords: Network motifs, dynamics analysis, social networks, clustering coefficients, betweenness centrality
1 INTRODUCTION Communication technologies, especially based on Web services, enabled the emergence of complex, evolving social networks. Among the most popular and ubiquitous are networks that are built on the basis of the most common communication service – an e-mail. Other examples of popular web services used for this purpose include P2P, blogosphere and various types of community portals. In general they resemble traditional social networks based on relations between humans, but there are also significant differences. Firstly, the information about the users in virtual communities and their activities is stored in electronic form which allows precise inference of the network structure and parameters. Secondly, the networks created by means of communication technologies are highly dynamic and huge structures. When investigating the topological properties and structure of complex networks we must face a number of complexity-related problems. In large social networks, tasks like evaluating the centrality measures, finding cliques, etc. require significant computing overhead and are inherently connected with a level of uncertainty – it is not easy to gather information about the overall network structure. In result the methods which proved to be useful for small and medium sized networks fail when applied to the huge structures. In this work we present the results of the analysis of local topology of large e-mail based organizational social network. The investigated e-mail network of the Wroclaw University of Technology (WUT), consisting of over 4 000 nodes (i.e. e-mail addresses of the users) was generated on the basis of server logs from the period from February 2006 to September 2007. We detected periodic changes in the network structure which appear to be connected with the business profile of the organization (university). In the series of experiments the global features of the network (clustering coefficients, centrality, the number of edges) were checked for correlations with the distribution of small network subgraphs, called network motifs. Dependencies between global network characteristics and the distribution of local topology features may have numerous applications. They can help estimate the measures like centrality and clustering without complete knowledge of the network structure. Moreover, the motif sampling algorithms are based only on the close neighborhood of a given node, hence the knowledge of entire network topology is not required. This feature appears to be very appealing especially when one has to deal with evolving networks consisting of millions of nodes (like social networks of mobile phone users, large Web communities and so on).
Temporal Changes in Local Topology of an Email-Based Social Network
765
The rest of the paper is structured as follows. First, in Section 2 the work that has been already done in the field of network motifs is presented. After that in Section 3 the characteristics such as clustering coefficients and betweenness centrality and their changes in time for WUT social networks are investigated. Section 4 briefly presents former results obtained for the social network of WUT. Section 5 gives the results of temporal analysis, while Section 6 provides the analysis of the correlation of clustering coefficients and betweenness centrality with the motifs distribution in the network. Finally, Section 7 summarizes the work and discusses future research steps. 2 RELATED WORK 2.1 Social Networks The variety of eletronic means of communication and many possible areas where social networks (FigureSN ) can be applied, have contributed to the recent popularity. The concept of SN is utilized to describe the relationships between friends, co-workers, members of the particular society, relatives in the family, etc. Not only can the character of the relationships be analyzed, but also their strength and direction. Although social network analysis (SNA) emphasizes the connections between people, the results of SNA provide also much information about individuals themselves. The person who built the modern social network theory was Stanley Milgram [15]. He studied the small-world problem, which states that even if persons x and y do not know each other directly, they can share a mutual relationship, that is a person who knows both of these people [15, 21]. Since then social networks have become one of the research areas where scientists from different fields are looking for inspiration. The SNA supported by computer science gives the opportunity to develop other branches of knowledge. The main idea of a social network is simple. It is the set of actors, i.e. a group of people or organizations, which are the nodes of the network, and ties that link the nodes [1] by one or more relations [7]. SN indicates the ways in which actors are related. The tie between actors can be maintained according to either one or several relations [7]. The nodes of the social network are not independent beings. None of SNA methods samples the individuals independently. The actors are connected via relationships, which are characterized by content, direction and strength [7]. The content indicates the resource that is exchanged, e.g. in e-mail communication the e-mail itself can be treated as the resource. The direction determines if the relationship is directed or undirected. The last one of the enumerated characteristics of the relationship is its strength. There are many ways to determine whether a relationship is strong or weak [16], e.g. one can specify the frequency with which actors communicate with each other, the importance of exchanged information, and the amount of social capital sent from one actor to another [7]. Several examples of social networks
766
K. Juszczyszyn, K. Musial, P. Kazienko, B. Gabrys
can be enumerated: a community of scientists in the given discipline who collaborate and write joint scientific papers, corporate partnership networks, a set of business leaders who cooperate with one other, friendship network of students, company director networks, etc. The social networks of internet users somewhat differ from the regular ones. Although social networks in the Internet have already been studied in many contexts and many definitions have been created, they are not consistent. Also, different researchers name these networks differently. In consequence, these networks are called: computer-supported social networks (CSSN ) [23], online social networks [7], web communities [9, 8], or virtual communities [1]. In the literature, the name web communities was first used to describe a set of web pages that deal with the same topic [9, 8]. Adamic and Adar [2] argue that a web page must be related to a physical individual in order to be treated as a node in the online social network. Thus, they analyze the links between users homepages and form a virtual community based on this data. Additionally, the equivalent social network can also be created from an e-mail communication system [1]. On the other hand, a computer-supported social network introduced in [7, 23] appears when a computer network connects people or organizations. Nowadays, based on the kind of service people use, many examples of the social networks in the Internet can be found. The most commonly known ones include: a set of people who date using an online dating system [4], a group of people who are linked to one another by hyperlinks on their homepages [1], the company staff that communicates with one another via e-mail [2], people who share information by utilizing shared bookmarking systems [18] such as del.icio.us. 2.2 Network Motifs A biased distribution of local network structures, a.k.a. network motifs is widely observed in complex biological or technology-based networks. The analysis of both biological and engineered networks with respect to such network motifs was first presented in [19]. The motifs are small (consisting usually of 3 to 7 nodes) subgraphs that occur in the given network far more (or less) often than in the equivalent (in terms of the number of nodes and edges) random networks. Despite all structural and statistical similarities, networks from different fields have very different local topological structure. It was shown recently that concentration of network motifs may help distinguish and classify complex biological, technological and social networks. We can define so-called superfamilies of networks [17], which correspond to the specific significance profiles (SPs). To create an SP for a given network, the concentration of individual motifs is measured and compared to their concentration in a number of random networks. The statistical significance of motif M is usually defined by its Z-score measure ZM in the following way: ZM =
nM − hnrand M i rand σM
(1)
Temporal Changes in Local Topology of an Email-Based Social Network
767
where: • nM is the frequency of motif M in the given network, rand • hnrand are the mean and standard deviations of M ’s occurrences in M i and σM the set of random networks, respectively [3].
Most algorithms for detecting network motifs assume exhaustive search of all subgraphs with a given number of nodes in the network. Their computational cost dramatically increases with the network size. However, it was recently shown that it is possible to use random sampling in order to effectively estimate concentrations of network motifs. The algorithm presented in [12] is asymptotically independent of the network size and enables fast detection of motifs in very large networks with hundreds of thousands of nodes and larger. The existence of network motifs affects not only topological but also functional properties of the network. For biological networks, it was suggested that network motifs play key information processing roles [20]. For example, the so-called FFL motif – Feed-Forward Loop (motif No. 5 in Figure 5) has been shown both theoretically and experimentally to perform tasks like sign-sensitive filtering, response acceleration and pulse-generation [13]. Such results reveal that, in general, we may draw conclusions about function and properties of very large networks from their small, basic building blocks [14]. In another work, motif analysis was effectively used for fast detection of the small-world and clustering properties of the large network [5]. The results open promising but still unexplored possibilities of reasoning about networks global properties with sampling of local topological structures. Very little research has been carried out on motifs in computer science and sociology and even less so with regard to the analysis of large social networks. SPs for small social networks (< 100 nodes) were studied in [17]. A web network counting 3.5 × 10⁵ nodes [3] was used to show the usability of sampling algorithm [12]. In order to find out the advantages and limitations of motif analysis for something larger than just a toy example, in this paper network motifs were used to track temporal changes in the local structure of large e-mail-based social network of the Wroclaw University of Technology (WUT). The local structure of this network, consisting of over 4 000 nodes and 20 000 edges, has been investigated by analyzing three node motifs (triads). 3 CHARACTERISTICS OF WUT SOCIAL NETWORK First, the data cleansing process on the logs from the Wroclaw University of Technology (WUT) mail server was executed. The bad e-mail addresses were removed from the analysis and the duplicates were unified. WUT social network consists of nodes and relations between these nodes. The e-mail addresses are the nodes of this network and the relationship between two nodes exists if and only if there is any e-mail communication between them. In order to tract the temporal changes in the
768
K. Juszczyszyn, K. Musial, P. Kazienko, B. Gabrys
considered network the information from the logs was extracted for every month in the period of February 2006–September 2007 separately. This allowed us to create 20 networks reflecting the structure of organizational communication between the WUT employees. This network was used for motifs detection in order to check how the motif SP changes when different periods of time are considered. The size of the networks varied from 3 257 to 4 465 nodes, reflecting the fact that various numbers of employees were active in different months.
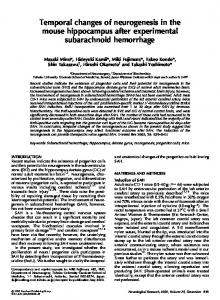
Fig. 1. Temporal changes in the size of WUT e-mail network
Figure 1 shows that the changes in network size are periodic. This effect is connected with the general business profile of the WUT employees’ activities. Obviously – August (months No. 7 – 3 257 nodes and 19 – 2 905 nodes in Figure 1), as a peak of summer holiday season, may be associated with minimal communication activity of the university personnel. This is reflected in small decrease in the number of active e-mail users (network nodes) and rapid drop in the number of network edges – 7 941 edges in August 2006 and 7 555 edges in August 2007 (which stand for incoming/outcoming messages). Similar effect (although less in size) is typical also for July and September, when the holidays start and end, respectively. The short winter university holidays (two weeks in the middle of February) are not so clearly visible but, as we will see below, are detectable with the motif analysis. Along with the size of the network (measured as the number of nodes and edges), three more structural measures were computed: two clustering coefficients (CC1 – Equation (2), CC2 – Equation (3)) and the betweenness centrality. The clustering coefficients were defined in the following way: CC1 =
2 · |E(G1(n)| deg(n) · (deg(n) − 1)
(2)
Temporal Changes in Local Topology of an Email-Based Social Network
CC2 =
|E(G1(n)| |E(G2(n)|
769 (3)
where: • deg(n) – a degree of node n, i.e. the number of its adjacent edges, • |E(G1(n))| – total number of edges among nodes in 1-neighborhood of node n, • |E(G2(n))| – total number of edges among nodes in 1 and 2-neighborhood of node n. The two coefficients considering 1- and 2-neighborhood are given by Equations (2) and (3). We also assume that for a node n such that deg(n) ≤ 1 all clustering coefficients are 0. Betweenness centrality was defined in standard way (according to [22]) as a measure which returns for a given node n the medium mediating between all pairs of nodes. Figure 2 presents the changes in the values of CC1 and the network betweenness centrality. We may note that two moments of the most significant changes in the network structure (months No. 7 and 19) are visible in the values of CC1, while fluctuations of betweenness are random-like and their interpretation is not straightforward.
Fig. 2. Average network clustering coefficient CC1 and betweenness centrality
The temporal characteristic of CC2 (which takes into account the density of the 2-neighbourhood of a given node) is shown in Figure 3. We can see that the two minima clearly denote August – the peak of summer holidays, associated with rapidly fading communication between the employees of WUT. Moreover, the next two smallest values (for February 2006 and February 2007) point to the two-week winter holidays (also: the end of winter semester in the university). FigureCC1,
770
K. Juszczyszyn, K. Musial, P. Kazienko, B. Gabrys
Fig. 3. Average clustering coefficient FigureCC2
FigureCC2 and the betweenness centrality will be used in Section 6 to check for possible correlations with the motif distribution in the network. Investigation of the local network topology with motif analysis, presented recently in [11], have shown that the above-mentioned periodic activity changes affect not only the scale but also the structure of communication. The distribution of motifs detected in [11] (triads consisting of three network nodes and up to six directed edges) proved that holiday seasons are associated with lack of the broadcast-type communication. Also, the users forming densely connected cliques tend to sustain their communication during holidays which was reflected by the large number of occurrences of fully connected triads in the investigated network. In particular – three triads (motifs) were identified as good candidates for tracking changes in large, evolving networks. They are presented in Figure 4.
Fig. 4. Network motifs sensitive to structural changes in an e-mail network [11]
The Z-scores of these three motifs were visibly changing (with the highest variance) according to periodic structural changes in the network. In result, for the further experiments, we chose to investigate the behavior of fully connected subgraphs (like T3 in Figure 4) along with those reflecting broadcast type communication directed towards targets which are not connected (like T1 and T2). Note that they may be also associated with the existence of weak links and connections between cliques. Additionally in order to follow the conclusions from these first experiments
Temporal Changes in Local Topology of an Email-Based Social Network
771
we assumed that the distribution of the four-node subgraphs (quadruples) will be investigated, because they better reflect the nature of dense cliques and connections between them. This will be discussed in detail in the next section. 4 MOTIF ANALYSIS APPLIED TO LARGE SOCIAL NETWORK To discover properties of large social networks using the motif analysis, some robust data pre-processing and estimating of important parameters have to be carefully taken into account. The key parameter that reflects the significance of motifs is Z-score (see Equation (1)). It is based on comparing the recent quantity of subgraphs (network motifs) in the considered network with their concentration in a set of random networks. For computational complexity reasons, the size of the random network set should be as small as possible. For example, our previous research has revealed that 100 random networks provide sufficient accuracy of calculations in the case of the WUT social network [10]. The actual profile of the network is expressed by the set of Z-scores of the motifs. In our experiments, we checked all the directed three-node subgraphs (triads). Their concentration values for all triads form the so-called Triad Significance Profile of the network (TSP) [17]. All experiments were performed with FANMOD tool [24, 25] designed for motif detection in large networks. There are 13 different motifs that consist of three nodes (Figure 5). Their IDs = 1, 2, . . . , 13 are used in further descriptions interchangeably with the corresponding abbreviations M1, M2,. . . , M13.
Fig. 5. Directed triads and their IDs
The research results reported in [10] confirmed the typical property of social networks – the small-world phenomenon. Loosely connected motifs with only 2 edges, like M2, M3, M4, M7, M10 occur less frequently in comparison to the random networks which corresponds to their negative Z-score. Triads with edges between any of the three nodes have typically positive (and large) Z-scores. It obviously signifies the high clustering level, i.e. high probability that two neighboring nodes have connected neighbors. The only exception is M1 which is present relatively often in the analyzed network. This reflects a specific property of the e-mail-based social networks which consist of relatively many broadcasting nodes (e-mail addresses) that
772
K. Juszczyszyn, K. Musial, P. Kazienko, B. Gabrys
are used for sending general messages (news, announcements, bulletins) but which are never responded to in return. 5 TEMPORAL TSP The next stage of experiments was conducted to tract the temporal changes in the local network structure. This was performed by using a time index and creating a set of separate TSPs for each month in the period of February 2006–September 2007 further on referred to as month No. 1 up to 20. The results in the form of 3D chart are presented in Figure 6. As we may see the general shape of the TSP remains constant over the entire period and conforms to the networks static properties described in Section 2. However, there are also some visible differences between consecutive months. To distinguish the motifs, which are most valuable for detecting changes in TSP of the network, the variance of their Z-scores was computed. The best candidates, due to their maximal variance, appeared to be M1 and M13. Other interesting motifs, like M4 and M7, will be discussed below.
Fig. 6. TSP changes in the WUT social network during the 20-month period
In Figure 7 the changes in the Z-score of M1 and M13 are presented in detail. It can be noticed that the maximum values (which correspond to the strong, i.e. above average, occurrences of subgraphs M1 and M13) were detected for March 2006 (month No. 2) and February 2007 (month No. 13) for M1, and for August 2006 (No. 6) and 2007 (No. 19) for M13, respectively. This effect is correlated with the general business profile of the activities of the WUT employees. Obviously – August, as the peak of holiday season may be associated with minimal communica-
Temporal Changes in Local Topology of an Email-Based Social Network
773
Fig. 7. The changes in Z-score of selected motifs
tion activity. Correspondingly, February–March period is where winter and summer semesters meet, which results in mass communication especially of the broadcast type – reports, announcements, etc. In order to confirm this interpretation, the analysis of the intensity of communication in the network was studied. Since we analyze the topology of the network, the number of directed edges in the communication graph was assumed to be the measure of communication intensity. The numbers of edges for consecutive periods are presented in Figure 8.
Fig. 8. The number of edges in the network
Note that the activity of WUT employees dramatically decreases during holiday season, but not all types of communication are affected to the same extent. Holiday months (July–September) are characterized by relatively big (clearly bigger than
774
K. Juszczyszyn, K. Musial, P. Kazienko, B. Gabrys
these of M1) Z-scores of M13. For M13 – a fully connected triad – it means that bidirectional communication in dense cliques is sustained regardless of (proportionally equal to and exceeding 50 %) a decrease in the number of both unidirectional and bi-directional graph edges. On the other hand, unidirectional communication characterized by the above average presence of M1 (larger than or equal to M13 Z-scores) is typical for normal business operation during both academic semesters. Moreover, from the results of experiments described in [10] and concerning the same dataset (with the difference that a static graph for entire 20-month long communication period was created) we know that the Z-score of M13 exceeding that of M1 is typical for sub-networks of strong links, i.e. network edges formed only by the intense e-mail communication. It can be noticed that the activity in these links does not cease during low activity periods which is distinctive from the other weak, unidirectional ties. Another conclusion concerns an M7 motif containing a node bi-directionally communicating with the two neighbours from different cliques (Figure 7). This M7, responsible for connecting cliques, has been shown to have the minimal representation in both classic and e-mail-based social networks, with decisively the smallest Z-score [17], [10]. Due to its relatively rare occurrence the changes in the distribution of M7, though significant, would not be normally associated with significant temporal changes and the business activity of individual network participants as the links connecting groups of users remain unchanged regardless of the level of activity in the whole network. 6 CORRELATION BETWEEN FREQUENCY OF MOTIFS OCCURRENCE AND OTHER NETWORK CHARACTERISTICS Conducted analyses have shown correlation between the Z-scores of some motifs and the CC1, CC2 as well as the size of the network. Network betweenness centrality is not correlated with the distribution of motifs. In order to find linear relationship between the above mentioned structural network measures and the motifs Z-scores, the Pearson correlation coefficients were computed for all of them. The results are presented in Table 1. According to discussion presented by Cohen [6] in social and behavioral sciences the values of Pearson similarity exceeding 0.4 should be treated as significant. As we see in Table 1 Pearson correlation of the absolute value greater than 0.4 is characteristic for motifs which can be divided into three groups: • Positive correlation with the CC1, CC2 and the network size – this concerns M8, M9, M11, M12 motifs. We may note that they are all cyclic triads consisting of three connected dyads. Their statistical presence in the network grows with the values of clustering coefficients and the network size. This may suggest that in growing networks (or in the case of strenghtening group communication) the cyclic message interchange schemes become more important.
Temporal Changes in Local Topology of an Email-Based Social Network
M1 M2 M3 M4 M5 M6 M7 M8 M9 M10 M11 M12 M13
Edges
Nodes
CC1
CC2
0.36 − 0.55 −0.27 −0.40 0.40 0.24 −0.51 0.76 0.65 −0.72 0.67 0.46 −0.44
0.20 −0.36 −0.11 −0.21 0.18 0.07 −0.54 0.60 0.50 −0.59 0.53 0.46 −0.45
0.09 −0.23 0.04 0.12 0.11 −0.05 −0.33 0.49 0.33 −0.46 0.47 0.39 0.46
0.25 −0.23 −0.08 −0.29 0.23 0.04 −0.29 0.51 0.57 −0.51 0.32 −0.02 −0.23
775
Network Betweennes Centrality −0.33 −0.01 0.21 0.14 −0.14 −0.33 −0.04 0.02 0.19 0.06 −0.18 −0.19 0.17
Table 1. Correlation between frequency of motifs occurrence and other network characteristics
• Negative correlation with the CC1, CC2 and the network size – characteristic for M2, M7, M10 and M13 which are (with exception of M13) built of two connections between the triad nodes. Also (in the case of M7 and M10) the motif structure is typical for weak links connecting scheme where a node is bidirectionally connected to at least one cluster, while also bridging with the other. An interesting exceptiom is M13 – fully connected triad whose statistical significance grows in the case of fading number of communication links and clustering parameters. However, M13 is typical for cohesive groups of users who tend to sustain communication even when overall network activity is low. • No correlation – the rest of motifs, showing no correlation with the structural and quantitative network parameters, may be associated with broadcast communication (spreading never-answered messages to the receivers from different clusters) with typical representatives of this group being M1 and M4. 7 CONCLUSIONS We have shown that temporal changes in local connection patterns of the social network are correlated with changes in the intensity of communication and are detectable by means of motifs analysis. This in turn, along with the fast network sampling techniques, gives us a possibility to monitor and assess the change of the structure of a large social network without significant computational overhead. All the above described changes in the structure of the investigated e-mail-based social network are also detectable with some fast methods known in motif analysis,
776
K. Juszczyszyn, K. Musial, P. Kazienko, B. Gabrys
like sampling method proposed in [12]. This enables detecting the properties of the network with low computational overhead and minimal cost. The most important conclusions concerning temporal characteristics of the analyzed e-mail-based social organizational network, which we intend to verify for other similar organizations, are as follows: • The known changes in the all-year activity of university-type organization are detectable with the motif analysis and clearly reflected in the TSP of the network. • Communication in cliques is sustained during periods of low overall activity, the effect of which is detectable and characterized by the Z-scores of M13 prevailing over these of M1. • There is a proportionally equal decrease in the number of uni- and bi-directional edges of the network during periods of low activity. At the same time the TSP significantly changes which suggests that not all links are affected in the same way. An interesting possibility of future temporal motif analysis will be addressing relationship strengths in detail. Complementaries between results of [10] summarized in Section 3 and the temporal TSP changes suggest that further experiments may bring appealing results. REFERENCES [1] Adamic, L. A.—Adar, E.: Friends and Neighbors on the Web. Social Networks, Vol. 25, 2003, pp. 211–230. [2] Adamic, L. A.—Adar, E.: How to Search a Social Network. Social Networks, Vol. 27, 2005, pp. 187–203. [3] Barabasi, A. L.—Albert, R.: Emergence of Scaling in Random Networks. Sciences, Vol. 286, 1999, pp. 509–512. [4] Boyd, D. M.: Friendster and Publicly Articulated Social Networking. CHI 2004, ACM Press, 2004, pp. 1279–1282. [5] Chung-Yuan, H.—Chuen-Tsai, S.—Chia-Ying, C.—Ji-Lung, H.: Bridge and Brick Motifs in Complex Networks. Physica A, Vol. 377, 2007, pp. 340–350. [6] Cohen, J.—Cohen P.—West, S. G.—Aiken, L. S.: Applied Multiple Regression/Correlation Analysis for the Behavioral Sciences. (3rd ed.) Hillsdale, NJ: Lawrence Erlbaum Associates, 2003. [7] Garton, L.—Haythorntwaite, C.—Wellman, B.: Studying Online Social Networks. Journal of Computer-Mediated Communication, Vol. 3, 1997, available at http://jcmc.indiana.edu/vol3/issue1/garton.html. [8] Flake, G.—Lawrence, S.—Lee Giles, C.: Efficient Identification of Web Communities. Sixth ACM SIGKDD International Conference on Knowledge Discovery and Data Mining, 2000, pp. 150–160.
Temporal Changes in Local Topology of an Email-Based Social Network
777
[9] Gibson, D.—Kleinberg, J.—Raghavan, P.: Inferring Web Communities from Link Topology. 9th ACM Conference on Hypertext and Hypermedia, 1998. [10] Juszczyszyn, K.—Musial, K.—Kazienko, P.: Local Topology of Social Network Based on Motif Analysis. 11th International Conference on Knowledge-Based Intelligent Information & Engineering Systems, Lecture Notes in Artificial Intelligence, 2008. [11] Juszczyszyn, K.—Kazienko, P.—Musial, K.—Gabrys, B.: Temporal Changes in Connection Patterns of an Email-Based Social Network. IEEE/WIC/ACM Joint International Conference on Web Intelligence and Intelligent Agent Technology, IEEE Computer Society Press, 2008. [12] Kashtan, N.—Itzkovitz, S.—Milo, R.—Alon, U.: Efficient Sampling Algorithm for Estimating Subgraph Concentrations and Detecting Network Motifs. Bioinformatics, Vol. 20, 2004, No. 11, pp. 1746–1758. [13] Mangan, S.—Alon, U.: Structure and Function of the Feedforward Loop Network Motif. In proc. of the National Academy of Science, USA, Vol. 100, 2003, No. 21, pp. 11980–11985. [14] Mangan, S.—Zaslaver, A.—Alon, U.: The Coherent Feedforward Loop Serves As a Sign-Sensitive Delay Element in Transcription Networks. Journal of Molecular Biology, Vol. 334, 2003, pp. 197–204. [15] Milgram, S.: The Small-World Problem. Psychology Today, Vol. 2, 1967, pp. 60–67. [16] Marsden, P.—Campbell, K. E.: Measuring Tie Strength. Social Forces, Vol. 63, 1984, pp. 482–501. [17] Milo, R.—Itzkovitz, S.—Kashtan, N.—Levitt, R.—Shen-Orr, S.— Ayzenshtat, I.—Sheffer, M.—Alon, U.: Superfamilies of Evolved and Designed Networks. Science, Vol. 303, 2004, pp. 1538–1542. [18] Millen, D.—Feinberg, J.—Kerr, B.: Social Bookmarking in the Enterprise. Queue, Vol. 3, 2005. [19] Milo, R.—Shen-Orr, S.—Itzkovitz, S.—Kashtan, N.—Chklovskii, D.— Alon, U.: Network Motifs: Simple Building Blocks of Complex Networks. Science, Vol. 298, 2004, pp. 824–827. [20] Shen-Orr, S.—Milo, R.—Mangan, S.—Alon, U.: Network Motifs in the Transciptional Regualtion Network of Escherichia Coli. Nat. Genet., Vol. 31, 2002, pp. 64–68. [21] Travers, J.—Milgram, S.: An Experimental Study of the Small World Problem. Sociometry, Vol. 32, 1969, pp. 425-443. [22] Wasserman, S.—Faust, K.: Social Network Analysis: Methods and Applications. Cambridge University Press, New York, 1994. [23] Wellman, B.—Salaff, J.—Dimitrova, D.—Garton, L.—Gulia, M.— Haythornthwaite, C.: Computer Networks As Social Networks: Collaborative Work, Telework, and Virtual Community. Annual Review Sociology, Vol. 22, 1996, pp. 213–238. [24] Wernicke, S.: Efficient Detection of Network Motifs. IEEE/ACM Transactions on Computational Biology and Bioinformatics, Vol. 3, 2006, pp. 347–359.
778
K. Juszczyszyn, K. Musial, P. Kazienko, B. Gabrys
[25] Wernicke, S.—Rasche, F.: FANMOD: A Tool for Fast Network Motif Detection. Bioinformatics, Vol. 22, 2006, pp. 1152–1153.
Krzysztof Jusz zyszyn works as an Assistant Professor at the Institute of Computer Science, Wroclaw University of Technology, Poland. He also received his M. Sc. and Ph. D. degrees in computer science from this University in 1997 and 2001, respectively. He participated in a regional programme for visiting researchers at Murcia University, Spain, in 2006 and acted as an expert and reviewer in EU Framework Programmes during 2006–2008. In 2008 the served as an expert and panel secretary in the National Foresight Programme “Poland 2020”. His research concentrates on dynamic network models applied to social networks, semantic web and multi-agent systems. Katarzyna Musial is a Ph. D. student at the Institute of Computer Science, Wroclaw University of Technology. She is interested especially in social networks and social network analysis. She received her M. Sc. degree in computer science from the Wroclaw University of Technology, Poland in 2006. In the same year she received her second M. Sc. degree in software engineering from the Blekinge Institute of Technology, Sweden. She focused her Ph. D. thesis on calculation of individual’s social position in the virtual social network. She is one of the founder members of the “Social Network Group” at WUT. Since November 2005 she has been acting as a member of the Nature-inspired Data Technology (NiDT) focus group within the European Coordination Action project on Nature-inspired Smart Information Systems (NiSIS within 6FP). Przemyslaw Kazienko is an Assistant Professor at the Institute of Computer Science, Wroclaw University of Technology, Poland and also the former Deputy Director for development at the Institute of Applied Informatics, WUT. Recently, he is a research fellow at Intelligent Systems Research Centre, British Telecom, UK. He has authored over 80 scholarly and research articles on a variety of areas related to social network analysis, recommender systems, data mining, data security, knowledge management, and XML.
Temporal Changes in Local Topology of an Email-Based Social Network
779
Bogdan Gabrys received a Ph. D. in computer science from the Nottingham Trent University, UK in 1998. After many years of working at different Universities he moved to Bournemouth University in January 2003 where he acts as Director of the Smart Technology Research Centre and Head of the Computational Intelligence Research Group within the School of Design, Engineering and Computing. His current research interests include a wide range of machine learning and hybrid intelligent techniques encompassing data and information fusion, multiple classifier and prediction systems, processing and modelling of uncertainty in pattern recognition, diagnostic analysis and decision support systems. He published numerous research papers. He is a Co-Editor in Chief of the International Journal of Knowledge Based Intelligent Engineering Systems and the Chair (Academic Affairs) of the KES International Research Organisation. He recently took leading roles in large European initiatives as a co–chair of the Nature–inspired Data Technology (NiDT) focus group within the European Coordination Action project on Nature-inspired Smart Information Systems (NiSIS) or a co–chairman of the Research Theory and Development Group on Integration of Methods (RTD-IM) in the European Network on Intelligent Technologies for Smart Adaptive Systems (EUNITE).