Temporal Thresholds for Feature Detection in Flow Visualization Steve Haroz
David Whitney
[email protected] Computer Science Department - University of California at Davis
[email protected] Psychology Department - University of California at Berkeley
Introduction Optic flow is the coherent motion of a region in the visual field, and the visual system is astoundingly effective at perceiving this large-scale and complex percept. Whenever you rotate your head or move through a scene, nearly every part of your visual field moves at a different speed and velocity. For example, as you walk through a forest, the trees in the horizon appear to slowly expand, and the trees on your sides appear to rapidly move to the extremities of your vision visual field and disappear. In spite of such a myriad of local motions, all of this information is concisely summarized as moving forward. Such summary encoding of a large variety of elements makes this percept a potentially useful tool to exploit for visualization. For that reason, our goal in this study is to test the visual system’s ability to use optic flow for a basic visualization task, feature detection.
Methods Our visual search experiment was conducted on 6 subjects – 4 women and 2 men. Five were graduate students in psychology or computer science, and one was a member of the university staff. All had normal or corrected-to-normal vision. The stimuli consisted of a random dot motion display with a gray background and approximately 1000 black dots. In visualization and particle tracing terms, these dots were the glyphs which followed a flow dataset. Next to this flow visualization was a single slider which controlled the average lifespan of the dots. The dataset of each trial was a 2D flow field with two components. The main component of the flow field – the background – followed one of the following: Left, Down, Clockwise, Expansion, and Contraction. A small region – that we call “the feature” – had a different flow compared with the rest of the field. It followed one of the five flows but not necessarily the same flow as the rest of the field. It was centered in one of four quadrants and had a Gaussian envelope. To avoid a sharp boundary we made use of transparent motion. At any given location, the percent of glyphs which followed the feature vs. the main flow corresponded to the Gaussian function’s value. The Gaussian envelope therefore defined the probability that a particular dot followed the trajectory of the background motion or the feature motion. This effect would be similar to the spinning of hurricane tapering off as the distance from the eye increases.
For each trial, the subject was presented with a new flow field, and the dot lifetime was reset. We used a method of limits (ascending and descending adjustment), which allowed the subject to control the stimuli and minimized error of habituation. The dot lifetime of each trial was initialized to either 1 frame (no motion) or 30 frames (making the feature easily detectable). The subject then adjusted the dot lifetime to find the lowest value for which the feature was barely visible (just noticeable difference). To make sure that they were, in fact, finding the feature, they then selected the quadrant where the feature was located.
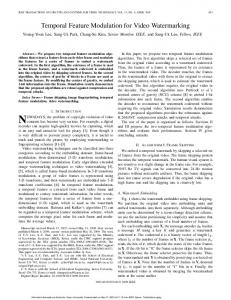
Results and Conclusion The results are summarized in figure 1 according to feature type and background type. The lifetimes are in milliseconds and are averaged across all subjects. The majority of the trials comprised features with more complex types of motion (e.g. rotation, expansion, and contraction). These results can be seen in the three rightmost columns of the results figure. Analyzing the results without averaging between subjects, we found the upper bound of the 95% confidence interval for these trials to be 73 ms. The background motion did have a significant impact (F(4,20) = 3.843, p < 0.05), but no other main effects or interactions were significant. The remaining trials either had a very low angle of incidence (and consequently had higher thresholds) or were perpendicular (and had slightly lower thresholds). Answering the core question of our study, a dot lifetime of less than one tenth of a second can effectively convey a feature defined exclusively by non-linear optic flow. Though more information is needed, this study suggests that using optic flow without computationally expensive density controllers does indeed have potential.
We enumerated every combination of main flow (5), feature flow (5), feature quadrant (4), and initial dot lifetime (2) for a total of 200 trials. We also incorporated 20 trials without any feature to keep the subjects alert. All 220 trials were ordered randomly for each subject. © ACM, 2010. This is the author's version of the work. It is posted here by permission of ACM for your personal use. Not for redistribution. The definitive version was published in APGV, 2010 http://doi.acm.org/10.1145/1836248.1836285
Figure 1 The results of each condition averaged across subject.