TEMU: Binary Code Analysis via Whole-System Layered Annotative Execution
Heng Yin Dawn Song
Electrical Engineering and Computer Sciences University of California at Berkeley Technical Report No. UCB/EECS-2010-3 http://www.eecs.berkeley.edu/Pubs/TechRpts/2010/EECS-2010-3.html
January 11, 2010
Copyright © 2010, by the author(s). All rights reserved. Permission to make digital or hard copies of all or part of this work for personal or classroom use is granted without fee provided that copies are not made or distributed for profit or commercial advantage and that copies bear this notice and the full citation on the first page. To copy otherwise, to republish, to post on servers or to redistribute to lists, requires prior specific permission.
TEMU: Binary Code Analysis via Whole-System Layered Annotative Execution Heng Yin
Dawn Song
Dept. of Electrical Eng. & Comp. Science Syracuse University Syracuse, NY 13244
Computer Science Division UC Berkeley Berkeley, CA 94720
[email protected]
[email protected]
ABSTRACT
addition, we prefer an external approach. That is, we want to perform analysis completely outside the execution environment. This out-of-the-box approach provides excellent isolation and good transparency. It makes it more difficult for malware to detect the presence of the analysis environment and interfere with analysis results. Moreover, in many cases, we need to perform deep analysis by inspecting in a fine-grained manner (i.e., at the instruction level). Finally, the analysis overhead should be acceptable. To address these challenges, we propose a new architecture for dynamic binary analysis, called whole-system outof-the-box fine-grained dynamic binary analysis. The basic idea is to run an entire operating system (including common applications) inside a whole-system emulator, and execute the binary code of interest in this emulated environment. During execution of the binary code, we monitor and analyze its behavior at the instruction level, completely from the emulator. We propose and implement a core technique, namely layered annotative execution, as a Swiss army knife, to fine-grained binary code analysis. Essentially, during the execution of each instruction in the emulated environment, depending on the instruction semantics and the analysis purpose, we can annotate certain memory locations or CPU registers or update existing annotations. This is a layered approach, because we can place extra analysis processes on top of the existing analysis to extract more insightful results. We implement the new architecture and the core technique into a generic dynamic binary analysis platform, codenamed TEMU. It is based on an open-source whole-system emulator, QEMU [2]. TEMU has been widely used for many research projects in numerous categories, as listed below:
Dynamic binary analysis has demonstrated its strength in solving a wide-spectrum of computer security problems, such as malware analysis, protocol reverse engineering, vulnerability detection, diagnosis, and defense, software testing, etc. An extensible platform for dynamic binary analysis provides a foundation for solving these problems. To enable a variety of applications, we explore a unique design space. We aim to provide a whole-system view, take an external approach, facilitate fine-grained instrumentation, and have sufficient efficiency. These design goals bring about a new architecture, namely whole-system out-of-the-box fine-grained dynamic binary analysis. To further facilitate fine-grained dynamic binary analysis, we propose layered annotative execution as a core technique, which incorporates shadow flag analysis, taint analysis, and symbolic execution. We have implemented this new architecture and the core technique in an analysis platform called TEMU. Because of its extensibility and versatility, TEMU has enabled and fostered a handful of research projects.
1.
INTRODUCTION
Dynamic binary analysis has demonstrated its strength in many research problems, such as malware analysis, protocol reverse engineering, vulnerability signature generation, software testing, profiling and performance optimization, etc. An extensible platform for dynamic binary analysis serves as a foundation for solving these problems, and therefore becomes a critical building block. In this paper, we present an extensible platform that addresses the common challenges and requirements in dynamic binary analysis, and thus greatly facilitates building various custom analysis techniques on top of it. First of all, we often need a whole-system view, including the OS kernel and all the application running on the system. Such a wholesystem view enables us to analyze the activities happening in the OS kernel (such as kernel malware and kernel vulnerabilities) and interactions between multiple processes. In
• Malware analysis. The objective of malware analysis is to automatically extract important insights of an unknown malicious program. Panorama [42] detects and analyzes a myriad of malware such as keylogger, spyware, rootkits and backdoors, which access sensitive information in abnormal ways. Renovo [24] is a generic unpacker, which extracts original code and data from packed malicious binaries. HookFinder [41] identifies hooks installed by malware and provides insightful knowledge about hooking mechanisms. BitScope [6] uncovers potentially hidden functionality of malware, and provides semantic understanding of dependencies between inputs and outputs.
Permission to make digital or hard copies of all or part of this work for personal or classroom use is granted without fee provided that copies are not made or distributed for profit or commercial advantage and that copies bear this notice and the full citation on the first page. To copy otherwise, to republish, to post on servers or to redistribute to lists, requires prior specific permission and/or a fee. Submitted to VEE ’10, Pittsburgh, PA, USA Copyright 200X ACM X-XXXXX-XX-X/XX/XX ...$5.00.
• Protocol reverse engineering. Protocol reverse engineering aims to extract the knowledge of applicationlevel protocol format and semantics directly from its 1
is observed and instrumented completely from outside. In contrast, an internal monitoring approach, taken by Valgrind [29], DynamoRIO [5], and Pin [25], places the analysis tool into the same execution environment to be analyzed. Therefore, the system state and memory layout are perturbed. The external monitoring approach provides excellent isolation and better transparency. As a result, it makes it more difficult for malware to detect the presence of the analysis environment and interfere with analysis results. OS awareness. A central challenge brought by the wholesystem view and external monitoring approach is the semantic gap. That is, we can only see the hardware-level view of the analyzed system, such as the states of cpu registers, physical memory, and IO devices. However, we need an OSlevel view to get meaningful analysis results. For example, we need to know what process is currently running and what module an instruction comes from. Therefore, we need techniques that can be used to extract the OS-level semantics from the analyzed system. Support for fine-grained analysis. Many analysis problems require fine-grained instrumentation (i.e., at instruction level) on binary code. Traditional debugging techniques (such as hardware breakpoint and single stepping) incur significant performance overhead, which is often hundreds of times slowdown or even more. Dynamic translation is a technique that translates code at runtime and caches the translated code. Consequently, dynamic translation provides a more efficient foundation for fine-grained instrumentation. Tools like Valgrind [29], DynamoRIO [5], Pin [25], and QEMU [2] take this approach to facilitate fine-grained instrumentation.
implementation. Polyglot [12] extracts the format and semantics of incoming protocol messages. Dispatcher [11] supersedes Polyglot in the following aspects: 1) dealing with encrypted messages; 2) analyzing bidirectional protocol messages; and 3) extracting more semantic information. • Vulnerability detection, diagnosis, and defense. Software vulnerabilities (e.g., buffer overflows) can be exploited by attackers to compromise millions of machines in hours or even minutes. TEMU has been used to automatically detect exploits to previously unknown vulnerabilities [32], automatically generate filters to protect vulnerable hosts [8, 31], and used to demonstrate that automatically generating exploits from security patches is possible [9]. In summary, we have made the following contributions: • We systematically study the common requirements and challenges in a wide-spectrum of security applications of dynamic binary analysis. In particular, whole-system view, external approach, and fine granularity are important for many applications. • We have proposed a new analysis architecture, wholesystem out-of-the-box fine-grained dynamic binary analysis, to address these requirements and challenges. • We have devised a core technique for fine-grained binary analysis, namely layered annotative execution, as a versatile solution for various analysis needs. • We have designed and implemented an extensible platform, TEMU, to realize this new architecture and core technique.
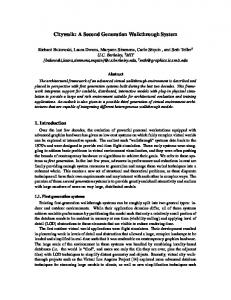
2.2 Architecture To address the above design goals, we propose a new architecture, whole-system out-of-the-box fine-grained dynamic binary analysis. The basic idea is to run an entire operating system (including common applications) inside a wholesystem emulator, execute the binary code of interest in this emulated environment, and then observe and analyze the behaviors of this binary code from the emulator. Figure 1 illustrates this new analysis architecture. This new architecture is able to address all the above design goals. First of all, such a whole-system emulator emulates a full system, including CPU, physical memory, and IO devices. Therefore, it has a complete view of the emulated execution environment. In addition, performing analysis within this whole-system emulator follows the external monitoring approach. That is, we completely observe the activities of the emulated system from outside. On one hand, this whole-system emulation approach provides excellent isolation between the emulated guest system and the emulator. On the other hand, we are aware that whole-system emulation can still be detected [19, 26, 34]. We leave this transparency issue as future work. To bridge the semantic gap, we devise a set of mechanisms that can extract the OSlevel semantics from the emulated guest system. We implement these mechanisms in the Semantic Extractor. Finally, this whole-system emulator makes use of dynamic translation techniques to emulate the guest system execution, and therefore facilitate fine-grained instrumentation. We make a key observation that many analysis techniques (such as shadow flag analysis [24], dynamic taint analysis [12, 32, 41, 42], and symbolic execution [6, 11, 30]) need to
• We have evaluated the capabilities, extensibility, and efficiency of this platform by demonstrating that we can build various tools easily on top of it to enable a suite of security applications.
2.
SYSTEM OVERVIEW
2.1 Design Goals We aim to develop an analysis platform that provides sufficient support for a wide-spectrum of analysis purposes. We have identified the following design goals, which no existing analysis frameworks have addressed systematically. Whole-system view. Having a complete view of the execution environment (including the OS kernel and all the applications) is critical for many analysis problems. Malware often infiltrates into the OS kernel, injects code into another process, and interacts with multiple processes. Zeroday worm exploits sometimes involve multiple processes and the OS kernel [15]. Without a whole-system view, we are unable to obtain a complete picture of these malicious activities. However, many analysis platforms (e.g., Valgrind [29], DynamoRIO [5], Pin [25]) only provide a local view (i.e., a view of a single user-mode process). External monitoring approach. We prefer to take an external approach versus an internal monitoring approach. In an external approach, no modification is made in the execution environment to be analyzed, and the execution 2
the process and module information during execution, we hook several kernel functions, such as do_fork and do_exec. For Windows, we do not have access to the kernel source code. Although some kernel data structures have been reverse engineered for some versions of Windows, this is not a robust way to extract OS-level semantics across different versions and service packs. Instead, we have developed a kernel module for this purpose. We load this module into the guest operating system to collect the updated memory map information. This kernel module registers two callback routines. The first callback routine is invoked whenever a process is created or deleted. The second callback routine is called whenever a new module is loaded and gathers the address range in the virtual memory that the new module occupies. In addition, the kernel module obtains the value of the CR3 register for each process. As the CR3 register contains the physical address of the page table of the current process, it is different (and unique) for each process. All the information described above is passed on to TEMU through a predefined I/O port. This is a suboptimal solution currently, in that we favor portability over transparency. We leave a better solution to this problem as future work.
Plugin 1
Guest System API
Plugin 2 Annotative Execution Engine
Semantics Extractor
Whole-System Emulator
Figure 1: Architecture of TEMU annotate a memory location or CPU register based on the semantics of the currently executed instruction, or update the existing annotations. Therefore, we propose a unified analysis technique, annotative execution, to summarize and generalize these specific techniques. Furthermore, a more advanced analysis technique can be built on top of a more basic analysis technique. For instance, dynamic taint analysis can be built on top of shadow flag analysis, and symbolic execution can be built on top of dynamic taint analysis. Therefore, this annotative execution has an inherently layered structure. We implemented this layered annotative execution in the Annotative Execution Engine. To facilitate implementing custom analysis, we have defined a clear interface between the platform and a plugin. Such an interface can hide unnecessary details from users and reuse common functionalities. We have implemented a new analysis platform, TEMU, in Linux, based on an open-source whole-system emulator, QEMU [2]. It has become the dynamic analysis component in the BitBlaze binary analysis infrastructure [4, 37]. At the time of writing, TEMU can be used to analyze binary code in Windows 2000, Windows XP, and Linux systems. We describe these three components in Section 3, 4 and 5 respectively.
3.
3.2 Thread Information We obtain the current thread ID, which is important for analyzing multi-threaded programs. In Windows, the data structure for the current thread is mapped into a well-known virtual address, so we can obtain this information directly. For Linux, we can also obtain the thread information by a similar approach. However, the current implementation of TEMU only gets thread information from Windows for now, and will support Linux in the future.
3.3 Symbol Information Given a binary module, we parse its header information in memory and extract the exported symbol names and offsets. After we obtain the locations of all modules, we can determine the absolute address of each symbol by adding the base address of the module and its offset. This feature is very useful, because all APIs in user libraries and kernel APIs are exported by their hosting modules. The symbol information conveys important semantics information, because from a function name, we are able to determine what purpose this function is used for, what input arguments it takes, and what output arguments and return value it generates. Moreover, the symbol information makes it more convenient to hook a function—instead of giving the actual address of a function, we can specify its module name and function name. Then TEMU will automatically map the actual address of the function for the user. In the current implementation, TEMU is able to parse memory images of PE and ELF binary modules, and thus supports both Windows and Linux.
SEMANTICS EXTRACTOR
The semantics extractor is responsible for extracting OSlevel semantics information of the emulated system, including process, module, thread, symbol information, and execution context. The mechanisms presented below are extensions to the technique of virtual machine introspection, which was first proposed for host intrusion detection [22] and later extended for malware detection [40].
3.1 Process and Module Information For the current execution instruction, we need to know which process, thread and module this instruction comes from. In some cases, instructions may be dynamically generated and executed on the heap. Maintaining a mapping between addresses in memory and modules requires information from the guest operating system. We use two different approaches to extract process and module information for Linux and Windows. For Linux, we can directly read process and module information from outside, because we know the relevant kernel data structures, and the addresses of relevant symbols are also exported in the system.map file. In order to maintain
3.4 Execution Context With the knowledge of processes and modules, we are able to tell which process or module performs a certain behavior directly. However, if this behavior happens in library or system code, it is actually performed on behalf of the program that invokes the functionality in system or library code. Therefore, we need to determine if a certain behavior is performed under the execution context of the program to be analyzed. 3
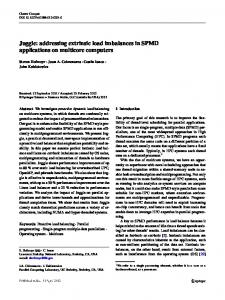
pressions indicate how these variables are calculated from the symbolic inputs. This is a layered approach: one analysis mechanism is built on top of another to perform more advanced analysis, as illustrated in Figure 2.
External function calls. First, we consider the case where the program under analysis makes an external function call, whose function body is located in another code module (i.e., library). We use the following observation: Whenever a program makes a function call, the value of the stack pointer at the time of the function call must be greater than the value of the stack pointer at the time when a certain behavior is performed in that external function call. This is because one or more stack frames have to be pushed onto the stack when making function calls, and the stack grows toward smaller addresses on the x86 architecture. Based on our observation, we use the following approach to identify the execution in an external function: Whenever the execution jumps into the code under analysis, we record the current value of the stack pointer, together with the current thread identifier. When execution jumps out of this code region, we check whether there is a recorded stack pointer for the current thread identifier, and if so, whether this value is smaller than the current stack pointer. If this is the case, we remove the record as the code is not on the stack anymore. Whenever an interesting behavior is observed, we check whether there is a recorded stack pointer under the current thread identifier. If so, we consider this behavior to be performed on behalf of the code under analysis, because this means that the code under analysis is on the call stack. Software interrupts. The program under analysis may make a software interrupt (e.g, int 80 for system call in x86), and then the kernel will service this software interrupt. Therefore, we need to attribute the behavior happening inside the software interrupt to the program under analysis. In the whole-system emulator, we can easily observe all the software interrupts. Then we can attribute the execution during this software interrupt under the same thread context to the program’s context. Fast system calls. The program under analysis may make a fast system call (i.e., sysenter in x86), and there is no software interrupt happening for this fast version. To associate behaviors happening in a system call with the program that executes sysenter, we instrument sysenter and sysexit instructions, and attribute the execution in the same thread context between sysenter and sysexit to the program under analysis.
4.
Symbolic Execution Dynamic Taint Analysis Shadow Flag Analysis
Figure 2: A Layered Approach for Annotative Execution Shadow memory. We use a shadow memory to store and manage the annotations of each byte of the physical memory and CPU registers and flags. To support tracking memory being swapped in and out, we also have shadow memory for the hard disks. With the shadow memory for the hard disks, the system can continue to track the annotations that have been swapped out. uint64_t regs_bitmap = 0; //bitmap for CPU registers uint8_t *regs_records; //annotations for CPU registers typedef struct _tpage_entry { uint64_t bitmap; //bitmap for 64-byte memory chunk uint8_t records[0]; //byte array for 64 annotations } tpage_entry_t; tpage_entry_t **tpage_table; //page table for main memory typedef struct disk_record uint64_t index; //index for a 64-byte disk chunk uint64_t bitmap; //bitmap for the 64-byte disk chunk struct list_head link; //linked list entry uint8_t records[0]; //byte array for 64 annotations disk_record_t; struct list_head disk_hashtable[1024]; //hash table for disk
Figure 3: Data structures for shadow memory The code snippets in Figure 3 illustrate how TEMU maintains the shadow memory. The shadow memory for CPU registers is straightforward, because there are only a small number of registers. A 64-bit integer regs_bitmap is big enough to shadow each byte of 8 general-purpose registers in 32-bit x86 architecture. regs_records is a byte array to store annotations for registers. The type of annotation record should be defined by the plugin, and is opaque to the platform. Hence, TEMU just treats an annotation record as a sequence of bytes, and only needs to know the size of an annotation record. Once the size of annotation record is provided by the plugin, regs_records will be allocated with appropriate size. To ensure efficient memory usage, the shadow memory for main memory is organized as a one-level page table. Each page entry responds to 64 bytes in main memory. If an entry is NULL, it means no annotations associated with any of the 64 bytes in it. Otherwise, the bitmap field indicates which of 64 bytes have annotations. The records is the byte array for storing 64 annotation records. Similarly, the records field is defined as a zero-length array, and will be allocated with appropriate size when the size of annotation record is provided by the plugin. The shadow memory for the hard disk is managed differently. Because the size of a hard disk is several orders of
ANNOTATIVE EXECUTION ENGINE
We propose a generic technique for dynamic binary code analysis, layered annotative execution. During the execution of each instruction, depending on the instruction semantics, we can annotate the operands of this instruction, or propagate annotations from source operands to destination operands, or update the existing annotations. We can perform annotative execution in a variety of ways. The most basic analysis is shadow flag analysis, in which we may simply annotate certain memory locations or registers to be dirty or clean. A more advanced analysis is dynamic taint analysis, in which we not only annotate certain memory locations and registers to be tainted, but also keep track of taint propagation. The most advanced analysis is symbolic execution, in which we not only mark certain inputs (i.e, memory locations or registers) as tainted, but assign a meaningful symbol to these inputs. Then during taint propagation, we associate symbolic expressions to the tainted memory locations and registers. These symbolic ex4
application or the OS kernel). Basic propagation policy. After a data source is tainted, we need to monitor each CPU instruction and DMA operation that manipulates this data in order to determine how the taint propagates. For data movement instructions and DMA operations, the destination will be tainted if and only if the source is tainted. For arithmetic instructions, the result will be tainted if and only if any byte of the operands is tainted. We also handle the following special situations. Constant function. Some instructions or instruction sequences always produce the same results, independent of the values of their operands. A good example is the instruction “xor %eax, %eax” that commonly appears in IA32 programs as a compiler idiom. After executing this instruction, the value of eax is always zero, regardless of its original value. We recognize a number of such special cases and untaint the result. Table lookup. A tainted input may be used as an index to access an entry of a table. The taint propagation policy above will not propagate taint to the destination, because the value that is actually read is untainted. Unfortunately, such table lookup operations appear frequently, such as for Unicode/ASCII conversion in Windows. Thus, TEMU has an option to propagate taint through table lookups: if any byte used to calculate the address of a memory locations is tainted, then, the result of a memory read using this address is tainted as well. The plugin has capability to enable or disable this option. Logic and bit shifting. We need to take care of these operations with more precision. For example, for “and $0xff, %eax”, if all of the 4 bytes of eax is tainted before this instruction, then only the lowest byte of eax should be tainted after the execution of this instruction. Similarly, for “shr $24, %eax”, only the lowest byte of eax should be tainted if eax the highest byte is tainted originally. We cover these special instructions to track taint more precisely. Tracking multiple taint labels. For many analysis purposes, it is often necessary to introduce and track multiple taint sources simultaneously. When an instruction (e.g., add) has multiple tainted source operands, the destination operand (often) needs to be marked as tainted from the multiple taint labels. How to maintain multiple labels is in fact application-specific. The plugin may choose to pick one label, maintain up to a number of labels, or maintain all of the labels. Thus, TEMU asks the plugin to handle this situation when multiple taint labels converge.
magnitude larger than main memory, a 1-level page table will not be space efficient. A multiple-level page table is more space efficient at the price of page lookup speed. Considering that in practice, a very small amount of disk data are annotated (for page swapping and small data files), we use a hash table. The disk space is divided into 64-byte chunks, and the index to a disk chunk is used to look up the hash table. The size of hash table is independent of the disk size, and lookups in this hash table are efficient when only a small number of disk chunks are annotated. Code instrumentation. We instrument the execution of the guest system to enable annotative execution. We also implant callbacks to notify the plugin of various events, as shown in Section 5. QEMU uses dynamic translation techniques to emulate a guest system. That is, when a block of code (i.e, a code stream with a single entry and a single exit) from the guest system is executed for the first time, it is translated into statements in an intermediate form, and then the code executed on the host system is generated from these intermediate statements. The translated code is stored in the code cache, such that the code translation overhead can be amortized over subsequent executions of the same code block. The code instrumentation is intermingled with a dynamic translation process. In general, there are two ways to insert instrumentation code: 1) inline the instrumenting instructions or statements directly into the translated code, as Memcheck [28] and Argos [33] do; and 2) insert function calls, and the actual instrumentation tasks are implemented in these functions. The advantage of the first approach is efficiency, because some redundant operations can be optimized away during the code emission phase. Its disadvantage is lack of capability and extensibility. It is cumbersome and sometimes infeasible to implement comprehensive functionality for instrumentation. The second approach is on the contrary: less efficiency but greater capability. Therefore, we take the second approach, in favor of capability over efficiency. We plan to investigate performance optimization in future work. In Appendix A, we use a concrete example to walk through this code instrumentation process in more detail.
4.1 Shadow Flag Analysis Shadow flag analysis is the most basic analysis in this layered architecture. Basically, depending on the execution context and the semantics of the current instruction, we can decide whether to create an annotation for a memory location or register. Later, we can check or change this annotation. Compared to the other more advanced analysis techniques, shadow flag analysis is the most efficient.
4.3 Symbolic Execution Symbolic execution gives abstract interpretation of how certain values are processed on both the data plane and the control plane. On the data plane, symbolic execution allows registers and memory locations to contain symbolic expressions in addition to concrete values. Thus, a value in a register may be an expression such as X + Y where X and Y are symbolic variables. Consider a small program in Figure 4. After execution, we produce a symbolic expression for mem[10], which is mem[10] = y*3+5. This symbolic expression abstractly interprets how the content in this memory location is calculated from the relevant symbolic inputs on the data plane. On the control plane, symbolic execution generates a path predicate, describing the constraints on the symbolic inputs
4.2 Taint Analysis Our dynamic taint analysis is similar in spirit to a number of previous systems [13,14,16,32,38]. In comparison, our design and implementation is the most complete. For example, previous approaches either operate on a single process only [14, 32, 38], or they cannot deal with memory swapping and disks [13, 16]. Taint source. A plugin is responsible for introducing taint sources into the system. TEMU supports taint input from hardware, such as the keyboard, network interface, and hard disk. TEMU also supports tainting a memory region (e.g. the output of a function call, or a data structure in a specific 5
L1: L2: L3: L4: L5: L6: L7:
z = 10; x = 2; x = y*3; z = x+4; k = z+1; if(z