Hindawi International Journal of Aerospace Engineering Volume 2018, Article ID 4728648, 11 pages https://doi.org/10.1155/2018/4728648
Research Article Terminal Airspace Capacity Evaluation Model under Weather Condition from Perspective of a Controller Lu Liu College of Civil Aviation, Nanjing University of Aeronautics and Astronautics, Nanjing 210016, China Correspondence should be addressed to Lu Liu;
[email protected] Received 28 May 2017; Revised 3 January 2018; Accepted 14 May 2018; Published 10 June 2018 Academic Editor: Christopher J. Damaren Copyright © 2018 Lu Liu. This is an open access article distributed under the Creative Commons Attribution License, which permits unrestricted use, distribution, and reproduction in any medium, provided the original work is properly cited. A route network lays in the terminal airspace. The route network can be divided into multiple subnetworks according to sectors. When severe weather conditions occur, a controller takes measures to obtain safe operation of flights, such as navigation guidance or changing the availability of routes. In such circumstances, the route structure of a subnetwork is changed, and the controller’s attention paid to each route is also changed as well as the unit workload on it. As the subnetwork is handled by one controller, capacities of routes in it are associated. We find the way to determine the “related capacity” of a route in the conditions that whether topological structure of the terminal route network is changed or not. The capacity of the terminal route network calculated by network flow theory represents the capacity of terminal airspace. According to the analysis results, the weather factor reduces capacity of terminal airspace directly by reducing the capacities of routes blocked. Indirectly, it diverts controller’s attention to change capacities of other routes in the subnetwork.
1. Introduction The capacity is the maximum number of flights that can be handled per unit time under the background of weather condition, system-specific structure, control rules, and safety level of the airspace area. The operation of air traffic is significantly affected by the weather condition. There are many studies of capacity assessment under the impact of weather. According to different objects, different methods have been raised. However, most of these methods are for airport runway capacity and sector capacity. The object of airport capacity assessment is a runway system. By statistical analyzing of the relationship between weather factors and capacity values, capacity is achieved in form of probability distribution according to weather forecast information [1–4]. In the study of sector capacity under weather condition, the research objects are diversified. Researchers studied the maximum number of flights simultaneously accommodated in a sector and the parallel paths laid along with the direction of traffic in the narrowest area of a sector [5–7]. Although to a certain extent the results reflect
the service capability of a sector, these studies have deviated from the strict definition of sector capacity. By summarizing these methods, we found that mathematical factors such as geometric factors and statistical factors are highly concerned in capacity evaluation methods under weather conditions, while human factors are ignored. There are few studies of terminal airspace capacity under weather condition. Among these studies, the network theory is used as the fundamental and the capacity is expressed as the maximum flow of the route network, while the route capacity of the network is still calculated by increased interval standard between flights on the route regardless of controller’s workload [8–10]. It concludes that the processes of capacity evaluation under weather condition are mathematical and statistical regardless of the controller factor. As is known to all, controller takes an important part in air traffic management. The severe weather condition brings new tasks to a controller. Then controller’s workload will be changed, and capacity of airspace will be influenced in return. In this point of view, we study the terminal airspace capacity evaluation method
2 with the controller factor involved under weather condition in the paper.
2. Research Problem Statement The terminal airspace is composed of multiple sectors. The route network of terminal airspace can be divided into subnetworks by sectors. As each subnetwork is handled by one controller, the capacity of the subnetwork is determined by the controller’s workload, while capacity of each route in the subnetwork is associated. It seems that both the total time that the controller prefers to spend on the route and the time that the controller actually take to handle one flight through the route determine the capacity of the route. We define the former time as “controller’s attention” which reflects the control preference to each route and define the latter time as “unit workload” which brought by control tasks. Under severe weather condition, unusual control tasks are generated on the route blocked and new structure of the route network may be formed. In return, the distribution of controller’s attention and unit workload of each route will be changed. In this paper, we establish the workload-related route capacity model based on two parameters above under weather condition and solve the problem of terminal airspace capacity evaluation by the classical theory of network flow.
3. Model of Route Capacity under Weather Condition When the severe weather occurs on the route of the flight procedure, it leads to navigation deviation and even no entrance to the airspace unit. The different coverage scales and intensity of weather have different effects on the route. For small scale weather conditions, by planning new track between the original starting node and terminal node of the route, the route can still be seen as “connected” and the service capability of the new track is the capacity of the route. For a larger scale or more intense weather conditions, it may be impossible to plan the new track by the above method. The route is blocked and has neither service capability nor capacity. Though in this situation, it breaks the original edge of the route network, but in the actual operation new connections of network nodes will be added to meet the traffic flow demand in the direction of blocking. In view of the above two situations, network topology of the former situation is unchanged, while network topology of the latter situation is changed. Then, we, respectively, model the capacity of the route in different situations. In order to calculate route capacity, the distribution of controller’s attention and unit workload on each route in each situation is determined below. 3.1. Distribution of Controller’s Attention under Weather Condition. The distribution of controller’s attention reflects control preference. Based on the relation of operation on some routes, a controller may handle them alternatively, such as alternative control on the routes involved in flight conflicts. We assume that a flight conflict involves at most
International Journal of Aerospace Engineering two flights, thus, the route to be controlled is only related to the last route controlled. 3.1.1. Situation 1: Topology of the Route Network Unchanged. In the management of airspace, the structure of the route network is usually abstracted as the cognitive background of the controller. Although the weather changes the tracks of flights to some extent, it does not change the route network topology. The controller’s cognitive background and the actual operation of the airspace change slightly, and the control habits and experience of the original cognitive background are still applicable with the current traffic situation. It can be argued that in this case the distribution of controller’s attention on each route is approximately the same as that without weather. According to the route structure of the sector, the number of routes is set as n, and each route is recorded as xi , i = 1, … , n. E is defined as one control event which represents a series of radio communication between controller and one pilot for a certain control task [11–13]. These control tasks include heading guidance, conflict deployment, pilot’s request, and response. The work of a controller then is divided into multiple discrete control events Em . The subscript indicates the sequence of the event. Em = xi represents that the mth control event happened to the aircraft on the route xi . Further, we define p Em = xi , Em−1 = x j , i, j = 1, … , n as the probability between two successive control events. The former control event Em−1 happened to the aircraft on the route j, and the latter event Em happened to the aircraft on the route i. According to the joint distribution of successive events, the marginal distribution can be obtained. n
p Em = xi = 〠 p Em = xi , Em−1 = x j
1
j
Formula (1) indicates the probability of which a control event happens on each route. In other words, this distribution shows the possibility that one control event will occur on different routes. The distribution represents exactly the controller’s control preference for different routes. Thus, the distribution of controller’s attention can be estimated based on this distribution of control preference. Set T as the total working time, and the controller’s attention for each route is expressed as follows. λweather = p Em = xi × T i
2
3.1.2. Situation 2: Topology of the Route Network Changed. When the route network topology changes, the difference between the actual operation state of the airspace and the cognitive background of the controller is increased. The distribution of controller’s attention on each route is no longer the same as that without weather condition. Here, we still use the probability of which a control event happens on each route, referring to control preference, to determine the distribution of controller’s attention. According to the previous study, it is found that the flying distance during the period of time between two consecutive control
International Journal of Aerospace Engineering
3
a
a
c
c
d
d b
b
f
e
e
f
Figure 1: Structure scheme under weather condition.
events to one flight in a sector is subject to the negative binomial distribution [11]. The result indicated that the flying distance is associated with control frequency. Taking the expected value of the distribution as average flying distance, it can be seen that the longer a route is, the more average number of control events for a flight on it is. It also can be seen that the number of control events on a route increases with the growth of flights that travel on it. The sector is responsible for air traffic in different directions. The control probability of a route is proportional to the number of control events per flight but also to the number of flights on it. Set li as the length of the route xi , qi as proportion of flights on the route xi , and then the controller’s attention on the route is as below. λweather = i
l i qi n
〠i li qi
×T
3
3.2. Unit Workload of a Route under Weather Condition. Based on types of control tasks, we divide the workload on the route into types below: transfer workload, regular workload, meteorological workload, conflict workload, and other workloads. The transfer workload corresponds to the necessary energy consumption of the controller to the transfer event mainly for the flight which enters and exits the sector. It occurs on routes which are connected with the entrances or exits of the sector. The influence of the weather factor on transfer workload is “all or nothing”. For example, when a sector entrance is blocked, no flight can enter the airspace and the transfer workload is not recorded. While if the impact of the weather does not cut off the traffic flow into the sector, the transfer workload is still required to be recorded. The regular workload corresponds to the necessary energy consumption of the controller to make the aircraft meets the established operational requirements of the airspace, such as heading requirements, altitude requirements, and speed limits. When the weather condition occurs on a route, the aircraft needs to deviate from the established flight route to pass by the blocked area in order to reach the intended
destination. In this process, the controller consumes a certain amount of energy to implement his decision-making results. We take this part of energy consumption as meteorological workload. It can be seen as a supplement of regular workload under weather condition. The conflict workload represents the necessary energy consumption of the controller when he takes actions to avoid the interval between flights less than safety requirements. When the weather condition occurs, available airspace to handle flight confliction is reduced and in return, density of flights is increased which would cause more conflictions and more conflict workload. The other workload represents energy consumption of the controller under the situation not included above. Since this part of the workload is not associated with meteorological factors, it is assumed that this part of the workload does not change under weather condition. 3.2.1. Situation 1: Topology of the Route Network Unchanged. Based on the discussion of workload above, it depends on a new flying track of flight in the case of route network topology unchanged. We establish a model to quantify controller’s workload. As shown in Figure 1, the areas in grey indicate the meteorological area that is not suitable for flight. According to the scale of the weather, the possible track of flight on the route bc is shown in the figure. Set μtq i as the average workload of navigation guidance for tq one time due to weather condition, and ni is the average times of guidance for one flight. The unit meteorological tq tq workload can be achieved by μi ni . The new flying track also leads to the change in conflict workload. In order to determine the change in conflict workload, the change in the probability of a conflict should be gained [14–17]. Set the conflict probability of the route xi and route x j as pctij . To determine pctij , possible location of aircraft when diverting from the original route should be known. Due to fuel restrictions, the new flying track is near the original route and its length is limited. Suppose that the upper percentage of voyage that can be increased is α. And it is proven that the farthest location of flight from the
4
International Journal of Aerospace Engineering ct
Set p′ij as the conflict probability without weather influence. Then, the increased rate ωcti of conflict workload is described as below, where the route x j is any route merged with the route xi .
k
y b
c
L−x
x
ωcti =
Figure 2: Location boundary of flight.
original route is determined by the track with only one corner, which begins with the original starting node and ends with the original terminal node of the route. As illustrated in Figure 2, the original route bc is draw in a full line and the length of it is L. The dotted lines indicate possible tracks. Point k represents the turning corner. The distance between the point k and route bc is y, and distance between starting point b and projection of point k to route bc is x. Geometric relationship is expressed as below. x2 + y2 +
L − x 2 + y2 ≤ 1 + α L
4
ky
Set U i as the set of points x, y , and the border of the set fits an elliptic equation. In case of safety, horizontal and vertical interval standards of aircrafts are required. When the interval between two aircrafts is less than the standards, a conflict happens. In actual operation, the controller needs to make early judgment on the conflict trend and take corresponding measures. In terminal airspace, controller usually does not use a vertical interval to avoid conflicts. Therefore, only horizontal interval standard is under concerned, set as M x . According to the interval standard, the safe area of an aircraft is determined. It is an aircraft-centered square area with a side length of M x . A conflict occurs when the safe areas of two flights overlap. So, the safe areas of flights located ky in U i can be described as set of points x, y ± 1/2 M x , aq called U i . tq Set the point set of the meteorological avoiding area U i which is influencing the route xi . The actual safe airspace is sj shown in the point set U i . sj
aq
aq
tq
Ui = Ui − Ui ⋂ Ui
5 sj
By calculating the probability when U i of different routes would overlap, the probability of confliction between the routes is predicted. We assume that the aircraft is randomly distributed in the available safe airspace, then the probability of conflict between routes is proportional to the overlap area of their safety zone. Set S ⋅ as the area of the point set in the bracket. There are at most two aircrafts involved in a confliction. So, the probability of confliction between the aircraft on the route xi and the aircraft on the route x j is as below. sj
pctij
=
2
sj
S Ui ⋂ U j sj
S Ui
sj
× S Uj
6
〠 j pct ij q j ct
〠 j p′ij
7
qj
If the traffic travels from the right to left in Figure 1, we assume that the safe interval is achieved on an upstream route dc and in this situation, ωcti for the route cb is one. yj cg ct qt μ′i , μ′i , μ′i , and μ′i , respectively, represent the average workload of the transfer control event, regular control event, conflict control event, and other control events for one time on the route xi in good weather condition. Correspondingly, yj cg ct qt n′i , n′i , n′i , and n′i , respectively, represent the average number of transfer control events, regular control events, conflict control events, and other control events when a flight travels through the route xi under good weather condition. Then, the unit workload of the route xi comes to be as follows. yj
yj
cg
cg
ct
ct
qt
qt
tq tq μweather = μ′i n′i + μ′i n′i + μi ni + ωcti μ′i n′i + μ′i n′i i
8 When there is no weather covering route xi and any tq tq route merged with the route xi , μi ni is zero and ωcti is one. When any route merged with the route xi covered tq tq by weather except the route xi , μi ni is zero but ωcti is not one. These parameters except ωcti can be obtained by analyzing actual operation data. 3.2.2. Situation 2: Topology of the Route Network Changed. When the adverse weather occurs at some critical location of the route, the route network node can be no longer used. As shown in Figure 1, if the point c is covered by a large area of weather, the controller often tends to direct the aircraft to fly to the next key point d. So in this case, usually by finding the next key node to reconnect the route in the destination of the flight, the route network with new topology is formed. is and it represent the original starting segment and terminal segment of the new route; im indicate the inner segment. Whether the new route is an entrance or exit route of the sector, recording the transfer workload is determined. The transfer workload value is the sum of transfer workload of original routes between the starting node and terminal node of the new route in normal weather condition. it
yj
yj
μi ni = 〠 μ′im n′im yj yj
9
is
The aircraft on the new route need to complete flight missions of the all original routes between the starting node and terminal node, including heading adjustment and height adjustment. Thus, the regular workload of the new route is
International Journal of Aerospace Engineering
5 P297
V1
MEBNA
V2
KIBES
V3
DADOL MEBNA
P297
KIBES ZAY
V2 V1
V7
V3 V6
V5
LXI
V5 Runway 1 Runway 2
ELASU
V6
V4
XSJ
GULOT
V8
Figure 4: Arrival route network.
SGM
P73
V4 DADOL
GULOT
XSJ
V7
LXI
P297 P73
Runway 1
TOH
ELASU
GULOT
SGM
ELASU
Figure 3: Sectors of terminal airspace.
the sum of the regular workload of the original routes between the starting and terminal nodes of the route under good weather condition. it
cg
cg
cg cg μi ni = 〠 μ′im n′im
10
LXI Runway 2 KIBES
V8
Figure 5: Departure route network.
is
Similarly, the other workload of the new route is the sum of the other workload of the original routes between the starting and terminal nodes of the new route in good weather. it
qt
qt
μi ni = 〠 μ′im n′im qt qt
below. If route xi is a new route, route x j is any route merged with it in the new network. If route xi is a route existing in the original network, route x j is the new connected route merged with it.
11
pcti =
is
Conflict workload calculation is similar to the topologyunchanged situation. It is obtained by determining the probability of the overlapping area of the safe flight area between the routes in the new route network. The difference is that the new flying tracks’ range is determined by the sum length of the original routes between the starting node and terminal node. Refer to the Figure 2, aircraft position x, y satisfies relation in the formula below. x2 + y2 +
L − x 2 + y 2 ≤ 1 + α L′
12
Here, L indicates the distance between the starting node and terminal node of the new route, and L′ indicates the sum length of the original routes between the starting node and terminal node. The method of calculating the flight safety zone and the probability of conflict are the same as that of the route network topology unchanged. Let pcti represent the probability of a conflict between new connected routes and routes merged with them in the new network. pcti is defined as
〠 j pct ij q j
13
〠jqj
Set the average energy consumption which is used to solve one conflict problem on different two routes as ω, then, the new-generated unit conflict workload for the route is ωpcti . In summary, under the meteorological factors, when the route network topology changes, the route unit workload calculation formula is as follows. ct
ct
ct
cg cg yj yj qt qt μweather = μi ni + μi ni + ω′i μ′i n′i + ωpcti + μi ni i
14
ct
Here, ω′i is the changing rate of original conflict workload for route xi . Route x j is the route originally merged with route xi without weather conditions, and q′j corresponds to the proportion of flights on it. ct
ω′i =
1
〠
〠 j q′j j
pctij q′j
15
ct
p′ij
ct
ct
ct
When route xi is a new connected route, ω′i μ′i n′i is zero. When route xi is the route merged with the new
6
International Journal of Aerospace Engineering DADOL MEBNA
P297
KIBES ZAY
V2 V1 V7 V5
V3 V6
V8
SGM
P73
V4
GULOT
XSJ
LXI
TOH
ELASU
Figure 6: Terminal airspace under weather condition (a). ct
connected route, ω′i is one. And if route xi is the route originally merged with the blocked route, pcti is zero. 3.3. Calculation Method of Route Capacity. Based on the distribution of controller’s attention and the unit workload on each route, the route capacity value can be calculated. The workload threshold of 80% total working time for a controller is aimed at traffic safety, and controller will not be overpressurized [18]. The same rule is needed for controller’s attention value on routes in the same sector for safe and efficient operation. Here, we also take 80% time length of attention that a controller prefers to pay on the route as threshold. It not only ensures a safe operation on routes but also does not break the limitation of controller’s workload threshold. Thus, the route capacity calculation formula is as follows.
arc vi v j is recorded as arc capacity cij , which corresponds to the route capacity in the route network. In the network, the material flow which meets constraints below is called a feasible flow. (1) Capacity constraints: for each arc vi v j ∈ A, 0 ≤ f ij ≤ cij . (2) Balance conditions: vs vt represent, respectively, the starting node and terminal node of the network, then 〠 f sj − vs v j ∈A
〠 f tj − vt v j ∈A
〠 f ij − cweather = i
λweather × 80% i weather μi
16
4. Capacity of Terminal Airspace By using the formulation above, we get related capacity for each route in a sector. According to the connection between sectors, a route network of terminal airspace is formed. When flights travel on the network, network flows will be produced. The following is a brief description of the basic concepts of network flow [19]. vi ∈ V is set to represent the node in the network, and in a certain period of time, the number of material through arc vi v j is called arc flow f ij , which is a variable to be solved in the network flow problem. The total flow in the network is represented as v f . The maximum flow through the
vi v j ∈A
〠 f js = v f , v j vs ∈A
〠 f jt = −v f , v j vt ∈A
17
〠 f ji = 0 v j vi ∈A
When the arc flow is equal to the arc capacity, the arc is known as saturated arc, while when the arc flow is less than the arc capacity, it is called an unsaturated arc. A chain in the network is composed of arcs end to end from the starting node to the terminal node. If there is a feasible flow f ij that meets the conditions f ij < cij , the chain is an augmented chain of feasible flow f ij . The network capacity is actually the maximum flow through the network. According to the characteristics of augmented chain, the flow can be increased on it. When there is no augmented chain of feasible flow f ∗ in the network, the feasible flow f ∗ is the maximum flow of the network. Generally, the maximum flow is obtained by the capacity of cut set in the network. The cut set is the collection of arcs in a connected network. If the set is removed, the original
International Journal of Aerospace Engineering
7
Table 1: Distribution of control preference for each route of the sector 01.
Table 3: Distribution of control preference for each route of the sector 03.
Route
Probability of control (%)
Route
V 1 –V 5
3
Probability of control (%)
7
LXI–XSJ ELASU–XSJ GULOT–XSJ XSJ–V 4
11
V 4 –V 6
28
RY1–V 7
8
V 6 –RY2
25
RY1–SGM SGM–P73 SGM–GULOT SGM–ELASU RY2–LXI RY2–V 8
10 9 9 12 11
V 2 –V 5
20
V 5 –RY1 V 3 –V 6
18
Table 2: Distribution of control preference for each route of the sector 02. Route
Probability of control (%)
P297–V 1
4
MEBNA–V 2
37
KIBES–V 3
12
V 7 –P297 V 7 –DADOL V 8 –KIBES
5 31 11
network becomes nonconnected networks and there is no chain to connect the starting node and terminal node of the original network. One network can have multiple different cut sets. The capacity of cut set is the sum of the capacities of all arcs in the cut set. The cut set whose capacity is the smallest is called minimal cut set. It can be proved that the maximum flow of the network is equal to the capacity of minimal cut set. Then, this value of the terminal route network is the capacity of terminal airspace.
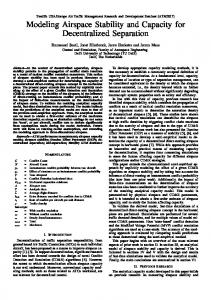
5. Case Study The location and scale of unfavorable meteorological factors play different roles in airspace operation. By using model established above, the following examples show the different impacts of meteorological factor on terminal capacity. Figure 3 is the structure of a terminal airspace, in which there are three sectors, sector 01 in the middle, sector 02 in the north, and sector 03 in the south. Lines in red are arrival procedures, and lines in blue are departure procedures. According to the route connection of the terminal area, the network of arrival routes and departure routes is, respectively, drawn in Figures 4 and 5. V 1 to V 4 represent the transfer points of the outer sector and the inner sector. V 5 and V 6 represent final approach points. V 7 and V 8 represent the transfer points between the sector 02 and sector 03. Departure routes are more flexible than arrival routes when flight tasks are carried out. For the sake of convenience, runway is abbreviated as RY.
8 10 10
2
Table 4: Workload statistics of the sector 01.
Route
Workload (unit: second) cg ct yj μ′i μ′i μ′i
Frequency (unit: times) cg ct yj n′i n′i n′i
Unit workload (unit: second)
V 1 –V 5
28
30
30
1
1.3
0.4
79
V 2 –V 5
28
26
32
1
1.6
0.05
71.2
V 5 –RY1 V 3 –V 6
0
32
0
0
2.4
0
76.8
28
26
30
1
1
0.4
66
V 4 –V 6
28
22
30
1
1.3
0.14
60.8
V 6 –RY2
0
32
0
0
2.8
0
89.6
Table 5: Workload statistics of the sector 02.
Route
Workload (unit: second) cg ct yj μ′i μ′i μ′i
Frequency (unit: times) cg ct yj n′i n′i n′i
P297–V 1
26
28
0
2
MEBNA–V 2
26
28
0
2
2
0
108
KIBES–V 3
26
30
0
2
1.7
0
103
V 7 –P297 V 7 –DADOL V 8 –KIBES
26 26 26
26 26 25
0 0 0
2 2 2
1.6 1.5 1.2
0 0 0
93.6 91 82
2.5
0
Unit workload (unit: second) 122
Case 1. In one operation day, a thunderstorm occurred in the sector 03, represented by black circle in Figure 6, with small range coverage of the route ELASU–XSJ. The thunderstorm only affects the route of arrival. The controller took flights to avoid the dangerous weather area by locally flying around. As a result, the route network topology does not change in this case, and capacity can be evaluated by a model in situation 1. According to the model, the controller’s attention distribution for each sector is gained by statistical results of operation data. They are shown in Tables 1–3.
8
International Journal of Aerospace Engineering Table 6: Workload statistics of the sector 03. Workload (unit: second) cg ct tq μi μ′i μ′i
Frequency (unit: times) cg ct tq ni n′i n′i
Increased rate ωcti
Unit workload (unit: second)
0 2.1 0
2.21 2.49 2.53
111 135.7 84.3
0
0
0
52
1
0
0
0
74
1 1 1 1 2
1.9 1.2 1 1.2 1
0 0 0 0 0
0 0 0 0 0
0 0 0 0 0
78.2 59.6 52 54.8 74
2
1
0
0
0
72
Route
μ′i
LXI–XSJ ELASU–XSJ GULOT–XSJ XSJ–V 4
26 26 26
30 24 20
35 30 28
0 22 0
1 1 1
1.8 1.4 1.5
0.4 0.4 0.4
24
28
0
0
1
1
RY1–V 7
25
24
0
0
2
RY1–SGM SGM–P73 SGM–GULOT SGM–ELASU RY2–LXI RY2–V 8
25 26 26 26 25
28 28 26 24 24
0 0 0 0 0
0 0 0 0 0
24
24
0
0
yj
n′i
yj
P297
(0, 1)
V1
MEBNA (0, 10) V2
S
KIBES
(0, 3) V3
LXI (0, 2) (0, 6) (0, 2) ELASU XSJ (0, 3)
V4
(0, 1)
Runway 1
V5
(0, 8) (0, 3) (0, 13) V6
(0, 7) T (0, 8) Runway 2
GULOT
Figure 7: Arrival route network with capacity under the meteorological influence (a). DADOL (0, 10) V7 (0, 3) Runway 1
P73
(0, 4)
(0, 4)
(0, 5) GULOT
SGM
S
P297
(0, 2)
T
(0, 6) ELASU (0, 4) LXI
Runway 2
(0, 1)
(0, 4) V8
KIBES
Figure 8: Departure route network with capacity under meteorological influence (a).
It is known that route ELASU–XSJ and route GULOT– XSJ are both 60 km long with an angle of 60 degrees between them. Route LXI–XSJ is 50 km long with an angle of 90 degrees to route ELASU–XSJ. The storm avoiding area’s diameter is 10 km, and the center of the storm is at the midpoint of the route ELASU–XSJ. Set the upper limit of the voyage increased rate α as 10%, and the interval standard is 10 km. The unit workload for
each route is shown in Tables 4–6. As there is very few other workload in operation data, so we ignore it for convenience. Then, the route capacity is filled in the networks in Figures 7 and 8, in which S and T are the virtual starting node and terminal node of the network, respectively, and capacity of dashed lines is infinite [20]. According to Figure 7, the capacity of the arrival route network is 15 and the minimal cut set is V 5 , RY1 , V 6 , RY2 .
International Journal of Aerospace Engineering
9 DADOL MEBNA
P297
KIBES ZAY
V2 V3
V1
V7
V5 V6
V8
SGM
P73
V4
GULOT
XSJ
ELASU
LXI
TOH
Figure 9: Terminal airspace under weather condition (b).
Although weather affects the capacity of ELASU–XSJ, the bottleneck of the arrival route network is final approach routes. According to Figure 8, the capacity of the departure route network is 12 and the minimal cut set is RY1, V 7 , RY1, SGM , RY2, LXI , RY2, V 8 . The bottleneck of the departure route network are routes for taking off. The results agree with the fact that terminal routes converge to the airport. So the capacity of terminal airspace is 27. By checking operation data that day, there was 13 arrival flights and 11 departure flights per hour under this weather condition and bottleneck was on approach segments. The model shows acceptable result. Case 2. In another operation day, a thunderstorm occurred in the sector 03, covering the route LXI–SXJ with a large scale of 20 km in diameter. As shown in the black circle in Figure 9, it is not economical to take a local flyaround from LXI to XSJ. In this case, a controller guide the flight directly to the next key point of flight, that is, the transfer point V 4 between the sector 03 and sector 01. Under the actual operation, routes will not merge at the transfer point. Here is to simplify the route connection, so add route LXI–V 4 to solve the airspace capacity for convenience. It is 23.3 km long with an angle of 90 degrees with route XSJ–V 4 . As a result, the route network topology changed in this case, and capacity can be evaluated by a model in situation 2. According to the model, when the route network topology in the sector 03 changes, the controller’s attention distribution will also change according to the length of the route and volume of traffic. Based on the relevant data, the results are shown in Table 7. And corresponding results of workload for each route are shown in Table 8.
Table 7: Distribution of control preference for each route of the sector 03. Route
Probability of control (%)
LXI–V 4
7
ELASU–XSJ GULOT–XSJ XSJ–V 4
11 10 8
RY1–V 7
8
RY1–SGM SGM–P73 SGM–GULOT SGM–ELASU RY2–LXI RY2–V 8
10 9 10 12 12 2
The route capacity model under the influence of meteorology, drawing the route network map with capacity values, is shown in Figures 10 and 11. The capacity of the arrival route network is 12 with two minimal cut sets. V 5 , RY1 , KIBES, V 3 , LXI, V 4 , XSJ, V 4 , V 5 , RY1 , V 3 , V 6 , LXI, V 4 , XSJ, V 4
18
The two cut sets both include a weather affected route. This result shows that meteorological factors become the factor restricting the terminal arrival capacity of the terminal. The capacity of the departure route network is 13 with the minimal cut set RY1, V 7 , RY1, SGM , RY2, LXI ,
10
International Journal of Aerospace Engineering Table 8: Workload statistics of the sector 03. Workload (unit: second) cg ct ω μi μ′i
Frequency (unit: times) cg ct pcti ni n′i
Changing rate ct ω′i
Unit workload (unit: second)
0.03
0
254.1
0 0
0.71 0.97
68.2 66.9
0
0.03
0
172.0
0
0
0
74
1.9 1.2 1 1.2 1
0 0 0 0 0
0 0 0 0 0
0 0 0 0 0
78.2 59.6 52 54.8 74
2
1
0
0
0
72
P297
(0, 1)
Route
μi
LXI–V 4
25
29
0
120
2
2.9
0
ELASU–XSJ GULOT–XSJ XSJ–V 4
26 26
24 20
30 28
0 0
1 1
1.4 1.5
0.4 0.4
24
28
0
120
1
1
RY1–V 7
25
24
0
0
2
1
RY1–SGM SGM–P73 SGM–GULOT SGM–ELASU RY2–LXI RY2–V 8
25 26 26 26 25
28 28 26 24 24
0 0 0 0 0
0 0 0 0 0
1 1 1 1 2
24
24
0
0
yj
yj
ni
S
V1
MEBNA
(0, 10) V2
KIBES
(0, 3) V3
(0, 1)
LXI (0, 4) ELASU
XSJ
(0, 4)
(0, 1) V 4
(0, 1)
Runway 1
V5
(0, 8) (0, 3)
(0, 7) T (0, 8)
(0, 13) V6
Runway 2
GULOT
Figure 10: Arrival route network with capacity under the meteorological influence (b).
DADOL
(0, 10) V7
(0, 2) P297
(0, 3) Runway 1
(0, 5) GULOT
(0, 4) SGM
S
P73
(0, 4)
T
(0, 6) ELASU (0, 5)
Runway 2
(0, 1)
LXI (0, 4)
V8
KIBES
Figure 11: Arrival route network with capacity under the meteorological influence (b).
RY2, V 8 . The capacity of route RY2–LXI increases one due to difference in controller’s attention distribution. So the capacity of terminal airspace is 25. By checking operation data that day, there was 10 arrival flights and 11 departure flights per hour under this weather condition and bottleneck was in the sector 03. The model shows acceptable result.
6. Conclusion In this paper, based on the segmentation of the terminal network, we discuss the method of terminal airspace capacity evaluation under weather condition. In the two situations of network topology changed and unchanged, the detailed analysis of controller’s attention and unit workload for each
International Journal of Aerospace Engineering route is put forward. By involving these two parameters, we solve the capacity assessment problem from perspective of the controller. According to the results of the case study, it is shown that different scales and location of weather have different influences on terminal capacity. Weather in a small scale declines the capacity of the blocked route but has little effect on terminal capacity. While weather in a large scale with more critical location restricts terminal capacity directly by decreasing the capacity of routes associated with blockage but also affects capacity through decentralization of control focus.
Conflicts of Interest The author declares that there are no competing interests regarding the publication of this manuscript.
References [1] T. R. Inniss and M. O. Ball, “Estimating one-parameter airport arrival capacity distributions for air traffic flow management,” Air Traffic Control Quarterly, vol. 12, no. 3, pp. 223–251, 2004. [2] G. Hunter and K. Ramamoorthy, “Integration of terminal area probabilistic meteorological forecasts in NAS-wide traffic flow management decision making,” in 13th Conference on Aviation, Range and Aerospace Meteorology, New Orleans, LA, USA, 2008. [3] J. W. Yen, Z. B. Zabinsky, and L. Grignon, “Incorporating weather uncertainty in airport arrival rate decisions,” in Conference on Air Traffic Management and Control, 2003. [4] T. Myers, J. Krozel, and M. Andrews, “Winter weather airport capacity model,” in 12th AIAA Aviation Technology, Integration, and Operations (ATIO) Conference and 14th AIAA/ISSMO Multidisciplinary Analysis and Optimization Conference, Indianapolis, IN, USA, 2012. [5] M. Weber, J. Evans, M. Wolfson et al., “Improving air traffic management during thunderstorms,” in 12th Conference on Aviation, Range, and Aerospace Meteorology, Atlanta, GA, USA, 2006. [6] J. S. B. Mitchell, V. Polishchuk, and J. Krozel, “Airspace throughput analysis considering stochastic weather,” in AIAA Guidance, Navigation, and Control Conference and Exhibit, Keystone, CO, USA, 2006. [7] J. Krozel, J. S. B. Mitchell, V. Polishchuk, and J. Prete, “Capacity estimation for airspaces with convective weather constraints,” in AIAA Guidance, Navigation and Control Conference and Exhibit, Hilton Head, SC, USA, 2007. [8] Y. F. Li, M. H. Hu, Y. Peng, and H. Wang, “Effect mechanism of multi-scenarios terminal capacity based on flow decomposition barrier,” Journal of Southwest Jiaotong University, vol. 49, no. 5, pp. 928–934, 2014. [9] Z. N. Zhang and X. Wang, “Assessment of terminal airspace dynamic capacity considering dangerous weather,” Journal of Civil Aviation University of China, vol. 31, no. 6, pp. 5–11, 2013. [10] Z. N. Zhang and Z. H. Wei, “A model for dynamic terminal airspace capacity estimation considering hazardous weather,” Science Technology and Engineering, vol. 15, no. 21, pp. 53–60, 2015.
11 [11] L. Liu, “Sector capacity model based on communication control law,” Command Information System and Technology, vol. 7, no. 6, pp. 45–48, 2016. [12] M. Zhang, L. Shan, M. Zhang, K. Liu, H. Yu, and J. Yu, “Terminal airspace sector capacity estimation method based on the ATC dynamical model,” Kybernetes, vol. 45, no. 6, pp. 884–899, 2016. [13] Y. Wang, F. Vormer, M. Hu, and V. Duong, “Empirical analysis of air traffic controller dynamics,” Transportation Research Part C: Emerging Technologies, vol. 33, no. 4, pp. 203–213, 2013. [14] J. K. Kuchar and L. C. Yang, “A review of conflict detection and resolution modeling methods,” IEEE Transactions on Intelligent Transportation Systems, vol. 1, no. 4, pp. 179–189, 2000. [15] M. R. Jardin, “Analytical relationships between conflict counts and air-traffic density,” Journal of Guidance, Control, and Dynamics, vol. 28, no. 6, pp. 1150–1156, 2005. [16] E. Sunil, J. M. Hoekstra, J. Ellerbroek, and F. Bussink, “The influence of traffic structure on airspace capacity,” in 7th International Conference on Research in Air Transportation, 2016. [17] J. Maas, E. Sunil, J. Ellerbroek, and J. M. Hoekstra, “The effect of swarming on a voltage potential-based conflict resolution algorithm,” in 7th International Conference on Research in Air Transportation, 2016. [18] J. Y. N. Cho, J. D. Welch, and N. K. Underhill, “Analytical workload model for estimating en route sector capacity in convective weather,” in Ninth USA/Europe Air Traffic Management Research and Development Seminar, 2011. [19] R. K. Ahuja, T. L. Magnanti, and J. B. Orlin, Network Flows: Theory, Algorithms, and Applications, Pearson, 1993. [20] Y. Li, M. Hu, H. Wang et al., “Research on airport terminal area ultimate capacity evaluation based on flow decomposition barrier,” Aeronautical Computing Technique, vol. 44, no. 6, pp. 4–8, 2014.
International Journal of
Advances in
Rotating Machinery
Engineering Journal of
Hindawi www.hindawi.com
Volume 2018
The Scientific World Journal Hindawi Publishing Corporation http://www.hindawi.com www.hindawi.com
Volume 2018 2013
Multimedia
Journal of
Sensors Hindawi www.hindawi.com
Volume 2018
Hindawi www.hindawi.com
Volume 2018
Hindawi www.hindawi.com
Volume 2018
Journal of
Control Science and Engineering
Advances in
Civil Engineering Hindawi www.hindawi.com
Hindawi www.hindawi.com
Volume 2018
Volume 2018
Submit your manuscripts at www.hindawi.com Journal of
Journal of
Electrical and Computer Engineering
Robotics Hindawi www.hindawi.com
Hindawi www.hindawi.com
Volume 2018
Volume 2018
VLSI Design Advances in OptoElectronics International Journal of
Navigation and Observation Hindawi www.hindawi.com
Volume 2018
Hindawi www.hindawi.com
Hindawi www.hindawi.com
Chemical Engineering Hindawi www.hindawi.com
Volume 2018
Volume 2018
Active and Passive Electronic Components
Antennas and Propagation Hindawi www.hindawi.com
Aerospace Engineering
Hindawi www.hindawi.com
Volume 2018
Hindawi www.hindawi.com
Volume 2018
Volume 2018
International Journal of
International Journal of
International Journal of
Modelling & Simulation in Engineering
Volume 2018
Hindawi www.hindawi.com
Volume 2018
Shock and Vibration Hindawi www.hindawi.com
Volume 2018
Advances in
Acoustics and Vibration Hindawi www.hindawi.com
Volume 2018