TerrorCat: a Translation Error Categorization-based MT Quality Metric Mark Fishel,γ Rico Sennrich,γ Maja Popovi´c,ξ Ondˇrej Bojarϕ γ
Institute of Computational Linguistics, University of Zurich {fishel,sennrich}@cl.uzh.ch ξ German Research Center for Artificial Intelligence (DFKI), Berlin
[email protected] ϕ Charles University in Prague, Faculty of Mathematics and Physics, Institute of Formal and Applied Linguistics
[email protected]
Abstract We present TerrorCat, a submission to the WMT’12 metrics shared task. TerrorCat uses frequencies of automatically obtained translation error categories as base for pairwise comparison of translation hypotheses, which is in turn used to generate a score for every translation. The metric shows high overall correlation with human judgements on the system level and more modest results on the level of individual sentences.
1
The Idea
Recently a couple of methods of automatic translation error analysis have emerged (Zeman et al., 2011; Popovi´c and Ney, 2011). Initial experiments have shown that while agreement with human error analysis is low, these methods show better performance on tasks with a lower granularity, e.g. ranking error categories by frequency (Fishel et al., 2012). In this work we apply translation error analysis to a task with an even lower granularity: ranking translations, one of the shared tasks of WMT’12. The aim of translation error analysis is to identify the errors that translation systems make and categorize them into different types: e.g. lexical, reordering, punctuation errors, etc. The two tools that we will use – Hjerson and Addicter – both rely on a reference translation. The hypothesis translation that is being analyzed is first aligned to the reference on the word level, and then mistranslated, misplaced, misinflected, missing or superfluous words and other errors are identified.
The main idea of our work is to quantify translation quality based on the frequencies of different error categories. The basic assumption is that different error categories have different importance from the point of view of overall translation quality: for instance, it would be natural to assume that punctuation errors influence translation quality less than missing words or lexical choice errors. Furthermore, an error category can be more important for one output language than the other: for example, word order can influence the meaning in an English sentence more than in a Czech or German one, whereas inflection errors are probably more frequent in the latter two and can thus cause more damage. In the context of the ranking task, the absolute value of a numeric score has no importance, apart from being greater than, smaller than or equal to the other systems’ scores. We therefore start by performing pairwise comparison of the translations – the basic task is to compare two translations and report which one is better. To conform with the WMT submission format we need to generate a numeric score as the output – which is obtained by comparing every possible pair of translations and then using the (normalized) total number of wins per translation as its final score. The general architecture of the metric is thus this: • automatic error analysis is applied to the system outputs, yielding the frequencies of every error category for each sentence • every possible pair of all system outputs is represented as a vector of features, based on the error category frequencies
64 Proceedings of the 7th Workshop on Statistical Machine Translation, pages 64–70, c Montr´eal, Canada, June 7-8, 2012. 2012 Association for Computational Linguistics
• a binary classifier takes these feature vectors as input and assigns a win to one of the sentences in every pair (apart from ties)
Source:
• the final score of a system equals to the normalized total number of wins per sentence
HYP -1:
Us
HYP -2:
• the system-level score is averaged out over the individual sentence scores
HYP -3:
The champions we are . We are the champignons!
Wir sind Meister!
Translations: Reference: We are the champions! champions!
Error Frequencies:
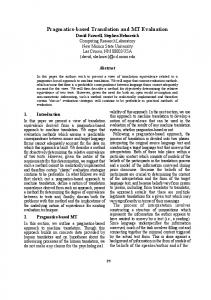
An illustrative example is given in Figure 1. We call the result TerrorCat, the translation error categorization-based metric.
HYP -1:
1×inflection, 2×missing
HYP -2:
2×order, 1×punctuation
HYP -3:
1×lex.choice
2
Classifier Output: (or manually created input in the training phase) HYP -1 < HYP -2
The Details
In this section we will describe the specifics of the current implementation of the TerrorCat metric: translation error analysis, lemmatization, binary classifier and training data for the binary classifier. 2.1
< HYP -3
HYP -2
> HYP -3
Scores:
Translation Error Analysis
Addicter (Zeman et al., 2011) and Hjerson (Popovi´c and Ney, 2011) use different methods for automatic error analysis. Addicter explicitly aligns the hypothesis and reference translations and induces error categories based on the alignment coverage while Hjerson compares words encompassed in the WER (word error rate) and PER (position-independent word error rate) scores to the same end. Previous evaluation of Addicter shows that hypothesis-reference alignment coverage (in terms of discovered word pairs) directly influences error analysis quality; to increase alignment coverage we used Berkeley aligner (Liang et al., 2006) and trained it on and applied it to the whole set of reference-hypothesis pairs for every language pair. Both tools use word lemmas for their analysis; we used TreeTagger (Schmid, 1995) for analyzing English, Spanish, German and French and Morˇce (Spoustov´a et al., 2007) to analyze Czech. The same tools are used for PoS-tagging in some experiments. 2.2
HYP -1
Binary Classification
Pairwise comparison of sentence pairs is achieved with a binary SVM classifier, trained via sequential minimal optimization (Platt, 1998), implemented in Weka (Hall et al., 2009). The input feature vectors are composed of frequency differences of every error category; since the 65
HYP -1:
0
HYP -2:
1
HYP -3:
0.5
Figure 1: Illustration of TerrorCat’s process for a single sentence: translation errors in the hypothesis translations are discovered by comparing them to the reference, error frequencies are extracted, pairwise comparisons are done by the classifier and then converted to scores. The shown translation errors correspond to Hjerson’s output.
maximum (normalized) frequency of any error rate is 1, the feature value range is [−1, 1]. To include error analysis from both Addicter and Hjerson their respective features are used side-by-side. 2.3
Data Extraction
Training data for the SVM classifier is taken from the WMT shared task manual ranking evaluations of previous years (2007–2011), which consist of tuples of 2 to 5 ranked sentences for every language pair. Equal ranks are allowed, and translations of the same sentence by the same pair of systems can be present in several tuples, possibly having conflicting comparison results. To convert the WMT manual ranking data into the training data for the SVM classifier, we collect all rankings for each pair of translation hypothe-
fr-en de-en es-en cs-en en-fr en-de en-es en-cs
2007-2010 34 152 36 792 30 374 19 268 22 734 36 076 19 352 31 728
2007-2011 46 070 53 790 41 966 26 418 35 854 56 054 35 700 52 954
labeled data from this year’s shared task. The resulting dataset sizes are given in Table 1. All of the resulting scores obtained by different variants of our metric are presented in Tables 2 (for system-level correlations) and 3 (for sentence-level correlations), compared to BLEU and other selected entries in the WMT’11 evaluation shared task. Correlations are computed in the same way as in the WMT evaluations.
Table 1: Dataset sizes for every language pair, based on manual rankings from WMT shared tasks of previous years: the number of pairs with non-conflicting, nonequivalent ranks.
3.1
Model Optimization
The following is a brief description of successful modifications to the baseline system. Weighted Wins
ses. Pairs with equal ranks are discarded, conflicting ranks for the same pairs are resolved with voting. If the voting is tied, the pair is also discarded. The kept translation pairs are mirrored (i.e. both directions of every pair are added to the training set as independent entries) to ensure no bias towards the first or second translation in a pair. We will later present analysis of how well that works. 2.4
TerrorCat+You
TerrorCat is distributed via GitHub; information on downloading and using it can be found online.1 Additionally we are planning to provide more recent evaluations with new datasets, as well as pre-trained models for various languages and language pairs.
3
The Experiments
In the experimental part of our work, we search for the best performing model variant, the aim of which is to evaluate different input features, score calculation strategies and other alternations. The search is done empirically: we evaluate one alternation at a time, and if it successful, it is added to the system before proceeding to test further alternations. Performance of the models is estimated on a heldout development set, taken from the WMT’11 data; the training data during the optimization phase is composed of ranking data from WMT 2007–2010. In the end we re-trained our system on the whole data set (WMT 2007–2011) and applied it to the un1
http://terra.cl.uzh.ch/terrorcat.html
66
In the baseline model, the score of the winning system in each pairwise comparison is increased by 1. To reduce the impact of low-confidence decisions of the classifier on the final score we tested replacing the constant rewards to the winning system with variable ones, proportional to the classifier’s confidence – a measure of which was obtained by fitting a logistic regression model to the SVM output. As the results show, this leads to minor improvements in sentence-level correlation and more noticeable improvements in system-level correlation (especially English-French and Czech-English). A possible explanation for this difference in performance on different levels is that low classification confidence on the sentence-level does not necessarily affect our ranking for that sentence, but reduces the impact of that sentence on the system-level ranking. PoS-Split Features The original model only makes a difference between individual error categories as produced by Hjerson and Addicter. It seems reasonable to assume that errors may be more or less important, depending on the part-of-speech of the words they occur in. We therefore tested using the number of errors per error category per PoS-tag as input features. In other words, unlike the baseline, which relied on counts of missing, misplaced and other erroneous words, this alternation makes a difference between missing nouns/verbs/etc., misplaced nouns, misinflected nouns/adjectives, and so on. The downside of this approach is that the number of features is multiplied by the size of the PoS tag
Metric TerrorCat: Baseline Weighted wins PoS-features GenPoS-features No 2007 data (GenPoS) Other: BLEU mp4ibm1 MTeRater-Plus AMBER ti meteor-1.3-rank
fr-en
de-en
es-en
cs-en
*-en
en-fr
en-de
en-es
en-cs
en-*
0.73 0.73 0.87 0.86 0.89
0.74 0.74 0.76 0.77 0.80
0.82 0.82 0.80 0.84 0.80
0.76 0.79 0.86 0.88 0.95
0.76 0.77 0.82 0.84 0.86
0.70 0.75 0.76 0.80 0.85
0.81 0.81 0.86 0.85 0.84
0.69 0.69 0.74 0.75 0.81
0.84 0.84 0.87 0.90 0.90
0.76 0.77 0.81 0.83 0.85
0.85 0.08 0.93 0.94 0.93
0.48 0.56 0.90 0.63 0.71
0.90 0.12 0.91 0.85 0.88
0.88 0.91 0.95 0.88 0.91
0.78 0.42 0.92 0.83 0.86
0.86 0.61 – 0.84 0.85
0.44 0.91 – 0.54 0.30
0.87 0.71 – 0.88 0.74
0.65 0.76 – 0.56 0.65
0.70 0.75 – 0.70 0.63
Table 2: System-level Spearman’s rank correlation coefficients (ρ) between different variants of TerrorCat and human judgements, based on WMT’11 data. Other metric submissions are shown for comparison. Highest scores per language pair are highlighted in bold separately for TerrorCat variants and for other metrics.
set. Additionally, too specific distinctions can cause data sparsity, especially on the sentence level. As shown by the results, PoS-tag splitting of the features is successful on the system level, but quite hurtful to the sentence-level correlations. The poor performance on the sentence level can be attributed to the aforementioned data sparsity: the number of different features is higher than the number of words (and hence, the biggest possible number of errors) in the sentences. However, we cannot quite explain, how a sum of these less reliable sentence-level scores leads to more reliable system-level scores. To somewhat relieve data sparsity we defined subsets of the original PoS tag sets, mostly leaving out morphological information and keeping just the general word types (nouns, verbs, adjectives, etc.). This reduced the number of PoS-tags (and thus, the number of input features) from 2 to 4 times and produced further increase in system-level and a smaller decrease in sentence-level scores, see GenPoS results. To avoid splitting the metric into different versions for system-level and sentence-level, we gave priority to system-level correlations and adopted the generalized PoS-splitting of the features. Out-of-Domain Data The human ranking data from WMT of previous years do not constitute a completely homogeneous dataset. For starters, the test sets are 67
taken from different domains (News/News Commentary/Europarl), whereas the 2012 test set is from the News domain only. Added to this, there might be a difference in the manual data, coming from different organization of the competition – e.g. WMT’07 was the only year when manual scoring of the translations with adequacy/fluency was performed, and ranking had just been introduced into the competition. Therefore we tested whether some subsets of the training data can result in better overall scores. Interestingly enough, leaving out News Commentary and Europarl test sets caused decreased correlations, although these account for just around 10% of the training data. On the other hand, leaving out the data from WMT’07 led to a significant gain in overall performance. 3.2
Error Meta-Analysis
To better understand why sentence-level correlations are low, we analyzed the core of TerrorCat – its pairwise classifier. Here, we focus on the most successful variant of the metric, which uses general PoStags and was trained on the WMT manual rankings from 2008 to 2010. Table 4 presents the confusion matrices of the classifier (one for precision and one for recall), taking into consideration the confidence estimate. Evaluation is based on the data from 2011; the prediction data was mirrored in the same way as for
Metric TerrorCat: Baseline Weighted wins PoS-features GenPoS-features No 2007 data (GenPoS) Other: mp4ibm1 MTeRater-Plus AMBER ti meteor-1.3-rank
fr-en
de-en
es-en
cs-en
*-en
en-fr
en-de
en-es
en-cs
en-*
0.20 0.20 0.13 0.16 0.21
0.22 0.23 0.18 0.24 0.30
0.33 0.33 0.24 0.31 0.33
0.25 0.25 0.15 0.22 0.23
0.25 0.25 0.18 0.23 0.27
0.30 0.31 0.27 0.27 0.29
0.19 0.20 0.15 0.18 0.20
0.24 0.24 0.15 0.22 0.23
0.20 0.20 0.17 0.19 0.20
0.23 0.24 0.19 0.22 0.23
0.15 0.30 0.24 0.23
0.16 0.36 0.26 0.25
0.18 0.45 0.33 0.38
0.12 0.36 0.27 0.28
0.15 0.37 0.28 0.29
0.21 – 0.32 0.31
0.13 – 0.22 0.14
0.13 – 0.31 0.26
0.06 – 0.21 0.19
0.13 – 0.27 0.23
Table 3: Sentence-level Kendall’s rank correlation coefficients (τ ) between different variants of TerrorCat and human judgements, based on WMT’11 data. Other metric submissions are shown for comparison. Highest scores per language pair are highlighted in bold separately for TerrorCat variants and for other metrics.
the training set. Our aim was to measure the bias of the classifier towards first or second translations in a pair (which is obviously an undesired effect). It can be seen that the confusion matrices are completely symmetrical, indicating no position bias of the classifier – even lower-confidence decisions are absolutely consistent. To make sure that this can be attributed to the mirroring of the training set, we re-trained the classifier on non-mirrored training sets. As a result, 9% of the instances were labelled inconsistently, with the average confidence of such inconsistent decisions being extremely low (2.1%, compared to the overall average of 28.4%). The resulting correlations have slightly dropped as well – all indicating that mirroring the training sets does indeed remove the positional bias and leads to slightly better performance. Looking at the confusion matrices overall, most decisions fall within the main diagonals (i.e. the cells indicating correct decisions of the classifier). Looking strictly at the classifier’s decisions, the recalls and precisions of the non-tied comparison outputs (“”) are 57% precision, 69% recall. However, such strict estimates are too pessimistic in our case, since the effect of the classifier’s decisions is proportional to the confidence estimate. On the sentence level it means that low-confidence decision errors have less effect on the total score of a system. A definite source of error is the instability of the individual translation errors on the sentence level, an 68
effect both Addicter and Hjerson are known to suffer from (Fishel et al., 2012). The precision of the classifier predictably drops together with the confidence, and almost half of the misclassifications come from unrecognized equivalent translations – as a result the recall of such pairs of equivalent translations is only 20%. This can be explained by the fact that the binary classifier was trained on instances with just these two labels and with no ties allowed. On the other hand the classifier’s 0-confidence decisions have a high precision (84%) on detecting the equivalent translations; after re-examining the data it turned out that 96% of the 0-confidence decisions were made on input feature vectors containing only zero frequency differences. Such vectors represent pairs of sentences with identical translation error analyses, which are very often simply identical sentences – in which case the classifier cannot (and in fact, should not) make an informed decision of one being better than the other.
4
Related Work
Traditional MT metrics such as BLEU (Papineni et al., 2002) are based on a comparison of the translation hypothesis to one or more human references. TerrorCat still uses a human reference to extract features from the error analysis with Addicter and Hjerson, but at the core, TerrorCat compares hypotheses not to a reference, but to each other.
Manual label < = >
0.6–1.0 81% 9% 10%
Classifier Output and Confidence: Precision < < or > > 0.3–0.6 0.0–0.3 0.0 0.0–0.3 0.3–0.6 60% 45% 8% 32% 23% 17% 23% 84% 23% 17% 23% 32% 8% 45% 60%
0.6–1.0 10% 9% 81%
0.6–1.0 23% 5% 3%
Classifier Output and Confidence: Recall < < or > > 0.3–0.6 0.0–0.3 0.0 0.0–0.3 0.3–0.6 18% 28% 1% 20% 7% 9% 26% 20% 26% 9% 7% 20% 1% 28% 18%
0.6–1.0 3% 5% 23%
Manual label < = >
Table 4: The precision and recall confusion matrices of the classifier – judgements on whether one hypothesis is worse than, equivalent to or better than another hypothesis are compared to the classifier’s output and confidence.
It is thus most similar to SVM-RANK and Tesla metrics, submissions to the WMT’10 shared metrics task (Callison-Burch et al., 2010) which also used SVMs for ranking translations. However, both metrics used SVMrank (Joachims, 2006) directly for ranking (unlike TerrorCat, which uses a binary classifier for pairwise comparisons). Their features included some of the metric outputs (BLEU, ROUGE, etc.) for SVM-RANK and similarity scores between bags of n-grams for Tesla (Dahlmeier et al., 2011).
5
Conclusions
We introduced the TerrorCat metric, which performs pairwise comparison of translation hypotheses based on frequencies of automatically obtained error categories using a binary classifier, trained on manually ranked data. The comparison outcome is then converted to a numeric score for every sentence or document translation by averaging out the number of wins per translation system. Our submitted system achieved an average system-level correlation with human judgements in the WMT’11 development set of 0.86 for translation into English and 0.85 for translations from English into other languages. Particularly good performance was achieved on translations from English into Czech (0.90) and back (0.95). Sentence-level scores are more modest: average 0.27 for translation into English and 0.23 for those out of English. The scores remain to be checked against the human 69
judgments from WMT’12. The introduced TerrorCat metric has certain dependencies. For one thing, in order to apply it to new languages, a training set of manual rankings is required – although this can be viewed as an advantage, since it enables the user to tune the metric to his/her own preference. Additionally, the metric depends on lemmatization and PoS-tagging. There is a number of directions to explore in the future. For one, both Addicter and Hjerson report MT errors related more to adequacy than fluency, although it was shown last year (Parton et al., 2011) that fluency is an important component in rating translation quality. It is also important to test how well the metric performs if lemmatization and PoStagging are not available. For this year’s competition, training data was taken separately for every language pair; it remains to be tested whether combining human judgements with the same target language and different source languages leads to better or worse performance. To conclude, we have described TerrorCat, one of the submissions to the metrics shared task of WMT’12. TerrorCat is rather demanding to apply on one hand, having more requirements than the common reference-hypothesis translation pair, but at the same time correlates rather well with human judgements on the system level.
References Chris Callison-Burch, Philipp Koehn, Christof Monz, Kay Peterson, Mark Przybocki, and Omar Zaidan. 2010. Findings of the 2010 joint workshop on statistical machine translation and metrics for machine translation. In Proceedings of the Joint Fifth Workshop on Statistical Machine Translation and MetricsMATR, pages 17–53, Uppsala, Sweden. Daniel Dahlmeier, Chang Liu, and Hwee Tou Ng. 2011. Tesla at wmt 2011: Translation evaluation and tunable metric. In Proceedings of the Sixth Workshop on Statistical Machine Translation, pages 78–84, Edinburgh, Scotland. Mark Fishel, Ondˇrej Bojar, and Maja Popovi´c. 2012. Terra: a collection of translation error-annotated corpora. In Proceedings of the 8th LREC, page in print, Istanbul, Turkey. Mark Hall, Eibe Frank, Geoffrey Holmes, Bernhard Pfahringer, Peter Reutemann, and Ian H. Witten. 2009. The weka data mining software: An update. SIGKDD Explorations, 11. Thorsten Joachims. 2006. Training linear SVMs in linear time. In Proceedings of the ACM Conference on Knowledge Discovery and Data Mining (KDD), Philadelphia, USA. Percy Liang, Ben Taskar, and Dan Klein. 2006. Alignment by agreement. In Proceedings of the HLTNAACL Conference, pages 104–111, New York, NY. Kishore Papineni, Salim Roukos, Todd Ward, and WeiJing Zhu. 2002. Bleu: A method for automatic evaluation of machine translation. In ACL ’02: Proceedings of the 40th Annual Meeting on Association for Computational Linguistics, pages 311–318, Morristown, NJ, USA. Association for Computational Linguistics. Kristen Parton, Joel Tetreault, Nitin Madnani, and Martin Chodorow. 2011. E-rating machine translation. In Proceedings of the Sixth Workshop on Statistical Machine Translation, pages 108–115, Edinburgh, Scotland. John C. Platt. 1998. Using analytic qp and sparseness to speed training of support vector machines. In Proceedings of Neural Information Processing Systems 11, pages 557–564, Denver, CO. Maja Popovi´c and Hermann Ney. 2011. Towards automatic error analysis of machine translation output. Computational Linguistics, 37(4):657–688. Helmut Schmid. 1995. Improvements in part-of-speech tagging with an application to german. In Proceedings of the ACL SIGDAT-Workshop, Dublin, Ireland. Drahom´ıra Spoustov´a, Jan Hajiˇc, Jan Votrubec, Pavel Krbec, and Pavel Kvˇetoˇn. 2007. The best of two worlds: Cooperation of statistical and rule-based taggers for
70
Czech. In Proceedings of the Workshop on BaltoSlavonic Natural Language Processing, ACL 2007, pages 67–74, Praha. Daniel Zeman, Mark Fishel, Jan Berka, and Ondˇrej Bojar. 2011. Addicter: What is wrong with my translations? The Prague Bulletin of Mathematical Linguistics, 96:79–88.