Available online at www.sciencedirect.com
ScienceDirect Procedia Computer Science 57 (2015) 996 – 1004
3rd International Conference on Recent Trends in Computing 2015 (ICRTC-2015)
Test Case Generation and Optimization using UML Models and Genetic Algorithm Namita Khuranaa , R.S Chillarb,* a Deptt. Of Comp. Sc. and Applications, M.D.U, Rohtak-124001,India b Deptt. Of Comp. Sc. and Applications, M.D.U, Rohtak-124001,India
Abstract Software testing plays an important role in software development because it can minimize the development cost. Software testing approaches are divided into three parts i.e. code based testing, specification based testing and model based testing. In model based testing, the testing begins at design phase. So, early detection of faults can be achieved by using this approach further reducing time, cost and efforts of the developer to a large extent. In this paper we propose a technique for generating test cases using both UML sequence diagram and state chart diagram. Our approach is to convert Sequence Diagram into Sequence Graph and then to convert State Chart Diagram into State chart Graph. Finally System Testing Graph (SYTG) is formed by combining the two Graphs. From the graphs different control flow sequences also called test cases are identified and then optimized using evolutionary Algorithm, called Genetic Algorithm. Although State chart did better at revealing unit level faults and sequence diagram is better at removing integration level faults, but after integrating the two graphs, generated test cases are appropriate for system testing and to identify Error handling, correctness, pre-post condition faults, interaction, message sequence faults and scenario faults. © 2015 Published by Elsevier B.V. This is an open access article under the CC BY-NC-ND license
© 2015 The Authors. Published by Elsevier B.V. (http://creativecommons.org/licenses/by-nc-nd/4.0/). Peer-review underresponsibility responsibility of organizing committee the 3rd International Conference onTrends Recent in Computing Peer-review under of organizing committee of theof 3rd International Conference on Recent in Trends Computing 2015 2015 (ICRTC-2015). (ICRTC-2015)
Keywords: Sequence Diagram; State Chart Diagram; System Testing Graph; Online Voting system; Genetic Algorithm;
* Corresponding author. Tel.: 9717453722 E-mail address:
[email protected]
1877-0509 © 2015 Published by Elsevier B.V. This is an open access article under the CC BY-NC-ND license (http://creativecommons.org/licenses/by-nc-nd/4.0/). Peer-review under responsibility of organizing committee of the 3rd International Conference on Recent Trends in Computing 2015 (ICRTC-2015) doi:10.1016/j.procs.2015.07.502
Namita Khurana and R.S Chillar / Procedia Computer Science 57 (2015) 996 – 1004
997
1. INTRODUCTION Software testing is a deal between time, budget and quality. In a typical software development project more than 50% of the cost is spent on software testing in terms of time and cost. Testing is not only just debugging. The purpose of testing can be quality assurance, verification and validation, or reliability estimation. The software testing depends mainly on three main phases: test case generation, test execution and test evaluation. The later two parts are easy to be implemented. However first part require knowledge up to a certain level. It is a very challenging task for analysis of Unified modelling language (UML) models since the information about a system is distributed across several model views. UML models are considered to reduce the complexity of the problem with the increase in product sizes and complexities. A sequence diagram explains how objects communicate with each other in terms of a sequence of messages. Also indicates the life spans of objects relative to those messages. A sequence diagram shows how processes interact with one another and in what order. Fig 1(a) shows sequence diagram for online voting system. On the other hand a state chart diagram, also called a state machine diagram is an illustration of the states an object can attain as well as the transitions between those states in the Unified Modelling Language (UML). In this context, a state defines a stage in the evolution or behaviour of an object, which is a specific entity in a program or the unit of code representing that entity. Fig 2(a) shows state chart diagram for online voting system. The consistency between the two diagrams is checked by verifying that the messages in the sequence diagrams trigger states in state chart diagrams [13]. The source of test case generation are sequence diagram and state chart diagram. Then sequence diagram is converted into sequence diagram graph and state chart diagram is converted into state chart diagram graph. Then an algorithm is proposed for System Testing Graph which is formed by integrating the two graphs. Then Genetic Algorithm is used to generate and optimize the test cases from SYTG. Our generated test suite aims to cover various faults. Also whenever the two UML methods are combined it will cover all the possibilities. The paper is structured as follows. In section 2, we discuss the existing work done on test case generation techniques using different UML diagrams. In section 3, we discuss sequence diagram and state chart diagram for online voting system and their conversion to Graph. In section 4 the graphs are integrated into System Testing Graph. In section 5, genetic algorithm is applied for generating and optimizing the test cases generated using the given example. In section 6, we give the case study for test cases generated using the proposed algorithm on online voting system. Finally in section 7, we conclude the paper by giving the conclusion and future work. Last section gives the used references.
2.
Related Work
In this section, we survey various research papers related to test case generation techniques using UML diagrams. Rajiv mall [4] proposed an algorithm, to generate test case from a combination of use case diagram and sequence diagram. First, they convert the use case diagram into use case graph and then sequence diagram into sequence graph. After that the two graphs are integrated and a System Graph is generated. How the two graphs are integrated is not clearly mentioned. Also the test cases generated are not optimized. Abinash Tripathy and Anirban Mitra [3] presented an approach to generate test cases by using together UML Activity diagram and Sequence Diagram [3]. In this approach first the activity diagram is being converted into activity graph and the sequence diagram is being converted into sequence graph and then the two graphs Sequence Graph & Activity Graph are integrated to form system Graph. Then the System Graph is being traversed to form the test cases by using Depth First Search Method (DFS). This approach has been also applied on an example of ATM card validation.
998
Namita Khurana and R.S Chillar / Procedia Computer Science 57 (2015) 996 – 1004
Ranjita Kumari Swain, Vikas Panthi and Praful Kumar Behera have generated the test cases using activity diagrams [2]. In that approach, first an activity flow graph is derived from activity diagram. AFG is traversed by depth first traversal technique. Next, an algorithm is proposed to generate all activity paths. Finally, test cases are generated using activity path coverage criteria. Swagatika Dalai, Arup Acharya and Durga Prasad Mohapatra [9] presented an approach to generate test cases for object oriented systems using Combinational Uml Models. In this approach Sequence-Activity Graph is formed and then traversed to generate test cases which are able to minimize test case explosion. But the test cases are not optimized. 3.
Proposed Approach
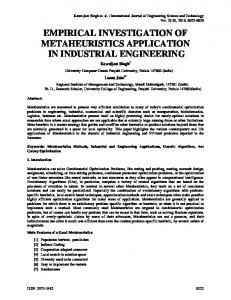
In our proposed approach a system under test is being converted into a graph called System Testing Graph (SYTG) which is formed after integration of state chart diagram and sequence diagram. We first convert state chart diagram into state chart diagram graph and sequence diagram into sequence diagram graph. Then these two graphs are integrated to form System Testing Graph. The information necessary to derive test cases is pre stored into this graph. Genetic Algorithm is being applied on this graph to generate and optimize the test cases automatically based on a coverage criteria and a fault model. In the following section we discuss our proposed approach. 3.1 Conversion of SCD into SCDG In this section, we first define state chart diagram and state chart diagram graph. Afterwards we present the technique to transform SCDG from SCD. A state chart diagram figures the dynamic flow of control from state to state within a system. Definition of SCDG: The State Chart Diagram Graph is defined as: SCDG ={S, T, GC, Si, Sf} S=States in state chart diagrams represent a set of those value combinations, in which an object behaves the same in response to events. T= A transition represents the change from one state to another. GC=A guard condition is a condition that has to be met in order to enable the transition to which it belongs: Guard conditions can be used to document that a certain event, depending on the condition, can lead to different transitions. Si=Initial state, represents the source of all objects. It is not a normal state, because objects in this state do not yet exist. Sf= Final state represents the end of the object’s existence. A final state is not a real state, because the objects in this state do not exist anymore. Now we discuss the conversion of SCD into SCDG. Each state in the state chart diagram can be mapped as a node. Each transition from one state to next state is used to represent the sequential dependency of one on another. Figure 1(a) represents the state chart diagram for online voting system. Figure 1(b) is the State chart Diagram Graph for the state chart diagram shown in fig 1(a).
Namita Khurana and R.S Chillar / Procedia Computer Science 57 (2015) 996 – 1004
Fig-1(a) State Chart Diagram for Online voting System
999
Fig-1(b) State Chart Diagram Graph
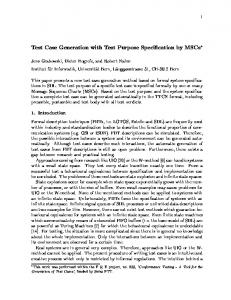
3.2 Conversion of SD into SDG This section first defines the sequence diagram graph. After that transformation of SDG from SD is being presented. Definition of SDG: The sequence diagram graph is defined as : SDG = {State, Edge, First, Last} where State is set of all nodes which represents various states of a scenario. Edge set of edges representing transaction between different states. First is the initial node representing the starting state. Last is the final node representing the final state. In order to formulate a method, we define a scenario as a quadruple Scenario : < Id, Start state, message, Successful/Unsuccessful>.Id is a unique number used to identify each scenario. Start state is the starting point of the scenario that is where a scenario starts. Message set denotes the set of all events that occur in the operation scenario. Successful/Unsuccessful State is the state that a system enters after the completion of a scenario. This is the last state which fully depends on the user’s choice. An event is a message denoted by a tuple, Event: Where message Name is the name of the message with its signature, from is the sender of the message, to is the receiver of the message and the optional part is the Guard Condition depending on which the Event will take place. An Event with * indicates the iterative event. Figure 2(a) represents the sequence diagram for online voting system. Figure 2(b) is the SDG for the sequence diagram shown in fig 2(a). It has four scenarios as shown in the figure 2(c).
1000
Namita Khurana and R.S Chillar / Procedia Computer Science 57 (2015) 996 – 1004
Fig-2(a) Sequence Diagram for Online Voting System
Fig-2(b) Sequence diagram Graph
4.
Fig:-2(c) Four Scenarios represented in the form of tetrads
Integration of SDG and SCDG into SYTG
After the creation of SDG and SCDG, the next step is to integrate the two graphs in a single Graph called System Testing Graph (SYTG). Next we define SYTG. Definition of System testing Graph (SYTG): The SYTG is defined as SYTG={S,T,F,L}, where State = State( SDG) U State (SCDG) is the set of all the states of sequence diagram and state chart diagram. T = T(SDG) U T(SCDG) , where T is union of Transitions of both State Chart Graph and Sequence Graph. F is the first node of SCDG and L is the final set of node of SYTG. Now starting with the State Chart Graph, we integrate the two graphs . Fig 3 shows the SYTG after the combination of two Graphs SDG and SCDG.
Namita Khurana and R.S Chillar / Procedia Computer Science 57 (2015) 996 – 1004
Fig 3:- SYTG formed after the integration of two Graphs SDG and SCDG
Now we present the algorithm to generate SYTG from SDG and SCDG Algorithm 1: GENERATE-SYTG Input : State Chart Graph(SCDG) and Sequence Graph (SDG) Output: System Testing Graph (SYTG) 1. P = Identify all the paths of (SCDG). 2. For each path pi ϵ P do 3. SCj = SCi //Start with the SCi the starting node 4. TÅɸ 5. For each state SCj of path pi do 6. If ci ϵ SCi //current state having multiple derived states 7. α = SCi-1 Æ SDG //Edge from the previous node to the sequence Graph 8. β = SDG(Last) ÆSCi+1 // edge from the last node of SDG to the next node of SCDG. Edge from unsuccessful final node of SDG to node SCi+1 where the value of V=0 else edge from Successful final node of SDG to node SCi+1 where the value of V=1 9. End If 10. TÅT U T1 11. If ci ϵ\ SCi 12. ϒ=SCiÆSCi+1// There is an edge from the present node to the next node of the same State Chart Graph. 13. End If 14. End For 15. End
1001
1002
5.
Namita Khurana and R.S Chillar / Procedia Computer Science 57 (2015) 996 – 1004
Generation and Optimization of test cases
After collecting all the information in the SYTG Graph, our next step is to generate test cases. After generating test cases those test cases need to be optimized using any evolutionary algorithm. G.A is one of the evolutionary algorithm, we have applied on SYTG (System Testing Graph) to generate and optimize test cases. Our proposed algorithm is as follows:Algorithm 2: GENERATE-OPTIMIZE TESTCASES Input: - System Graph (SYTG) Output: - Optimized test case 1. Identify all the paths P= {p1, p2, p3, p4, p5…..} from start node to a final node in SYTG. 2. Assign weights to the individual nodes as the actual weight of the child node is weight of the parent node .if a child has multiple parents then weight of that node is the sum of the weights of the parent’s node. Also weight is allocated to paths from left to right. 3. Calculate the cost (x) of each path as the cost of that path is sum of the weights of that path. 4. Apply genetic algorithm to the graph (SYTG). 5. Calculate the fitness value a. For each path cost(x) has been calculated. b. Apply the fitness function as F(x)=x*x c. Now calculate the probability for individual as p(i)=F(x)/ƩF(x) 6. We need to choose the best Individuals from existing large initial population so that we can mate them to produce a new generation of solutions. a. For choosing the best individuals probability range is divided into bins, the size of the bin is based on the relative fitness of the solution b. Now we will generate random values and will check the bin where those values fall into, picking the individuals for the next generation. 7. Perform Crossover on the chromosomes pair wise. First mate first two individuals together by applying single point crossover from 4th bit from right. For next two pairs apply single point crossover from 3 rd bit from right. 8. Perform mutation by mutating every fourth bit only in case when random number generated is less than 0.2. 9. This whole process is repeated till the fitness value minimizes or maximum number of generations is reached or all the paths have been covered. 10. Best test path is generated or we can say that the test cases are optimized. 11. End. 6.
Case Study
The case study is being done on the example of online voting system. As we have already integrated the Sequence Graph and State Chart Graph to form a system Graph(SYTG).Now we will show the mathematical presentation of Genetic Algorithm on SYTG for online Voting system further shown in the form of tables. The possible paths for generated from the above graph are:Srcnode: SC1=>SC2=>S1=>S3=>S4=>S6=>S7=>S8=>S9=>S10=>S11=> Successful=>SC4=>SC5=>SC6=>SC7=>SC8=>final node, cost=153 Srcnode: SC1=>SC2=>S1=>S3=>S4=>S5=>S6=>S7=>S8=>unsuccessful=>SC3=>final node, cost=101 Srcnode: SC1=>SC2=>S1=>S3=>S4=>S5=>unsuccessful=>SC3=>final node, cost=98 Srcnode: SC1=>SC2=>S1=>S2=>unsuccessful=>SC3=>final node, cost=90
Namita Khurana and R.S Chillar / Procedia Computer Science 57 (2015) 996 – 1004
Table 1:- Fitness of Initial Population Path No. 1 2 3 4
Chromosome 01011010 01100010 01100101 10011001 Sum
X 90 98 101 153
X*X 8100 9604 10201 23409 51314
Probability 0.157851 0.187161 0.198795 0.45619
Cumulative Probability 0.157851 0.345012 0.543807 1
Crossover 10011001 10011001 01100101 01100010
Mutation 10011001 10011001 01110101 01100010
Probability 0.333884 0.333884 0.195247 0.136982
Cumulative Probability 0.333884 0.667768 0.863015 1
Crossover 10011001 10011001 10011010 01100001
Mutation 10011001 10001001 10011010 01100001
Probability 0.310864 0.249246 0.314940 0.124948
Cumulative Probability 0.310864 0.560110 0.875050 1
Crossover 10011001 10001001 10011001 01100010
Mutation 10011001 10011001 10011001 01100010
Probability 0.293231 0.293231 0.293231 0.120304
Cumulative Probability 0.293231 0.586462 0.879693 1
Associated bin 0-0.2 0.2-0.4 0.4-0.6 0.6-1
Table2:- Selection of New generation Random No. 0.8158 0.9564 0.1257 0.5046
Falls into bin 4 4 2 3
Selection 10011001 10011001 01100010 01100101
Table 3:-Fitness of new generation Path No. 1 2 3 4
Chromosome 10011001 10011001 01110101 01100010 Sum
X 153 153 117 98
X*X 23409 23409 13689 9604 70111
Associated bin 0-0.33 0.33-0.66 0.66-0.88 0.88-1
Table 4:- Selection of new generation Random No. 0.2094 0.1428 0.4319 0.8893
Falls into bin 1 1 2 4
Selection 10011001 10011001 10011001 01100010
Table 5:-Fitness of new generation Path No. 1 2 3 4
Chromosome 10011001 10001001 10011010 01100001 Sum
X 153 137 154 97
X*X 23409 18769 23716 9609 75303
Associated bin 0-0.31 0.31-0.6 0.6-0.88 0.8-1
Table 6 :-Selection of New generation Random No. 0.1834 0.2131 0.6945 0.9089
Falls into bin 1 2 3 4
Selection 10011001 10001001 10011010 01100001
Table 7:- Fitness of next generation Path No. 1 2 3 4
Chromosome 10011001 10011001 10011001 01100010 Sum
X 153 153 153 98
X*X 23409 23409 23409 9604 79831
Associated bin 0-0.3 0.3-0.6 0.6-0.8 0.8-1
1003
1004
Namita Khurana and R.S Chillar / Procedia Computer Science 57 (2015) 996 – 1004
The difference between the values of chromosomes between the two generations started decreasing. The cost value 153 indicates that the algorithm terminates. The optimal path traversed first is path 4 with cost value 153. 7.
Conclusion and Future work
The Proposed approach is to use Sequence diagram and State Chart Diagram for generating test cases and to use Genetic Algorithm to optimize those test cases. The benefit for using this method is that maximum number of test cases is generated; no more valid test cases can be generated apart from this. State chart diagram is used in this method; in state chart a one state can lead us to multiple states which lead us to optimum result. A sequence diagram covers maximum number of interactions between the objects during the operation. So in case integrating two UML diagrams, it will cover maximum number of test cases or we can say all the possibilities. The system is also able to solve faults like operational faults, integration, scenario faults, Error handling, and pre-post condition faults. We used Rational Rose software to produce UML diagrams. Also we have used genetic algorithm for optimization of test cases, which gives the optimum result. During this whole process, we have tried to solve many problems but still some of the problem related to combination of Sequence and State Chart remain unresolved. In our Future work, we will try to use this technique with other UML Diagrams and also we can integrate one or more UML diagrams so that system is able to handle all type of Errors. Also this is not at automated approach, so in our future work we can automate this whole process. References [1] http://courses.cs.washington.edu/courses/cse473/06sp/GeneticAlgDemo/gaintro.html [2] Ranjita Kumari Swain, Vikas Panthi, Prafulla Kumar Beher“Generation of test cases using Activity Diagram” International Journal of Computer Science and Informatics, ISSN (PRINT): 2231 –5292, VolumeǦ3, IssueǦ2, 2013 [3] Abinash Tripathy and Anirban Mitra, “Test Case Generation Using Activity Diagram and Sequence Diagram” Proceedings of ICAdC, AISC 174, pp. 121– 129. Springerlink.com © Springer India 2013 [4] Monalisa Sharma, Debashish Kundu,Rajib Mall, “Automatic Test Case Generation from UML Sequence Diagrams” the proceeding of IEEE conference on software maintenance @2007 [5] Supaporn Kansomkeat, Phachayanee Thiket and Jeff Offutt,“Generating Test Cases from UML Activity Diagrams using the ConditionClassification Tree Method” 2nd International Conference on Software Technology and Engineering (ICSTE) @ 2010 IEEE. [6] Xiajiong Shen and Qian Wang PeipeiWang and BoZhou, “A Novel Technique Proposed for Testing of Object Oriented Software Systems” @2009 IEEE. [7] Nirmal Kumar Gupta, Mukesh Kumar Rohil, “Improving GA based Automated Test Data Generation Technique for Object Oriented Software” 2013 3rd IEEE International Advance Computing Conference (IACC). [8] Esmaeil Mirzaeian, Samad Ghaderi Mojaveri, Homayun Motameni, Ahmad farahi, “An optimized approach to generate object oriented software test case by Colored Petri Nets”, 2010 2nd International Conference on Software Technology and Engineering (ICSTE) @ IEEE [9] Swagatika Dalai ,Arup Acharya and Durga Prasad Mohapatra , “Test case generation for concurrent object oriented systems using Combinational Uml Models.”IJCA 2012. [10] Baikuntha Narayan Biswal, Pragyan Nanda, Durga Prasad Mohapatra “A Novel Approach for Scenario Based Test Case Generation”International Conference on Information Technology © 2008 IEEE Computer Society [11] R. Mall. Fundamentals of Software Engineering. Prentice Hall, 3rd edition, 2009. [12] www.tutorialspoint.com/uml/uml_statechart_diagram.html [13] Yves Dumond, Didier Girardet, Flavio Oquendo “A relationship between sequence and state chart diagrams”. [14] Namita Khurana, R.S Chhillar “Literature Review of Test Case Generation Techniques for Object Oriented System”.