The Weather Research and Forecast (WRF) Model is a new community model ... wave confined to a channel, and steady flow over a simple two-dimensional ...
9.2
TESTING AND VERIFICATION OF THE WEATHER RESEARCH AND FORECAST (WRF) MODEL S. B. Trier, C. A. Davis, and W. Wang National Center for Atmospheric Research Boulder, Colorado 1.
physical parameterizations. The testing to date has focused on i) real time forecasts, and ii) a set of simulations of idealized flows and case studies of observed meteorological events.
INTRODUCTION
The Weather Research and Forecast (WRF) Model is a new community model designed for operational weather prediction and research applications. Both height and mass vertical coordinate versions of WRF exist. Tests indicate nearly identical solutions for both model dynamic cores. Current and future WRF development is focused on the mass-coordinate version, since its upper boundary is not constrained to be a level surface and the conversion from nonhydrostatic to hydrostatic versions of the model is greatly facilitated in this coordinate system. The WRF mass-coordinate model represents a significant improvement over preexisting nonhydrostatic mesoscale numerical weather prediction (NWP) models, which typically use advective (nonconservative) formulations of the governing equations and low order numerical integration methods. The WRF model integrates the flux (conservative) form equations for prognostic variables, and nonconserved variables (e.g., pressure, temperature) are diagnosed from conserved variables. The model is Eulerian and uses a third-order Runge-Kutta time integration scheme and high-order spatial discretizations for advections. The more accurate numerical integration techniques in the WRF masscoordinate model come with no significant additional cost compared to those in preexisting nonhydrostatic models, and thus, constitute a major improvement in efficiency. More detailed discussion of the dynamics formulation of WRF can be found (at this writing) at http : ==www:mmm:ucar:edu=wrf =users=document:html
2.
In this paper we describe preliminary efforts to evaluate the performance of the WRF model and its Corresponding author address: Dr. Stanley B. Trier, National Center for Atmospheric Research, P.O. Box 3000, Boulder CO 80307-3000
The idealized simulations include a supercell thunderstorm, a two-dimensional squall line, a baroclinic wave confined to a channel, and steady flow over a simple two-dimensional obstacle. These particular simulations were selected as tests since similar simulations have already been performed with preexisting models. Aspects of some of these flows, including the relatively small horizontal scale (e.g., the supercell thunderstorm), and two-dimensionality (e.g., the squall line and flow over a simple barrier) allow for evaluation of simulations integrated at very fine resolution ( x=0.1-2 km). Several of these tests are adiabatic and thus require the use of only a few physical parameterizations. In general, this set of simulations is designed primarily to test the performance of the model’s dynamic core. The simulations of observed cases were selected to examine model performance and sensitivities within a wide range of different meteorological regimes. Because of the requirement of three-dimensional grids for simulations of phenomena in realistic horizontally heterogeneous environmental conditions, and the relatively broad scale of many of these phenomena and their associated forcings, model grid spacings are typically coarser ( x=10-30 km) than for the idealized cases. This factor, combined with importance of diabatic processes in many of these meteorological regimes, required the use of a greater number of subgrid physical parameterizations than for the idealized cases. The observed cases include the development and intensification stages of both midlatitude (24-25 January 2000) and tropical (4-6 August 2001) cyclones, the southward progression of a shallow arctic cold front in the lee of steep topography (10-12 December 2000), and a multiday episode of organized mesoscale deep convection (27-29 May 1998) associated with a convectively generated mesoscale vortex (MCV). Representative cases for additional meteorological situations, such as, a west coast frontal cyclone, an outbreak of coastal stratus and fog, and diurnally-forced circulations in the vicinity of significant topography are planned to be added to the existing set of test cases in the near future.
4
.
The WRF model is equipped with subgrid physical parameterizations for precipitation microphysics, cumulus convection, longwave and shortwave radiation, the surface layer, the land surface, the boundary layer, and eddy diffusion. Since WRF has been designed for use as both an operational and a research model, different options are available for these parameterizations that vary significantly in complexity and sophistication. Complete listings, brief descriptions, and references providing more detail about all parameterization options (for the most recent version 1.2.1) are found (at this writing) in the WEB document http : ==www:mmm:ucar:edu=wrf =users=document:html
IDEALIZED SIMULATIONS AND CASE STUDIES
.
4
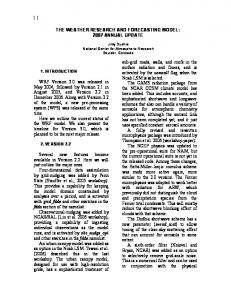
As an example of a current test case, we present results from the simulation of tropical cyclone Barry, which intensified in the Gulf of Mexico, prior to landfall in northwestern Florida on 6 August 2001 (Fig. 1). For the control simulation, the modified Betts and Miller (1986) cumulus parameterization (Janjic 1990, 1994, 2000), the NCEP simple ice microphysics parameterization (Hong et al. 1998), and the MRF PBL parameterization (Hong and Pan 1996) was used on a 10km horizontal grid. The northward track of the simulated cyclone (not shown) was similar to that observed (Fig. 1b). At 48 h, the simulated lowest surface pressure
(1000 hPa) was higher than the 992 hPa estimated from aircraft reconnaissance observations (Fig. 1), however, this discrepancy may be partly related to a high bias in the surface pressure in the 40-km ETA analysis used to initialize the control simulation. Both the deepening of the simulated surface cyclone and its maximum wind speeds of 30 m s 1 at 48 h were similar to observations. A simulation that used a coarser ( x = 20 km) horizontal grid spacing evinced precipitation structure that was similar to the control simulation, with a central SLP that was only 3 hPa lower at 0000 UTC 6 August (Fig. 2). However, a strong sensitivity to the choice of cumulus parameterization was evident, particularly at the finer horizontal resolution (10 km). Figure 3 compares the surface pressure and the 3-hour cumulative parameterized component of the precipitation at 48 h (0000 UTC 6 August 2001). When the Kain-Fritsch parameterization (1990) is used, precipitation across the entire Gulf of Mexico basin is considerably more active (perhaps unrealistically so), and the central SLP is 8 hPa lower than for control simulation (Fig. 3).
4
At the horizontal resolutions used, both the tropical cyclone ( x = 10,20 km) and the MCV
4
Figure 1. Top: Isotach analysis (kts) of tropical storm Barry at landfall (0451 UTC 6 August 2001). Bottom: Track of tropical storm Barry starting at 1200 UTC 2 August 2001 and ending at 0000 UTC 7 August 2001. Figure obtained from NOAA Hurricane Research Division.
Figure 2. 6-h cumulative total precipitation (mm) valid at 0000 UTC 6 August 2001 for simulations using 10-km (top) and 20-km (bottom) horizontal grid spacing.
two different boundary layer parameterizations currently available. 3.
Figure 3. 3-h cumulative parameterized precipitation (mm) valid at 0000 UTC 6 August 2001 from simulations using Kain-Fritsch (top) and Betts-Miller-Janjic (bottom) cumulus parameterizations. Note that the scale for precipitation is different for the top and bottom panels.
4
( x = 20 km) exhibited sensitivity to the cumulus parameterization and the explicit microphysics. For the tropical cyclone case, the greatest sensitivity was to the cumulus parameterization, whereas for the MCV, the greatest sensitivity was to the explicit microphysical parameterization. For the latter case (not shown), consistent with observations, a simulation using the Chen and Sun (2002) modification of the (Lin et al. 1983) ice physics parameterization, which includes prognostic equations for small ice crystals, snow, and graupel, resulted in larger amounts of resolved precipitation and stronger maximum wind speeds within the MCV circulation than was found for a simulation that used the simpler NCEP two-class ice scheme (Hong et al. 1998). Sensitivity to both the cumulus parameterization and explicit microphysics was negligible for the arctic front simulation, which exhibited very little convection. Sensitivity to these parameterizations was also not particularly strong for the midlatitude cyclone simulation, despite a substantial amount of simulated deep convection near and east of the developing cyclone (not shown). This particular case also did not exhibit significant sensitivity to the
REAL-TIME SIMULATIONS
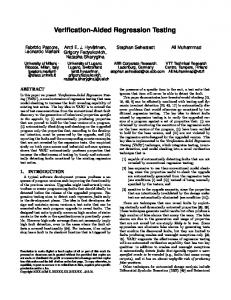
The real-time forecasts are an integral part of the WRF model development. These forecasts have been performed with WRF model regularly since April 2001. The forecasts have been varied according to the purpose of the testing at the time. The forecasts at this writing include twice daily 48-h simulations on a 22-km grid covering the continental United States, and 30-h runs on a 10-km grid located over the central United States, centered on the approximate location of the International H2 O Project (IHOP) field research domain. The model initializes using WRF’s standard initialization package, which interpolates the ETA model 40-km GRIB output to the WRF model grid. Over the past year, a number of physics suites, dynamical cores and domain configurations have been tested each over at least a month long period. These real-time simulations have proven useful in identifying coding errors, systematic errors, and general aspects of model behavior. Precipitation forecasts have been verified by the NOAA National Severe Storms Laboratory (NSSL) since May 2001 and are posted at http : ==www:nssl:noaa:gov=etakf =verf =. The WRF model is being compared with other models such as the ETA model and MM5 research model run in real-time mode. Figure 4 shows precipitation verification scores for May 2002. For sample forecasts over a range of accumulated precipitation threshold values, the 22-km WRF compares favorably with 12-km ETA and 30-km MM5 results. The equitable threat scores from the WRF model are a bit lower at low precipitation thresholds, and a bit higher for high precipitation threshold values. For the bias scores, the WRF model remains closer to 1 for all thresholds than ETA and MM5 models, especially at higher threshold values. This combined with subjective evaluation of individual real-time forecasts suggest some skill for WRF model heavy precipitation forecasts.
In addition to the simple threat and bias scores, more careful examination of WRF precipitation forecasts is underway. Analysis of evolution and diurnal variation of precipitation forecasts (e.g., Davis et al. 2002) will shed more light on the model performance, and point to directions where improvements can be made. 4.
SUMMARY AND PLANNED FUTURE RESEARCH
In this paper we have described some preliminary efforts to evaluate the performance of the WRF model and to establish key sensitivities to physical parameterizations used in the model for different model resolutions. So far our approach has utilized both
WRF ETA MM5
resolutions (e.g., 1-10 km). A systematic examination of the influence of individual parameterizations, and combinations thereof, will be undertaken at similar resolutions for idealized simulations to help generalize results from the case studies. Evaluation of the real-time forecasts will continue. It is recognized, however, that many of the traditional methods of vertification are best suited to largescale flow and precipitation structures. With the advent of NWP models that explicitly resolve finescale circulations, in particular deep convection, there is a recognized need to develop additional vertification measures that are able to better evaluate the simulation of the small-scale, high-amplitude structures, which are also evident in the observations. Finally, extended test periods (several days - two weeks) of sequential forecasts, with fixed model configurations initialized with operational analyses, will be performed. This will also help establish the applicability of the case studies and allow for testing cycling data assimilation systems. 5.
Figure 4. Equitable threat and bias scores for precipitation threshold values of 0.01, 0.10, 0.25, 0.50, 0.75, 1.00, 1.50, 2.00, and 3.00 i nches for the month of May 2002 (46 forecasts). Black line: WRF (run at NCAR), dark gray: MM5 (run at NCAR), light gray: operational ETA. (Courtesy of Mike Baldwin of NSSL). The level thin black line added to the figure references the bias value of 1.
ACKNOWLEDGMENTS
This work has been supported by the Common High-performance-computing (HPC) Software Support Initiative (agreement no. N00173-01-MP-00024) managed by the Air Force Weather Agency. REFERENCES
forecasts run in real-time and idealized simulations and case studies representing meteorologically diverse regimes. A semi-automated test suite, which includes the aforementioned case studies, is currently being developed to allow WRF users to become more familiar with running the model and exploring sensitivities of its different components. Here, user-controlled scripts will enable the user to run the model for any variation of model parameters, and automatically generate graphical output from these simulations. This output may be compared both with similar user-generated output from simulations of the same case that utilized different physical parameterizations, and with available casespecific graphical output assembled from observations (e.g., Fig. 1). The WRF model was designed as a nonhydrostatic model that can accurately resolve fine-scale circulations. Nesting capability is currently being developed for the WRF model, which will allow the resolution of explicitly generated convective circulations within the large model domains used in the both the realtime forecasts and case studies. Future efforts will continue the examination of the sensitivity to different physical parameterizations at these greater horizontal
Betts, A. K., and M. J. Miller, 1986: A new convective adjustment scheme. Part II: Single column tests using a GATE wave, BOMEX, and arctic air-mass data sets. Quart. J. Roy. Meteor. Soc., 112, 693–709. Chen, S.-H., and W.-Y. Sun, 2002: A one-dimensional time dependent cloud model. J. Meteor. Soc. Japan, 80, 99–118. Davis, C. A., D. A. Ahijevych, R. E. Carbone, K. W. Manning, and J. D. Tuttle, 2002: Statistical-dynamical forecasts of warm-season convective rainfall. In this volume. Hong, S.-Y., and H.-L. Pan, 1996: Nonlocal boundary layer vertical diffusion in a medium range forecast model. Mon. Wea. Rev., 122, 927–945. Hong, S.-Y., H.-M. H. Juang, and Q. Zhao, 1998: Implementation of a prognostic cloud scheme for a regional spectral model. Mon. Wea. Rev., 126, 2621–2639. Janjic, Z. I., 1990: The step-mountain coordinate: Physical package. Mon. Wea. Rev., 118, 1429–1443. Janjic, Z. I., 1994: The step-mountain eta-coordinate model: Further developments of the convection, viscous sublayer and turbulence closure schemes. Mon. Wea. Rev., 122, 927–945. Janjic, Z. I., 2000: Comments on “Development and evaluation of a convective scheme for use in climate models”. J. Atmos. Sci., 57, p. 3686. Kain, J. S., and J. M. Fritsch, 1990: A One-dimensional entraining/detraining plume model and its application in convective parameterization. J. Atmos. Sci., 47, 2784–2802. Lin, Y.-L., R. D. Farley, and H. D. Orville, 1983: Bulk parameterization of the snow field in a cloud model. J. Climate Appl. Meteor., 22, 1065–1092.