Jan 22, 2010 - Table 1. Line flux measurements, in units of 10â14 W mâ2, for extragalactic sources with ISO-LWS ..... can represent a higher ionization rate (see e.g. McCall et al. ..... Samuel. Farrens is thanked for comments. REFERENCES.
Mon. Not. R. Astron. Soc. 000, 000–000 (0000)
Printed 22 January 2010
(MN LATEX style file v2.2)
arXiv:1001.4035v1 [astro-ph.GA] 22 Jan 2010
Testing PDR models against ISO fine structure line data for extragalactic sources. M. Vasta1, M. J. Barlow1, S. Viti1, J. A. Yates1, T. A. Bell2. 1
Department of Physics and Astronomy, University College London, Gower Street, London WC1E 6BT, UK Department of Physics, MC 320- 47, Pasadena, CA 91125, USA
2 Caltech,
Accepted ???, Received ???; in original form 22 January 2010
ABSTRACT
Far-infrared [C ii] 158-µm, [O i] 145-µm and [O i] 63-µm fine structure emission line fluxes were measured from archival Infrared Space Observatory Long Wavelength Spectrometer spectra of 46 extragalactic sources, with 28 sources providing detections in all three lines. For 12 of the sources, the contribution to the [C ii] 158-µm line flux from H ii regions could be estimated from their detected [N ii] 122-µm line fluxes. The measured [C ii]/[O i] and [O i] 63/145-µm line flux ratios were compared with those from a grid of PDR models previously computed using the UCL PDR code. Persistent offsets between the observed and modelled line ratios could be partly attributed to the effects of [O i] 63-µm self-absorption. Using the SMMOL code, we calculated model [O i] line profiles and found that the strength of the [O i] 63-µm line was reduced by 20-80%, depending on the PDR parameters. We conclude that high PDR densities and radiation field strengths, coupled with the effects of [O i] 63-µm self-absorption, are likely to provide the best match to the observed line flux ratios. Key words: FIR fine structure emission lines, PDRs, Extragalactic Sources, ISO LWS, Oxygen self-absorption.
1
INTRODUCTION
Studies of our own Galaxy and observations of external galaxies have suggested that stellar ultraviolet radiation can ionize vast volumes of a galaxy and that far-ultraviolet radiation impinging on neutral cloud surfaces is responsible for a large fraction of the observed far-infrared (FIR) spectral line emission that cools the gas (Crawford et al. 1985). The relative contributions from different gas phases can be estimated from observations of several FIR forbidden lines. Fine structure (FS) emission lines can be used as tracers of nebular conditions such as density, excitation and ionization. By virtue of their different excitation potentials and critical densities, FS emission lines provide an insight into the energetics and chemical composition of the regions from which they originate. The FIR fine structure lines of abundant species, such as [C ii] and [O i], have long been recognised as one of the most important coolants in the interstellar medium (ISM). In particular, the emission from singly ionized carbon [C ii], at λ=158 µm, is known to trace warm and dense photodissociation regions (PDRs) and is used to trace the gas surrounding active star-forming regions. Carbon is the fourth most abundant element and has a lower ionization potential (11.26 eV) than hydrogen. For this reason it is predominantly in the form of C+ in the surface layers of
PDRs, where photoionization of neutral carbon is effective, but can potentially also be excited in ionized regions. [C ii] 158µm emission is reasonably easy to excite, with a transition energy of 92 K. The line is widely observed and is usually optically thin. The depth of the C+ zones in neutral clouds is generally determined by dust extinction of carbon ionizing photons and often extends to Av >4, although C+ decreases in abundance for Av >1 (Bell et al. 2006). Another important species is oxygen, which has an ionization potential of 13.62 eV, slightly above that of hydrogen. This means that the ionization structure of O+ \O0 closely follows the ionization structure of hydrogen. Also, the charge exchange of neutral oxygen in two-body recombination with hydrogen cannot be neglected as it affects the ionization balance. The incident FUV radiation maintains a significant abundance of atomic oxygen deep into the cloud through photodestruction of CO and O2 . All oxygen not incorporated into CO can remain in atomic form to depths as large as Av =10 mag under strong FUV irradiation (Sternberg & Dalgarno 1995).The fraction of oxygen at magnitudes greater than 10 depends on the physical conditions in the cloud (i.e. its density, metallicities and radiation field strength), but essentially if the gas density is >105 cm−3 at these depths, the oxygen not locked in CO is depleted on the grains. However for the purpose of
2
M. Vasta et al.
these calculations, the code that we use, UCL PDR, does not take into account freeze out reactions. Atomic oxygen has two fine structure transitions, at 63 and 145 µm. The [O i] line at 63µm has an excitation energy corresponding to 228 K, is emitted predominantly by warm and dense gas, although it can also have an ionized gas component (Aannestad & Emery 2003), and can act as a coolant in neutral hydrogen regions. It may also be a heating agent as O i can heat the gas through the collisional de-excitation of the dust continuum radiation-excited 3 P1 fine structure level (Tielens & Hollenbach 1985). However this mechanism is not well studied. This line is optically thick in some cases (Abel et al. 2007) and its optical depth can be estimated by comparing the [O i] line flux at 63µm to that of the [O i] line at 145µm (Abel et al. 2007). The [O i] 145µm line can be harder to detect: in fact the relative faintness of this line diminishes its capabilities as a robust PDR diagnostic. The lower level of the 145µm line is not the ground state of O0 , meaning that [O i] 145µm emission is usually optically thin (Abel et al. 2007). The 145µm line has an excitation energy of 326 K, almost 100 K higher than that of the 63µm line, so the ratio of the two line intensities is sensitive to the gas temperature for T6300 K. Since the strength of the FUV radiation field governs the heating of the gas, this line ratio is also a diagnostic of the incident FUV flux (Tielens & Hollenbach 1985). In the presence of foreground cold and tenuous gas the [O i] 63µm line can show both emission and absorption components (Tielens & Hollenbach 1985; Liseau et al. 2006; Gonz´ alez-Alfonso et al. 2004). Nevertheless observations of the FIR fine structure emission lines of [O i] and [C ii] can be used as diagnostics to infer the physical conditions in the emitting gas, such as temperatures, densities and radiation field strengths, by comparing with models of photodissociation regions (Tielens & Hollenbach 1985) and Hii regions (Rubin et al. 1991). In the past, several models have been used to interpret infrared, submillimeter and millimeter line observations of neutral gas in our own Galaxy as well as in the central regions of nearby starburst galaxies (e.g. Mao et al. 2000; Seaquist & Frayer 2000; Wild et al. 1992, and references therein). In this paper we will use FIR line fluxes measured from the ISO archive for a sample of extragalactic sources. We present the fluxes of fine structure emission lines observed by ISO from 46 sources and we estimate the bulk properties of the gas in these external galaxies using the UCL PDR model of Bell et al. (2005) and the radiative transfer code SMMOL (Rawlings & Yates 2001). The paper is structured as follows: in Section 2 we give details of the sources selected and the fine structure emission line fluxes we measured. In Section 3 we describe the UCL PDR models. In Section 4 we evaluate the sensitivity of the UCL PDR models to variations in the physical parameters. In Section 5 we will consider the contribution of H ii regions to fine structure emission lines. The results are given in Section 6, and there we discuss their interpretation in the context of our SMMOL line profile calculations. Concluding remarks are given in Section 7.
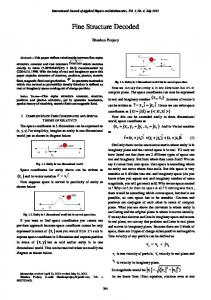
Figure 1. [C ii]158 /[O i]63 and [O i]63 /[O i]145 ratios. Filled triangles represent the ratio of the literature value of [O i]63 /[O i]145 over our own measured [O i]63 /[O i]145 ratio, with respective error bars. Open triangles represent the ratio of the literature value of [C ii]158 /[O i]63 over our own measured [C ii]158 /[O i]63 ratio with respective error bars. The horizontal line represents the case in which literature ratios and our own measured ratios are perfectly matched. The source index numbers and galaxy identifications are listed in Table 1.
2
THE ISO DATA
All the FIR data included in this paper were acquired using the ISO Long Wavelength Spectrometer (LWS; Clegg et al. 1996), which had an estimated FWHM beam size of ∼ 80 arcsec. We collected [C ii]158µm, [O i]145µm and 63µm emission line fluxes from ISO LWS archival observations for 46 external galaxies. The [C ii]158µm, [O i]145µm, 63µm emission line fluxes were measured from the spectra using the interactive package SMART (Spectroscopy Modeling Analysis and reduction Tool; Higdon et al. (2004).) Table 1 lists the emission line fluxes measured by us from the ISO spectra. For 33 of the galaxies, fluxes previously published in the literature were available and these are also listed in Table 1. When uncertainties were not listed for these literature fluxes, we have estimated them as 20% for fluxes 6 10−14 W m−2 and 10% for fluxes > 10−14 W m−2 . Although the choice of how to estimate the associated errors, when it is not provided, is arbitrary, we used typical uncertainties resulting from calibration and pointing errors in the submillimeter and IR domain (Mart´ın et al. 2006; Bayet et al. 2004; Israel et al. 1995). The percentage uncertainty estimated in this way appears, on average, to be similar to the percentage line flux uncertainties measured by us using the interactive package SMART. In order to show that our measurements are in good agreement with the fluxes collected from the literature we have plotted our measurements versus literature values in Fig 1. We have plotted the ratio of the literature value of [C ii]158 /[O i]63 over our own measured [C ii]158 /[O i]63 value, with respective error bars (open triangles), as well as the ratio of the literature value of [O i]63 /[O i]145 over our own value of [O i]63 /[O i]145 , with respective error bars
Testing PDR models against ISO fine structure line data for extragalactic sources.
3
Table 1. Line flux measurements, in units of 10−14 W m−2 , for extragalactic sources with ISO-LWS detections of all 3 FIR fine structure emission lines of [C ii] and [O i]. For each source, our own line flux measurements are listed in the first row, while literature values, if any, are listed in the second row (Contursi et al. 2002; Bergvall et al. 2000; Colbert et al. 1999; Fischer et al. 1996; Luhman et al. 2003; Malhotra et al. 2001; Negishi et al. 2001; Unger et al. 2000; Brauher et al. 2008). (n.a: not available) Index
Source
Radial Vel (km s−1 )
TDT No. of Observation
[CII] 158µm
[OI] 63µm
[OI] 145µm
[CII]158 [OI]63
[OI]63 [OI]145
1
IC 10
-348
45700609
2
Haro 11
6175
54900720
3
NGC 253
243
56901708
4
NGC 520
2281
77702295
5
Maffei 2
-17
85800682
6
NGC 1068
1137
60500401
7
IC 342
31
64600302
8
NGC 1482
1916
79600984
9
NGC 1569
-104
64600489
10
NGC 1614
4778
85501010
11
NGC 2146
893
67900165
12
NGC 2388
4134
71802360
13
M 82
203
65800611
14
NGC 3256
2804
25200456
15
IRAS 10565 +2448
12921
20200453
0.966±0.034 0.763±0.021 0.0410±0.0022 0.039±0.001 4.618±0.126 5.19±1.04 0.2188±0.0045 0.28±0.06 1.072±0.051 1.21±0.24 1.881±0.062 2.13±0.43 0.3146±0.0097 n.a 0.571±0.022 0.655±0.013 0.652±0.027 0.674±0.134 0.1953±0.0067 0.226±0.010 2.479±0.078 2.62±0.52 0.1473±0.0073 0.191±0.038 13.02±0.30 12.79±2.59 1.124±0.044 1.37±0.27 0.0551±0.0076
0.591±0.025 0.65±0.02 0.0954±0.0041 0.092±0.018 3.47±0.16 3.76±0.75 0.29±0.015 0.21±0.04 0.512±0.051 0.53±0.11 1.416±0.043 1.60±0.32