Peter J.B. Hancock, Vicki Bruce. Department of Psychology ..... 4 Bruce V, Hanna E, Dench N, Healy P and Burton AM, The importance of. 'mass' in line drawings ...
Testing Principal Component Representations for Faces Peter J.B. Hancock, Vicki Bruce Department of Psychology University of Stirling, UK
A. Mike Burton
Department of Psychology University of Glasgow, UK
Abstract
A variety of experimental results indicate that the human visual system processes faces at least to some extent holistically, rather than by analysing individual features such as nose and eyes. Principal Components Analysis (PCA) of face images, which is widely used in engineering approaches to face identi cation, produces an inherently global representation. We investigate the psychological plausibility of this representation, looking at correlations with human perceptions of memorability and similarity. We show that transformation of faces to an average shape prior to PCA improves correlations with human ratings
1 Introduction
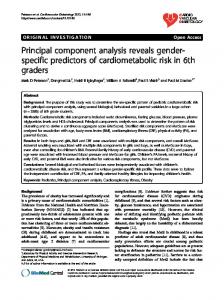
Humans are quite good at recognising faces, given how similar most of them are. Attempts to emulate the feat using computer systems indicate how di�cult the task is, with variations in the appearance of an individual caused by changes of expression, lighting or pose vastly exceeding the variations between individuals by most simple measures. Although humans are also adversely a�ected by changes of lighting and pose, we are evidently able to extract some kind of relatively invariant features, but it is still not clear what these might be. A number of results suggest that we do not rely on measurements of internal features. For example, line drawings retain such information, but are signi cantly worse than photographs for identi cation [4]. Photographic negatives also retain all the information required for feature location, but again are signi cantly harder to recognise [7]. Inverting a face also makes it harder to recognise, for reasons hinted at by Figure 1. The mutilation of the right hand image is barely perceptible when the face is upside down. Inversion a�ects our ability to integrate the features into a whole face and it seems that this kind of holistic processing, based on relatively low-level image-features, may underlie our recognition system. Principal component analysis (PCA) has been proposed as an engineering solution to face recognition [14]. The representations it forms cover the whole face but are based on statistical properties of the lowest possible image-feature, namely individual pixels. Although we do not use neural networks to perform PCA here, for e�ciency reasons, there are many network algorithms that would do the job, e.g. Sanger's [12]. Although simple PCA is implausible as a model of what the visual system is doing. it has been shown to have some surprising matches with some aspects of human vision [1]. Here we investigate the psychological plausibility of this form of coding further, by comparing it with 1
Figure 1: The \Thatcher illusion" [13]. This way up, the modi cations to the right hand image are hardly noticeable. human judgements of a common set of faces. We obtain distinctiveness ratings for each face, and subsequently test how memorable each actually is. We also obtain similarity ratings by asking participants to sort the faces into piles of those that are similar. The following section explains PCA of faces in more detail. The gathering of human data, and comparison with PCA, is described in section 3 for similarity judgements and in section 4 for distinctiveness and memorability. We then describe the e�ects of horizontal bandpass ltering of the face images prior to PCA.
1.1 Face sets
Experiments reported here use two distinct sets of faces. The rst has one image each of 174 individuals [9]. The second has only 50 individuals, but multiple examples [8]. A neutral expression example of each was used as a target set, and 2 or 3 images showing one of happiness, disgust and surprise for a total of 136 in the test set.
2 PCA of faces
PCA is a standard statistical technique for reducing the dimensionality of data while attempting to preserve as much of the information, in the form of variance, as possible. Given an elliptical cloud of data in two dimensions, PCA will return the long axis of the ellipse as the rst component, since the position on this axis will say most about where a datapoint is in the cloud. If the data on the x and y axes were the height and weight of a group of children, then the rst component returned might usefully be given the label \size". The second component would be at right angles to the rst, and might be given the label \obesity". Turk and Pentland [14] applied PCA to images of faces, producing
ghostly \eigenfaces" such as those illustrated in the top row of Figure 2. These components correspond to new axes in the pixel space just as size and obesity do in the space of height and weight, but it is much harder to give meaningful labels to them. Several of those shown in Figure 2 seem to code something to do with hair length or style. However, the principle is the same, so the position of a face on the axis de ned by the rst component will say as much as it is possible to about that face's appearance, given only one dimension. More precisely, it says as much as possible about the values of the pixels in the image of the face: whether this corresponds in a useful way to what we think of as appearance is precisely what we wish to determine. PCA on a set of n faces can produce up to n components, each accounting for a decreasing amount of variance. Each face may be coded as a vector in the space de ned by the components. If all n components are used, the representation is perfect, and the original face images may be recovered by multiplying through the coding vector with the eigenfaces, just as height and weight could be recovered from a knowledge of size and obesity. PCA simply redescribes the data in a way that may be more useful. Typically, fewer eigenfaces will be stored, perhaps 50 from a set of 200 faces, which might account for 90% of the variance. In this case there will be some loss of information, but recreated faces are typically quite accurate, subjectively.
Figure 2: Full image (top row) and \shape-free" eigenfaces. The left-hand image in each row is the average face, followed by the rst four and the tenth eigenfaces. In order for PCA to extract something sensible from face images, they need to be aligned, typically by scaling and translating to bring the two eyes to the same x,y location in each image. Because of the variability in faces, this will mean that other features such as nose and mouth are in di�erent locations, which will have to be accommodated by the eigenfaces. Craw and Cameron [5] proposed morphing the faces to an average shape prior to PCA. Key features around the face are located (in our case by hand, though automatic systems are increasingly successful), see Figure 3. We de ned 38 points on each face. An average face shape is computed from the positions marked on all the faces, and then each face is morphed to that shape. PCA now produces much more sharply-de ned eigenfaces, see the bottom row of Figure 2. Craw and Cameron showed that this procedure improved identi cation rates for a computer-based
system. One reason for this is that it removes some of the variability due to changes of expression, and even some due to variations in pose.
Figure 3: The location of points around the face used for shape averaging. This procedure also gives us shape information about each face, in the form of a vector of x,y locations. We may perform PCA on these vectors also, to give us the principal modes of shape variation between faces. Figure 4 illustrates the rst six of these components, extracted from the second set of faces. The images are generated by moving the points for the average face one and two steps in each direction, as speci ed by the shape components. The rst component turns out to code nodding of the head. Although our participants were asked to look directly at the camera, they evidently di�er enough in the angle at which they hold their heads for this to be the major component of variation. The second component codes variation in head size. That this is only the second component is probably because of the normalising e�ect of adjusting all the images to have their eyes in the same location. This is also responsible for some of the rather strange looking deformations caused by later components, since everything moves with respect to the xed eyes. The third component appears to code something about the relative vertical position of the eyes in the face. The fourth and fth code the two remaining rotational degrees of freedom: shaking from side to side and tilting. The sixth codes face width. Higher components (not shown), then code increasingly subtle variations in face shape. We calculated 20 shape components, but omitted the rst, fourth and fth from further calculations as we considered that variations in head angle, except in extreme cases, were unlikely to have much bearing on human perceptions of the faces. Initial investigations showed that later components showed rather little correlation with human ratings and we typically used only 7 or 10. Having separated shape from the ner image detail prior to PCA, we may recombine them again afterwards, typically taking 10 image and 10 shape components (13 image and 7 shape for the multiple correlation results of section 4.1). Some form of normalisation is required, since one set is in the scale of pixel grey-levels, while the other is in x,y pixel locations, so the two sets of components were adjusted to have the same total variance. We therefore have four types of PCA data for comparison with human perceptions: unaltered full im-
Figure 4: Principal components of face shape. The average shape-free face (centre column) is distorted by adding or subtracting shape components to its control points, and morphing the image to the new shape. The e�ects of the rst 6 shape components are shown, one per row. First component codes head nodding, second head size, third the relative position of the eyes, fourth head rotation, fth head angle (tilt) and sixth face width.
ages, shape-free images, shape vectors and shape vector and shape-free image recombined.
2.1 PCA measures
There are a variety of possible measures derived from PCA that can be compared with human data. The three considered here are individual component values; the error of reconstruction; and the matching error on identi cation. The simplest is the individual value of each component. Suppose that some of our components really do mimic in some way the representations used inside our heads. For a face to be called distinctive implies that it is atypical, or a long way from the mean in some dimension. A face that appears distinctive to us might then be expected to have a large value on one or more of the components. However, since atypical might be in either direction from the mean, it is a large absolute value that might be expected. We may therefore perform multiple correlations between our component values for a face and the human rated distinctiveness or memorability values. In practice we found correlations between both raw and absolute component values and so included both in our correlations, reported in section 4.1. If the complete set of PCs are used to reconstruct a face, there will be no error. If a subset is used, then there will be inaccuracies. Hancock et al [9] showed that if few components are used, then distinctive faces show a high error of reconstruction, since the early components code that which is common to many faces, leaving unusual faces poorly represented. However, as the number of components rises, there is a reversal, and distinctive faces become relatively well coded, because the best way to reduce the remaining variance is to code the outlying faces. Interpretation of correlations with reconstruction error therefore requires some care and no such results are reported here. The third measure is the matching error on identi cation. If a new image of one of the faces is processed by the same set of eigenfaces, it will produce a PC vector, which ideally will be close to the vector produced by the original sample of the same face. We use simple Euclidean distance in the PC space: the test face is declared to match the target face to which it is closest. If several target faces are of similar distance, then our con dence in the match is low. We de ne a con dence measure as the ratio of the distance to the correct target to the average of the distance to all the others. A face that is distinctive to humans literally stands out from the crowd, and so should have a high con dence measure in the PCA system.
3 Similarity Some faces are inherently confusable: those of identical twins being an obvious example. However, \s/he looks like..." is a common expression, and is often used as a means to enable identi cation to be made. Our premise in this section is that if PCA has any kind of psychological plausibility, it ought to nd the same faces similar that people do. We therefore gathered similarity ratings from human participants to see whether they correlate with the similarity metrics produced by PCA [8].
40 participants were asked to sort the (second) set of 50 neutral faces into piles that appeared similar to them. They were free to make as many piles as they wished and ranged between 2 and 29, with an average of 11.5. To get similarity ratings for a pair of faces, we simply counted the number of occasions they were put in the same pile: this varied from 0 to 20. These similarity measures were compared with the matching errors on identi cation from PCA. Faces that appear similar to humans ought to be close together in PCA space and produce a lower match error than faces that appear dissimilar. For each face, we computed the distance to all the other target faces and then performed a Kendall rank correlation between the PCA distance measures and the human similarity scores. This gave us a set of 50 correlation values, average values for which are shown in Figure 5. Since the correlations are relatively small we treat them as normally distributed and apply t-tests, which indicate that all di�er signi cantly from zero, so the PCA system does capture something of the notion of similarity that humans use. Figure 5 indicates that the transformation to shape-free images improves the correlation, and that while the correlation with shape alone is low, the combination of shape and shape-free gives the highest gure. Note that while these correlations are signi cant, they are quite low. We are investigating the reason for this: it may simply be that our method for gathering human similarity data is too noisy - there is a tendency for piles to \drift" with matches being made to the face on the top of the pile, rather than to some average for that pile. Alternative ways of assessing similarity, such as confusability on rapid presentation of two faces, may provide more reliable results [3].
Shape free + shape PCA Shape only PCA Shape Free PCA Full image PCA 0
0.05 0.1 0.15 0.2 Average rank correlation
0.25
Figure 5: Average Kendall rank correlation values between human similarity ratings and matching errors for the four di�erent sets of PCA data.
4 Distinctiveness and memorability
Participants were asked to rate each face for distinctiveness on a scale of 1-10, in response to the question \How easy would it be to pick this person out at a railway station?" Images were presented via computer, with no time limit for response. The two sets of faces were each divided in half, with participants being asked to rate only one half: 87 faces for the rst set, 25 for the second. There were a total of 34 participants for the rst set of faces, 20 for the second [9, 8]. After a gap of 10-15 minutes doing other unrelated experiments, participants were shown the complete set of faces (174 or 50, respectively) and asked to rate on the same scale of 1-10 whether they had seen each face in the previous part of the experiment. This gives hit scores for faces that had been seen and false positive scores for those that had not. Participants' scores were combined to give average values of all three measures for each face. The three measures show a rather odd pattern of correlation. We would expect distinctive faces to be well-remembered and well-rejected. This is indeed generally the case, with signi cant correlations between distinctiveness and hit score of 0.49 and between distinctiveness and false positive of -0.40 for the rst set of faces. However, the correlation between hit score and false positive is not signi cant ( = ?0 08 0 05), implying that the faces that are wellremembered are not necessarily the same as those that are well-rejected. The second set of faces display a similar pattern. The cause of this pattern, rst observed by Vokey and Read [15] is still unclear. It may be that hit and false positive scores are simply an unreliable indicator of underlying memorability, that actually correlates well with distinctiveness, or it may be that there really are di�erent underlying causes that mediate recognition and rejection. r
:
;p >
:
4.1 PCA multiple regression
We investigated whether there was any correlation between individual component values and the human ratings for the rst set of images (a more detailed account of the analysis appears in [9]). Table 1 shows multiple-r values for the correlation between the human ratings and the rst 20 principal component outputs, and their absolute values (see section 2.1). Multiple regression was performed using SPSS with stepwise addition of components. Typically about 5 component values were entered into the equation. The gures in Table 1 are the average of 100 results, produced by randomly splitting the set of faces in half. Two things are of note. Firstly, that the transformation to shape-free makes a big di�erence to the correlation with false positive scores. It seems that the shape vector alone has no signi cant correlation with false positive responses, since it does not exceed the random multiple correlation for this many variables of 0.33. Secondly, that the combination of shape and shape-free again fares best. To give some indication of whether individual components correlate with the human data, Figure 6 shows the number of times each component was used in the 100 multiple correlation equations for shape + shape-free coding from Table 1. Of note is the heavy usage of the rst component for false positive, with rather little contribution from shape components, as might be expected from the results in Table 1. Distinctiveness and hit score show similar patterns
Type Distinctiveness Hit False positive Full image 0.51 0.42 0.42 Shape-free 0.48 0.40 0.49 Shape only 0.48 0.37 0.30 Shape-free + shape 0.52 0.43 0.48 Table 1: Multiple correlation between PCs and subject ratings, averaged over 100 random half splits of the set of 184 faces Type Distinctiveness Hit False positive Full image 0.21 0.30 -0.16 Shape-free 0.32 0.42 -0.36 Shape only 0.29 0.2 -0.09 Shape-free + shape 0.34 0.41 -0.34 Table 2: Correlation between the PCA match con dence on recognition and the human ratings for the second set of faces. crit for 0 005 is 0.24 r
p