Information and Software Technology 48 (2006) 204–213 www.elsevier.com/locate/infsof
Testing spreadsheet accuracy theory S.E. Kruck* Computer Information Systems Department, James Madison University, College of Business—MSC0202, Harrisonburg, VA 22807, USA Received 16 May 2004; revised 12 April 2005; accepted 19 April 2005 Available online 27 June 2005
Abstract Electronic spreadsheets are used extensively to support financial analysis and problem solving processes; however, research has revealed that experienced professionals and students make many errors when developing spreadsheets. Practitioners recognize the importance of accuracy and have published many techniques for improving the accuracy of their spreadsheets. Their prescriptions and results of research are consistent and together these works form the basis for spreadsheet accuracy theory. Three propositions describe how the three constructs influence spreadsheet accuracy in a laboratory experiment. The results of this study indicate that the Spreadsheet Accuracy Theory developed three aids that significantly improve development of accurate spreadsheets. q 2005 Elsevier B.V. All rights reserved. Keywords: Theory testing; Spreadsheet accuracy; Spreadsheet development
1. Introduction Electronic spreadsheets have made a major contribution to financial analysis and problem solving. Decisions made using spreadsheets often involve billions of dollars. Studies of computing activities have consistently demonstrated that business professionals use spreadsheets extensively [6,7,12,16,17,25,26,41,42]. Although many decisions are based on the analysis of a spreadsheet model, many spreadsheets have data quality problems, i.e. underlying formulas and resulting numbers are frequently wrong. A growing body of empirical evidence indicates these errors in spreadsheets are a pervasive problem both in laboratory and real-life settings. Spreadsheet accuracy theory (SAT) combines the views of practitioners with researchers to provide a framework for understanding how errors occur [23]. The SAT also suggests ways for controlling the development process to limit these errors. The goal is to test the basic propositions of SAT. Specifically, to determine if the constructs of the theory influence accuracy, as predicted by the academic and practitioner work on which the theory stands [23]. Thus, an * Fax: C1 540 568 3273. E-mail address:
[email protected].
0950-5849/$ - see front matter q 2005 Elsevier B.V. All rights reserved. doi:10.1016/j.infsof.2005.04.005
experiment was conducted that controls aspects of each construct through introduction of techniques for spreadsheet development. These techniques specifically address the errors resulting from the specific construct. This approach directly tests the central propositions of SAT, with the results confirming the influence of the constructs. That is, by influencing design/planning stage, the complexity of formulas, or explicitly testing spreadsheets developers can improve spreadsheet accuracy. Section 2 presents a review of the constructs and propositions of SAT. Section 3 presents the hypotheses of the current study. Section 4 describes the participants, materials, procedures, and analyses used to test the theory. Section 5 presents the findings from the current study. This is followed by Section 6 that evaluates the results in terms of the expectations of the theory and implications for practice and teaching.
2. Literature review Spreadsheets have been one of the most highly used computer applications in business over last 20 years [6,7,25,44]. They are used for many different applications that are essential for business, such as budgets, forecasting production, financial modeling, audit and other work paper generation, cost/benefit analysis, foreign exchange analysis, assets and liability management, determining rate of return on investments, mathematical modeling, analyzing
S.E. Kruck / Information and Software Technology 48 (2006) 204–213
scientific and engineering data, projecting market penetration, and evaluating the feasibility of divestitures, acquisitions, and mergers. The problem is that spreadsheets may contain errors, which leads to poor data quality and costly decisions. The existence of substantive errors has been demonstrated anecdotally and empirically [3,8,11,15,18,20,29–34]. These studies reveal unacceptably high error rates in both practice and laboratory settings. References to spreadsheet errors exist, but often the companies involved have chosen to remain anonymous due to the negative publicity that arises from such errors. In one case, The Wall Street Journal reported that a Dallas oil and gas company fired several executives due to a spreadsheet error that cost the firm millions of dollars [8,9]. In another case, a chief operating officer working with two related spreadsheets of 15,000 cells underestimated the market for computer-aided design equipment for the manufacturing industry by $36 million. This was due to rounding all spreadsheet figures to the nearest whole number, thus,
205
eliminating the inflation rate of 6%, i.e. 1.06 changed to 1 [19,24,35,42]. In another case, a senior consultant for a big five accounting firm identified 128 errors in four multibillion dollar worksheets [13,35,36]. Researchers also have revealed that errors are prevalent in spreadsheets under a variety of conditions and attempted to identify strategies for reducing errors. Conditions include experienced spreadsheet developers in a laboratory setting to students with varying levels of experience and students working alone or in groups during development of their spreadsheets. Table 1 is a summary of studies in spreadsheet errors [23]. Since the publication of Table 1 there have been a few more studies that document the problem of spreadsheet errors or develop instruments to measure knowledge. Teo and Tan measured and classified qualitative errors and they suggest that proper design procedures should be developed or adopted [39]. Tukiainen [40] conducted an experiment where students developed spreadsheet models using Excel or Basset (a spreadsheet tool where the user manipulates structures and not individual cells) and found
Table 1 Summary of spreadsheet error studies [23] Author(s)
Year
Participants
% of spreadsheets w/errors
Brown and Gould Davis and Ikin
1987 1987
IBM employees Live/real company spreadsheets Major errors Inadequate and extremely error prone Novice students Working on computer Working with paper and pencil Live/real company spreadsheets Business students Working alone Working in groups of 2 Working in groups of 4 Accounting students General business students working alone General business students working in groups of 3 Upper- and masters-level accounting and business administration students Ad hoc development group Structured systems group Upper- and masters-level accounting and business administration students Ad hoc development group Structured systems group MIS upper-division undergraduates Working at home Working in laboratory MBA students Non-accounting and -finance upper-division undergraduates Business students Working alone Working in groups of 2 Working in groups of 4 Accounting and finance students Undergraduate students Inexperienced MBA students Experienced MBA students
44
Hassinen
Cragg and King Panko and Halverson Jr.
1988
1993 1994
Panko and Halverson Jr.
1995
Janvrin and Morrison
1996
Janvrin and Morrison
Panko
1996
1996
Panko and Halverson
1996
Panko and Halverson Jr.
1997
Panko and Sprague Jr.
a b
1997
Paper template of solution provided. Check figure provided.
21 53 48 55 25 81 71 50 68 82 27 14a 7a 18b 9b 38 30 57 79 79 78 64 65 37 35 24
206
S.E. Kruck / Information and Software Technology 48 (2006) 204–213
that error behavior of novice developers is systematically different, but still existed. Another study looked at qualitative versus quantitative errors seeded into a spreadsheet and found that quantitative errors (and more specifically mechanic errors) were more easily detected [38]. Another study looked at code inspection and determined that requiring students to make several modifications (revising existing links and creating new links) after creating a spreadsheet did improve performance by reducing inter-worksheet linking errors as measured by both the number of errors and by the proportion of error-free worksheets [27]. A more recent study developed an instrument to measure what end-user developers know [22]. The instrument consists of 25 questions and was able to distinguish between the spreadsheet knowledge of users with different levels of training and experience. It is clear from the literature that problems exist in terms of spreadsheet accuracy. These later studies focus on classifying errors instead of reducing them, create an artificial environment to cause the end-user to modify the spreadsheet or documenting that spreadsheet knowledge depends on previous training and experience. There has not been a systematic method to decrease and eliminate the number of spreadsheet errors. 2.1. Spreadsheet accuracy theory In addition to researcher’s contributions to reveal and describe the phenomena of spreadsheet accuracy, many practitioners have published numerous articles describing their techniques for increasing spreadsheet accuracy. Three important issues resulting from the research are that (1) design activities can reduce errors; (2) reducing problem complexity can reduce, but not eliminate the propensity for errors; and (3) testing/debugging activities can reduce errors [10,23,37]. Officers of H.M. Customs and Excise in United Kingdom have developed a testing methodology and supporting audit support software for use by their tax inspectors; however, they suggest that a more formalized development and testing methodology would help reduce the risk of errors [4]. SAT was developed to integrate the perceptions of professional developers with these research findings. The constructs included in the theory are planning and design organization, formula complexity, testing and debugging assessment, and spreadsheet accuracy. The relationship between spreadsheet accuracy and the other constructs are described by three propositions. The planning and design organization construct is defined as the degree to which the spreadsheet was laid out in an orderly and logically cohesive format. For example, net profit should follow income and expenses. This includes both organizing the data and processing components of the spreadsheet. This involves a data design that includes separating data used as input into calculations from the data that is created as a result of the calculations. It also includes defining a data capture or input area [43].
In addition, the output or solutions area or procedure to generate the solution should be clearly indicated [43]. Processing components require design to provide a logical fit with elements of the algorithm and utilize the data design. Design of the user interface also is necessary for controlling errors. By considering the goals of the prospective user and evaluating multiple possible interfaces, developers can explicitly design labels and input data validation [1,2,5–7, 37] to dramatically reduce the potential for data entry errors. Similarly, necessary decision variables should be presented together to minimize paging and scrolling. Finally, documentation is essential for new users of spreadsheets, maintaining documentation through the series of changes inherent in dynamic environments also is necessary. Formula complexity is defined as the degree to which the formulas required in spreadsheet cells are difficult to understand. Formulae can be difficult to understand due to high levels of coupling, complicated calculations, or naming conventions. Coupling is linking a cell to cells in other areas of the current sheet, other sheets in the current workbook, or sheets in other workbooks. Controlling coupling enables the developer to encapsulate logical components of the algorithm to simplify development and testing. Standards for naming conventions for cells and ranges are necessary to maintain the link between problem domain, and spreadsheet solution. For example, using the formula SUM(NcSalesCScSalesCGaSalesCFlSalesCAbSalesC MiSales) in a cell named ‘Southeastern-States-Sales-Total’ versus using SUM(A1..F1) or SUM(A1CB1CC1CD1C E1CF1) in cell G1 will be easier to understand and maintain for future developers [2]. Managing the length of formulas also contributes to spreadsheet understandability. That is, shorter formulas are easier to understand than longer ones. Testing and debugging assessment is the degree to which detecting and correcting errors takes place. Even the simplest tests can uncover errors. Use of test data with known values should increase the probability of spreadsheet accuracy [37]. Similar to unit or system testing of computer programs, policies and procedures for comparing the spreadsheet to manual calculations derived from historical or sample data designed to test all aspects of the spreadsheet will uncover errors. Spreadsheet accuracy is defined as the degree to which the spreadsheet is error-free or accurate. The three constructs presented above address a broad range of errors: spreadsheet errors associated with organizing the problem within spreadsheet are captured by the design and planning construct; errors associated with calculations and linking the spreadsheet are captured by the formula complexity construct; and errors resulting from understanding the problem and implementing the spreadsheet are captured by the testing construct. The following propositions present the expected effects of designing and planning, formula complexity, and testing
S.E. Kruck / Information and Software Technology 48 (2006) 204–213
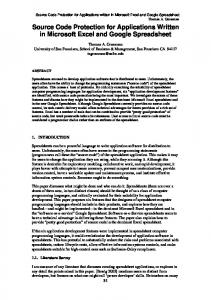
and debugging on spreadsheet accuracy as identified by research and confirmed by practitioners. Proposition 1. (P1): Planning and Design positively influences Spreadsheet Accuracy. That is, increasing the degree that the spreadsheet is planned and designed will increase accuracy of the spreadsheet. Proposition 2. (P2): Formula Complexity inversely influences Spreadsheet Accuracy. Decreasing the degree of complexity in formulas, will increase the accuracy of a spreadsheet model. Formulas will be more accurate if they are shorter, use naming conventions, and have fewer links to other spreadsheets. Proposition 3. (P3): Testing and; Debugging positively influences Spreadsheet Accuracy. Increasing the extent or degree of testing and debugging will increase the accuracy of a spreadsheet. In other words, the more testing and debugging the developers do, the fewer errors should remain in the spreadsheet. Fig. 1 presents the model of SAT [23]. The current study tests the propositions in this model by deriving hypotheses consistent with each proposition. It is likely that other relationships exist among the constructs. Logically, we expect the design and planning construct will inversely influence the formula complexity construct. That is, as more design and planning occurs, it is likely that problems will be decomposed into smaller components, and these smaller components will likely require simpler formulas. Similarly, we might expect the formula complexity construct to inversely influence the testing and debugging construct. As formulas become less complex they will require less testing to increase the probability that they perform the correct calculations. Such propositions are not included in the theory due to the lack of empirical and practitioner support. Similarly, interactions may exist among the influences of the constructs on spreadsheet accuracy. For example, the combined influence of design/planning and testing/debugging may substantively impact accuracy. Although Janvrin and Morrison [20] suggest that employing more versus fewer error control
Planning
Formula
Testing &
& Design
Complexity
Debugging
P2 P1
+
P3
+
207
strategies generates no statistically significant differences, these potential relationships were not proposed as part of SAT [23].
3. Research model Three hypotheses were tested, one for each proposition. Spreadsheet accuracy was measured by the number of errors in the spreadsheet. Techniques and guidelines were developed to aid spreadsheet developers in considering the aspects of each construct. These aids were then provided to treatment groups and their performance was compared to that of a control group. The control group received neither an aid nor instruction on how to develop correct spreadsheets. Thus, use/non-use of an aid was the measure of the construct. Although each aid consists of multiple criteria, this study is focused on determining the viability of the constructs at a macro level, i.e. do the expected effects exist. No attempt was made to determine which are the more important criteria within constructs. This results in the following hypotheses. 3.1. Hypotheses Hypothesis one is related to the design and planning organization construct. An example of the design and planning aid is included in Appendix A. H1. Spreadsheets developed by participants using the planning and design aid will have significantly fewer errors than those spreadsheets developed by participants that use no aids. Hypothesis two is related to the formula complexity construct. An example of the formula complexity aid is included in Appendix A. The aid provides guidance to participants on how to reduce the complexity of formulas. Thus, the theory in proposition P2 predicts an inverse relationship between complexity and accuracy. However, the matching hypothesis in the current study is positive because if the formula complexity aid results in fewer errors than the control group, it will presumably be due to the participants following guidance of the aid, thus creating less complex formulas. H2. Spreadsheets developed by participants using the formula complexity aid will have significantly fewer errors than those spreadsheets developed by participants that use no aids.
Spreadsheet Accuracy
Hypothesis three is related to the testing and debugging construct. An example of the testing and debugging aid is included in Appendix A.
Fig. 1. Spreadsheet error reduction model [19].
H3. Spreadsheets developed by participants using the testing and debugging aid will have significantly fewer
208
S.E. Kruck / Information and Software Technology 48 (2006) 204–213
errors than those spreadsheets developed by participants that use no aids. Although the hypotheses may seem simplified, they represent the necessary starting point for evaluating SAT. Even though the theory is based in previous research and the views of professionals, it must be evaluated in a systematic fashion, beginning with the primary effects proposed in the theory.
4. Research method This study examines the influence of the propositions of SAT. A between-groups experiment was implemented for the study. A total of 129 students participated; however, six participants turned in incomplete spreadsheets and their data were dropped from the preliminary analysis. As part of the post-test questionnaire, the researcher asked participants several questions to ensure that they understood the task and that the technology used in the experiment was not a problem. Six participants indicated that they had a problem with the technology. Two participants indicated that they either did not like the computer because it was too slow or they ‘didn’t like the border formatting.’ Those two participants’ data were not dropped. However, four participants reported problems that could affect their spreadsheet solution. For example, one participant reported that he/she did not ‘know some debugging messages,’ another participant reported a problem ‘knowing/finding all the functions to utilize,’ and another reported ‘not sure that I completely understood the problem.’ These individuals were dropped from subsequent analyses. As a check on this question, the researcher also asked participants to indicate the difficulty they had using the spreadsheet program itself on a 4-in. scale anchored ‘None’ and ‘A lot.’ An additional participant was dropped because he/she indicated ‘A lot’ even though he/she did not indicate the specific problem. As an additional check, the researcher also asked participants if their knowledge of the spreadsheet program mechanics was more than adequate, adequate, or inadequate to do the task. One participant indicated that his/her knowledge of the spreadsheet mechanics was inadequate; this participant was dropped. Beyond assessing the participants’ understanding of the technology and software, a final question asked if the participant understood the problem. The question asked if the participant possessed the knowledge of the logic required in the bidding process. One participant indicated that his/her skill was inadequate and was dropped. Participants also indicated which spreadsheet packages they had used in the past. All remaining participants indicated that they had previously used Excelq. The final set of data contains 116 observations and the sample contained
28 participants in the control group, 26 participants in the planning and design group, 29 participants in the formula complexity group, and 33 participants in the testing and debugging group. Participants were 33 graduate and 83 undergraduate business students at a major university. They reported mean spreadsheet experience of 493 h and 95% considered themselves to have moderate or intermediate spreadsheet experience. Participants were compensated two ways. First, by extra course credit or state lottery tickets and second by entering the best performing students (those with fewest errors) into a drawing for a monetary reward. The research task consisted of preparing a spreadsheet to generate two estimates for the costs of remodeling a family kitchen. It required students to perform simple arithmetic spreadsheet tasks, but did not require the development of macros or functions. The task materials are included in Appendix A. The research task and three aids were pilot tested for realism, understandability, level of difficulty, and time to completion with a sample of eight graduate students. No substantive changes were made to the experimental materials as a result of pilot testing. Participants volunteered to come to the computer lab and complete the spreadsheet problem using Microsoft Excel. Students were randomly assigned to one of four treatment groups, one group for each of the three aids and the control group. Students in each treatment group received training on how to use the aid to reduce the number of errors in their spreadsheets prior to beginning the problem. Training was conducted in a lecture format with examples of how following the aid resulted in more accurate spreadsheets. After developing their spreadsheet, participants completed a questionnaire of demographic information.
5. Results The results of the study include reasonableness and manipulation checks, test of statistical assumptions, and the tests of hypotheses. Supplemental analysis of participants’ confidence and perceptions of task difficulty also are analyzed. Several participants were dropped from the analyses due to incomplete data or expressed inability to understand the problem or use the Excel software. This resulted in 116 participants with 28 participants in the control group, 26 participants in the design and planning treatment, 29 participants in the formula complexity treatment, and 33 participants in the testing and debugging treatment. The data were evaluated for assumptions of independence, normality, and homogeneity of variance. Independence was managed by random assignment of participants to treatments. There were no significant differences in
S.E. Kruck / Information and Software Technology 48 (2006) 204–213
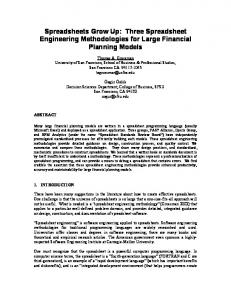
reported spreadsheet knowledge, hours of spreadsheet experience or hours per week across the treatment groups. However, academic rank, i.e. graduate versus undergraduate, was not random across groups. Further investigation revealed that the control group was 50% graduate students versus about 22% for each of the three treatment groups. T-tests were conducted to compare the performance of graduate and undergraduates for all four groups, no significant differences were revealed. The groups do not appear to be different. Normality was tested using both the Kolmogorov– Smirnov Normality Test with Lilliefors Significance Correction for testing normality and the Shapiro-Wilks statistic used for small samples [28]. The data were not normal, both parametric and non-parametric statistical analyses were conducted. Levene’s homogeneity of variance statistic of 0.8575 (pZ0.4655) indicates there is homogeneity of variance, thus unequal cell sizes should not impact the statistical results [14,21]. A planned comparison was conducted using a t-test to compare the performance of the participants in the design and planning aid treatment group to the control group. The treatment groups had significantly fewer errors in their spreadsheets than did the control group. That average number of errors per spreadsheet was: control group 6.4; planning and design group 4.5; formula complexity group 4.6; and testing and debugging group 4.2. Hypothesis two also was tested using a t-test to compare the performance of the formula complexity treatment group to the control group. The treatment group had significantly fewer errors in their spreadsheets than did the control group. A planned comparison was also conducted using a t-test to compare the performance of the participants in the testing and debugging aid treatment group to the control group. The treatment group had significantly fewer errors in their spreadsheets than did the control group. Fig. 2 shows the differences graphically. Table 2 shows the number of participants, average number of errors, t-value and significance level. All three hypotheses were supported, suggesting that constructs and propositions of SAT are capturing the difficulties of developing spreadsheets. 7.0 Number of Errors
6.0 5.0 4.0 3.0 2.0 1.0 0.0 Control
Planning & Design
Formula Complexity
Group Fig. 2. Number of spreadsheet errors.
Testing & Debugging
209
Table 2 T-test to compare performance Hypothesis one—results Group compared to control
N
Average no. of errors
t-value
Significance level
Planning and design Formula complexity Testing and debugging Control group
27
4.5
1.690
0.048
29
4.6
1.760
0.042
33
4.2
2.360
0.022
28
6.4
n/a
n/a
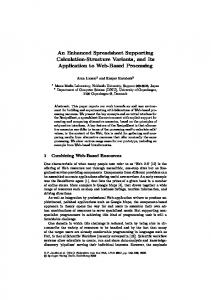
5.1. Supplemental analyses The demographics questionnaire asked several questions about confidence and the perceived quality achieved in the participants’ spreadsheet model. This information was captured both as a discrete variable and as a continuous variable. Three different questions captured the discrete data. One question asked what level participants considered their spreadsheet solution quality; very high, somewhat high, neither high nor low, somewhat low, or very low. Over 90% answered either very high or somewhat high quality. Another question asked participants about their confidence of the accuracy of their solution using the same five choices. Eighty-seven percent of the participants rated their confidence in the accuracy of their solution as either very high or somewhat high. The third question asked participants the grade they deserved using the traditional grading scale of A, B, C, D, and F. Over 96% thought they deserved an A or B, three participants thought they deserved a C, none thought they deserved a D or F; however, one participant felt their model was incomplete. These three attitudinal measures are correlated as demonstrated by the Pearson’s correlation coefficients ranging from 0.62 to 0.82 (pZ0.000). A composite variable was created using the average of these three questions. No significant relation existed between each individual variable or the composite variable and the number of spreadsheet errors. Hypothesis one also was analyzed to determine if the perception quality of an expert spreadsheet developer were consistent with the accuracy of participants’ spreadsheets. In other words, a well-designed spreadsheet would have fewer errors. The 54 spreadsheets of the design/planning and control groups were independently evaluated by an expert. The expert works in a large multinational firm and supervised employees that report financial data within and outside the firm using spreadsheets. The expert grouped the spreadsheets into four levels of quality and defined each level. These levels are presented in Table 3. This measure of spreadsheet quality was significantly correlated with accuracy (rZ0.3, pZ0.014). A box plot of the expert’s ratings of the spreadsheets shows this correlation graphically [28]. Box plots are formed using values within the 25th and 75th percentiles to exclude outliers. The bar within each
210
S.E. Kruck / Information and Software Technology 48 (2006) 204–213
Table 3 Expert’s quality categories and definitions Expert opinion Rank
Expert A
1
Definition Elaboration
Understandable, segmented and reusable Have most required elements, well organized
2
Definition Elaboration
3
Definition
Readable format, something missing Something noteworthy, be it format or understandability Convey information, but format and segmentation need work Some required elements, not executed effectively Not reusable, poor segmentation, poor understandability Few required elements
Elaboration 4
Definition Elaboration
box is the median value. Fig. 3 shows that spreadsheets for the best group identified by the experts contained an average of four errors, while spreadsheets of the worst group contained an average of 24 errors. The expert viewed functionality and spreadsheet segmentation as the two primary indicators of quality. Functionality was defined by the expert as ability of a non-spreadsheet developer to open the spreadsheet without prior knowledge of the spreadsheet details and easily use the spreadsheet. Segmentation was defined as separating the input and output areas so that a user would not inadvertently overwrite a formula. The expert indicated that he would only consider hiring students in the best group. These results also support hypothesis one, and are further evidence of the impact of the design/ planning aid and the validity of the construct. Length of time working on the spreadsheet design/plan was captured by the task instrument and the control and design/planning groups were compared on this measure. The spreadsheet task recorded both the time the participant opened the spreadsheet and left the opening screen using Visual Basic for Applications (VBA). This was done by having participants open the blank bidder task spreadsheet as they received the task statement. Each participant pressed a button when ready to begin entering their solution. This time interval was recorded internally by the computer. The design/planning group averaged 11.21 min designing, while 20 4
E r r 10 o r s 0
N=4 1
10 2
16 3
24 4
Rating Group Rating Group 1 = best 4=worst layout & design
Fig. 3. Box plot of expert’s ratings.
the control group averaged only 5.95 min. This difference was statistically significant (pZ0.003). This supports the face validity of the design/planning aid, i.e. it did influence the behavior of the participants. Supplemental analysis was also performed for formula complexity construct of hypothesis two. Average formula length and length of the longest formula were compared for the control and formula complexity groups. No significant differences were found, i.e. both groups had formulas of similar length, perhaps due to the need to solve the same problem. However, the formula complexity aid also describes the detrimental impacts of using constants versus cell references in formulas. Using constants make it more difficult to change any of the variables in a spreadsheet because the user would be required to change the actual formula. On this measure the groups were significantly different, with the control group averaging 11.36 constants and the formula complexity group averaging 3.14 constants (pZ0.002). Given that the formula complexity group also had significantly fewer errors in their spreadsheet, this finding indicates how this difference may have been achieved. This supports the validity of the formula complexity construct. The results of the primary and supplemental analyses support SAT. All three hypotheses were supported by the primary analyses. The supplemental analyses also support the design/planning and formula complexity constructs. This suggests that the constructs and propositions of SAT can provide a framework for understanding the how, why, and when of the spreadsheet accuracy phenomena. Section 6 presents the implications of these findings for SAT, practice, and teaching of spreadsheet development.
6. Discussion The basic propositions of SAT were confirmed by this study. Support for the hypotheses indicates that the theory is focused on appropriate constructs and propositions. The findings are consistent with previous empirical research that implicitly suggests theory exists in this area. That is, by investigating a variety of approaches for reducing errors, e.g. designing or testing, researchers empirically derived the definition of spreadsheet accuracy. Then, SAT consolidated the research findings and integrated the views of practitioners to begin the process of systematically understanding spreadsheet accuracy. Many research implications exist for SAT. These range from questions of the completeness of the set of constructs to how the interaction of constructs influences spreadsheet accuracy. Other constructs that have not been previously researched or identified by practitioners could exist. With only four constructs SAT is concise. However, it is not yet clear how much of the variance of spreadsheet accuracy can be explained by these constructs. The current study tests only whether the prescribed constructs are related to
S.E. Kruck / Information and Software Technology 48 (2006) 204–213
accuracy. Furthermore, the potential for interactions of the constructs to influence accuracy have not been proposed or tested. Finally, each construct could be evaluated to determine if all the components or only some of the components are responsible for the findings in this study. In addition to the research implications of spreadsheet accuracy theory, we expect the theory will be applicable in practice and teaching. In practice, the aids developed for this study or variations of them that provide a template for defining the conventions the organization could require developers to follow. Of course, these conventions first must be explicitly defined by the organization. SAT can inform the process of defining conventions. The formula complexity construct suggests conventions for the use of constants, splitting of formulas, repeating data, and use of relative or absolute addressing. Indeed, the results of this study suggest that simple policies requiring separation of data areas and user interface areas, requiring cell naming, limits on formula length, or requiring that specific tests be conducted, e.g. range checking of input data, would result in more accurate spreadsheets. Implications for teaching include the benefits of decomposing the large problem of ‘how to teach students to create accurate spreadsheets’ into a set of smaller problems associated with teaching issues for each construct. It seems providing a process overview of spreadsheet development that integrates the design/planning with implementation (formula complexity) and completes with testing activities is consistent with SAT. Problem sets can be designed to demonstrate issues resulting from inadequately considering each construct and failing to coordinate across constructs in their development processes. Students should gain a deeper understanding of spreadsheet development from such an instructional approach. The limitations of the study include the examination of only direct influences on spreadsheet accuracy. It is likely that interactions among the constructs also influence accuracy. Now that the efficacy of constructs and propositions have been shown, a more systematic evaluation of the potential interaction effects of the constructs on spreadsheet accuracy is possible.
7. Conclusion By designing tools to address the issues captured by the design/planning, formula complexity, and testing/ debugging constructs, errors were reduced. This paper presented a test of spreadsheet accuracy theory that examined the relationship of each construct with spreadsheet accuracy. Support for the hypotheses indicates the SAT is consistent with previous research and provides a framework for understanding and influencing the causes of difficulty in the development of spreadsheets.
211
Appendix A A.1. Planning and design aid The items identified and described here are intended to help you create a well-designed spreadsheet. This first sheet is the aid, however, additional instructions and explanations are attached. Please read through the items carefully and use those items that you feel will help you create an error-free spreadsheet. I. Plan your spreadsheet Use a planned layout so that movement (copy, cutting, moving or dragging) of the data after entering it will be minimized II. Use an organized layout to isolate data and computation areas Use some type of layout, such as, a stair-step format or modular layout on different worksheets to isolate data and computation areas so that row or column insertions and deletions will not create errors III. Use descriptive labels If the original data or assumptions change so that the user will know what each data item is, use labels that clearly indicate the input data or assumptions to be changed IV. Repeat the input data (assumptions) near the output (analysis) Using a formula, repeat the input data or assumptions near the area that you will use for computations so that it is more efficient/effective to reference the correct cells
A.2. Formula complexity aid The items identified and described here are intended to help you create formulas that are less complex and therefore less error prone. This first sheet is the aid, however, additional instructions and explanations are attached. Please read through the items carefully and use those items that you feel will help you create an errorfree spreadsheet. I. Formulas should contain only cell references Use only cell references in formulas so that any number can be changed without having to redo any formulas II. Formulas can be used to repeat data in other locations Use formulas to repeat data from the input area to the formula area so that it is easier to use the correct cell reference/data in the formula III. Split complex formulas Use multiple formulas as intermediate steps for any complicated calculations to make formulas less complex IV. Relative and absolute cell addressing should be used where appropriate Use relative cell addresses when you want the cell addresses in the copied formula to re-adjust, and use absolute cell addresses when you do not want the referenced cell to change
A.3. Testing and debugging aid The items identified and described here are intended to help you test and debug your completed spreadsheet. This first sheet is the aid, however, additional instructions and explanations are attached. Please read through the items carefully and use those items that you feel will help you create an error-free spreadsheet.
212
S.E. Kruck / Information and Software Technology 48 (2006) 204–213
I. Use Excel’s auditing tools to verify formulas Use Excel’s auditing tool (Tools, Auditing, Show Auditing Toolbar) to trace all dependent and precedent cells to determine that the correct cell locations are used in formulas II. Review worksheet for error messages Look for error messages and correct, such as #####—indicates cell is to narrow #DIV/0!—indicates a division by 0 #VALUE!—indicates an incorrect type of argument in a function CIRC—indicates a reference to itself III. Determine if the numbers look reasonable Use your understanding of the problem to decide if the results are reasonable (e.g. income is less than expenses, there should be a loss) IV. Verify all calculations with a calculator or test with known models Use a calculator to confirm that the formulas are correct or confirm the model by using real or historical numbers
A.4. The task—‘Bidder’ Please open the file ‘Bidder’ contained on your disk before proceeding. Put your social security in the text box that appears when you open ‘Bidder.’ You are starting a new business to remodel kitchens for residential houses. Your task is to build a spreadsheet template model that will calculate two bids for your customers. You should determine the cost so that the customer can make modifications and you can easily determine a new price. (Plus, you will want to reuse this model for all your customer bids.) Base your model on the following information. (You may use a calculator or the back of any of these sheets for scratch paper.) Your performance will not be graded on formatting, only on logic. Your current customers would like to remodel their kitchen. They are looking at two different options and would like a bid for both. Your model should include bids for ‘Kitchen A’ and ‘Kitchen B.’ Any donations or sale of leftover material will reduce the cost of that room. Your bid must add a profit margin of 30% to your net expected cost (expected total cost less any reduction for donated or sold items). The kitchen is (21!15), large enough to include a breakfast nook. The flooring for either plan will cost $16.50 per square foot. The kitchen will require chair molding which will cost $5.35 per linear foot for Kitchen A and $10.45 per linear foot for Kitchen B. You will have 11 ft leftover (due to the way it will need to be cut) which you will sell to another builder for 1/2 the cost. The cabinets will cost $47.50 per cabinet for Kitchen A and $65.00 per cabinet for Kitchen B and each kitchen requires 15 cabinets. Both kitchens require 25 boxes of tile for the counter. Kitchen A tile will cost $12.75/box and Kitchen B tile will cost $9.50/box. The refrigerator will cost $1000 and require a door to match the cabinets for Kitchen A or Kitchen B. This means that you can sell the door at the flea market for $50; however, you need to purchase an additional cabinet for
the matching door. But you can sell the additional cabinet backing (everything but the door that you will need for the refrigerator) for 1/2 of the cost to one of your workmen. The stove/oven combination will cost $650 and comes with an exhaust hood. Kitchen B will use a gas stove at the same price. However, a gas line will be required and the materials will cost $285. You will put in a microwave over the stove and can donate the exhaust hood to the Habitat for Humanity house for $25. The oven does not come with racks so you will need to purchase two; however, they come in sets of four for $100 so you will sell the extra racks for $35 to one of your workmen. The microwave will cost $250 for Kitchen A and $355 for Kitchen B. Kitchen B will require a special lighting and fan fixture that will cost $250. Your crew of five will need 4 days to complete the Kitchen A, but 5 days to complete Kitchen B. Each person of your crew will be paid $10/h for 8 h/day plus 20% additional for benefits. You will remove all old appliances and sell them for $295. Your performance will be graded on how well you use your assigned aid, not on formatting. [Control group: Your performance will be graded on how well you create the spreadsheet model] Please be sure to save your spreadsheet model. The file name should be ‘Bidder.xls.’
References [1] K. Anderson, A. Bernard, Micros in accounting: spreading mistakes, Journal of Accounting and EDP 3 (1988) 42–45. [2] P.L. Bewig, In excel, cell names spell speed, safety, Journal of Accountancy 196 (2003) 68–71. [3] P. Brown, J. Gould, An experimental study of people creating spreadsheets, ACM Transactions on Office Information Systems 5 (1987) 258–272. [4] R.J. Butler, Is this spreadsheet a Tax Evader? How H.M. Customs and Excise Test Spreadsheet Applications, Proceedings of the ThirtyThird Hawaii International Conference on System Sciences, 2000. [5] T. Callahan, Block that spreadsheet error, Accountancy of Accounting 194 (2002) 59–63. [6] S. Connors, NAAA research, Management Accounting (1984) 16–65. [7] S. Connors, NAAA research, Management Accounting (1983) 62–63. [8] P.G. Cragg, M. King, Spreadsheet modeling abuse: an opportunity for OR?, Journal of Operational Research Society 44 (1993) 743–752. [9] R. Creeth, Microcomputer spreadsheets: their uses and abuses, Journal of Accountancy 159 (1985) 90–93. [10] H.M. Customs and Excise Computer Audit Service, Methodology for the Audit of Spreadsheet Models, 2001. [11] N. Davies, C. Ikin, Auditing spreadsheets, Australian Accountant (1987) 54–56. [12] P. Davis, What computer skills do employers expect from recent college graduates?, Technological Horizons in Education Journal (1997) 74–78. [13] W.R. Edge, E.J.G. Wilson, Avoiding the hazards of microcomputer spreadsheets, Internal Auditor (1990) 35–39.
S.E. Kruck / Information and Software Technology 48 (2006) 204–213 [14] J.F. Hair Jr., R.E. Anderson, R.L. Tatham, W.C. Black, Multivariate Data Analysis, Prentice-Hall, Upper River Saddle, 1995. [15] K. Hassinen, An Experimental Study Of Spreadsheet Errors Made By Novice Spreadsheet Users, Department of Computer Science, University of Joensuu, Joensuu, Finland, 1988. [16] C.D. Heagy, P.L. McMickle, An empirical investigation of the accounting systems course: academic practice versus practitioner needs, Issues in Accounting Education 3 (1988) 96–107. [17] C.D. Heagy, R.A. Gallun, Recommended microcomputer knowledge for accounting graduates: a survey, Journal of Accounting Education 12 (1994) 205–210. [18] L. Hicks, Capital Budgeting Spreadsheet Code Inspection At NYNEX, 1995. [19] How Personal Computers Can Trip Up Executives (September 24). Business Week (1984) 94–102. [20] D. Janvrin, J. Morrison, Factors influencing risks and outcomes in end-user development, Proceedings of the Twenty-Ninth Hawaii International Conference on System Sciences, 1996, pp. 346–355. [21] G. Keppel, Design and Analysis: A Researcher’s Handbook, PrenticeHall, Upper River Saddle, 1991. [22] J. Klobas, T. McGill, Spreadsheet knowledge: measuring what user developers know, Journal of Information Systems Education Winter (2004) 427–436. [23] S.E. Kruck, S.D. Sheetz, Spreadsheet accuracy theory, Journal of Information Systems Education 12 (2001) 93–108. [24] A. Krull, Computer rip-offs and foul-ups: is management to blame?, EDPACS 16 (1989) 10–14. [25] D.M.S. Lee, Usage pattern and sources of assistance for personal computer users, MIS Quarterly 10 (1986) 313–325. [26] J. Mingers, The content of MSc operational research courses: results of a questionnaire of OR groups, Journal of Operational Research Society 42 (1991) 375–385. [27] M. Morrison, J. Morrison, J. Melrose, E.V. Wilson, A visual code inspection approach to reduce spreadsheet linking errors, Journal of End User Computing 14 (2002) 51–63. [28] M.J. Norusis, SPSS Guide to Data Analysis, Prentice-Hall, Upper River Saddle, 1997. [29] R.R. Panko, Finding spreadsheet errors; most spreadsheet models have design flaws that may lead to long-term miscalculations, Informationweek (1995) 100.
213
[30] R.R. Panko, Hitting the wall: errors in developing and debugging a simple spreadsheet model, Proceedings of the Twenty-Ninth Hawaii International Conference on System Sciences, 1996, pp. 356–363. [31] R.R. Panko, Applying code inspection to spreadsheet testing, Journal of Management Information Systems 16 (1999) 159–176. [32] R.R. Panko, R.P. Halverson Jr., Individual and group spreadsheet design: pattern of errors, Proceedings of the Twenty-Seventh Hawaii International Conference on System Sciences, 1994 pp. 4–10. [33] R.R. Panko, R.P. Halverson Jr., Are two heads better than one? (at reducing errors in spreadsheet modeling), Office Systems Research Journal (1997) 15. [34] R.R. Panko, R.H. Sprague Jr., Hitting the wall: errors in developing and code inspecting a simple spreadsheet model, Decision Support System 22 (1998) 337–353. [35] R. Schultheis, M. Sumner, The relationship of application risks to application controls: a study of microcomputer-based spreadsheet applications, Journal of End User Computing 6 (1994) 1–18. [36] M.G. Simkin, Micros in accounting: how to validate spreadsheets, Journal of Accountancy 164 (1987) 130–138. [37] M.G. Simkin, Ferret out spreadsheet errors, Journal of Accountancy 197 (2004) 62–67. [38] T.S.H. Teo, J.E. Lee-Partridge, Effects of error factors and prior incremental practice on spreadsheet errors detection: an experimental study, Omega 29 (2001) 445–456. [39] T.S.H. Teo, M. Tan, Spreadsheet development and ‘what-if’ analysis: quantitative versus qualitative errors, Accounting Management and Information Technologies 9 (1999) 141–160. [40] M. Tukiainen, Comparing two spreadsheet calculation paradigms: an empirical study of novice users, Interacting with Computers 13 (2001) 427–446. [41] T.C. Waller, R.A. Gallun, Microcomputer competency requirements in the accounting industry: a pilot study, Journal of Accounting Education 3 (1985) 31–40. [42] P. Watt, The power—and pitfalls—of electronic spreadsheets, Government Finance Review (1985) 32–33. [43] Y. Yoon, Applications-oriented spreadsheet instruction in financial model building: an extension, Financial Practice and Education (1995) 143–147. [44] J.J. Zhao, Computer end-user skills needed by business professionals now and toward, Journal of Computer Information Systems 2000 37 (1997) 24–29.