Testing the Educational Potential of 3D Visualization Software in Oral Radiographic Interpretation Julijana Vuchkova, Ph.D.; Terrence S. Maybury, Ph.D.; Camile S. Farah, Ph.D. Abstract: There is heightened optimism about the potential of 3D visualization software as an alternative learning resource in radiology education. The purpose of this study was to investigate the effect of 3D visualization software on students’ learning of oral radiographic interpretation from 2D radiographic images. Fourth-year dental students underwent a learning intervention phase of radiographic interpretation of oral pathoses using 3D visualization software. The success of the educational intervention was assessed by quantitative means, using a radiographic interpretation test, and by qualitative means, using a structured Likertscale survey, asking students to evaluate their own learning outcomes. It was anticipated that training with the rotational mode of 3D visualization software would provide additional depth cues, enabling students to create spatial-mental models of anatomy that they can apply to 2D radiographic interpretation of oral pathoses. Although quantitative assessment did not support this, questionnaire evaluations demonstrated a positive effect of the 3D visualization software by enhancing students’ learning about radiographic interpretation. Despite much optimism about the educational potential of 3D visualization software, it is important to understand the interactions between learners and such new technologies in order to identify potential advantages and limitations prior to embracing them as learning resources. Dr. Vuchkova is Lecturer, UQ Centre for Clinical Research and School of Dentistry, University of Queensland, Royal Brisbane Women’s Hospital; Dr. Maybury is Lecturer, UQ Centre for Clinical Research and School of Dentistry, University of Queensland, Royal Brisbane Women’s Hospital; and Dr. Farah is Associate Professor, UQ Centre for Clinical Research and School of Dentistry, University of Queensland, Royal Brisbane Women’s Hospital. Direct correspondence and requests for reprints to Dr. Camile S. Farah, Centre for Clinical Research, University of Queensland, Royal Brisbane Women’s Hospital, Herston, QLD 4029, Australia; 61-7-3346-6030 phone; 61-7-3346 6098 fax;
[email protected]. Keywords: computers in dentistry, computer-assisted instruction, curriculum, educational technology, dental education, radiology education, 3D visualization, spatial knowledge, cone beam CT Submitted for publication 11/16/10; accepted 4/19/11
R
adiology education is intimately linked with the study of anatomy and pathology. The understanding of pathosis on radiographic images requires advanced knowledge of anatomy. Traditional resources such as printed diagrams, cadaver dissections, and bench top models of the human skull have been used to assist students with their learning of not only structure and function of anatomy, but also with understanding of the threedimensional (3D) relationships of various anatomical structures. These traditional learning resources have numerous limitations and cannot always provide 3D visualization of the soft tissue structures in relation to hard tissue structures. The most important aspect of the learning and teaching of anatomy is to tailor the education in a manner that will provide students with spatial mental models that they can apply to everyday practice. This is especially important in radiology, in which practitioners need to routinely examine radiographic images and to extract 3D information from two-dimensional (2D) representations of the anatomy.
November 2011 ■ Journal of Dental Education
With the ongoing development of digital technologies, computer-mediated imaging aids are becoming increasingly popular among health professionals with studies showing that assessment and diagnosis are faster and more accurate with these aids.1-5 Similarly, interactive 3D visualizations of anatomical structure and function are becoming increasingly prevalent in medicine for educational purposes, being praised as an alternative to traditional learning resources. In particular, radiology professionals are suggesting a potentially significant impact of 3D visualization on the education and training of radiologists.6-8 3D visualization has the potential ability to enhance students’ learning process. It can help students understand anatomical relations and provide additional depth cues (compared to pictorial depth cues in 2D representations), including motionbased depth cues by being able to rotate the image in many directions. An example of 3D visualization is cone beam computed tomography (CBCT). With recent ad-
1417
vances in digital radiography and the subsequent shift from hard- to soft-copy reporting, practitioners requesting CBCT scans now receive and use associated 3D software for interpreting supplied images. The software enables 3D visualization of a patient image, surface rendering, volume rendering, and maximum intensity projection (MIP), as well as a rotational mode, enabling rotation of the object in any direction. This 3D visualization application enables spatial representation of the anatomical and pathological structures by providing the viewer with depth cues. For instance, interpreting the position of a soft tissue calcification from a 2D radiographic image such as the panoramic radiograph can be difficult. The precise location of pathosis can be better identified with 3D visualization software that can provide spatial representation of the soft tissue calcification relative to the anatomical structures. Therefore, it seems credible to utilize such 3D visualization software as educational resources to assist student learning of radiographic interpretation from 2D radiographic images such as the panoramic radiograph. Despite much optimism about the educational potential of 3D visualization software, there is limited understanding of how learners will interact with these technologies and whether they will embrace their potential as learning resources. The aim of this study was to investigate the effect of using such 3D visualization software on dental students’ learning and understanding of radiographic interpretation of oral pathosis. With researchers suggesting that radiographic interpretation of 3D information is closely linked to visual-spatial ability,9 this study also set out to determine a possible correlation between visual-spatial ability and the ability to interpret 3D information from radiographs regarding oral pathosis.
Materials and Methods Fifty-nine fourth year (out of a five-year predoctoral curriculum) dental students (twenty-one males, thirty-eight females) attending the School of Dentistry at the University of Queensland in 2009 participated in a voluntary study to determine the effectiveness of 3D CBCT visualization software (EzyImplant, Vatech, Korea) as compared to conventional reference books in learning radiographic interpretation of oral pathosis. Fourth-year dental students specifically were invited to participate in the study as they had prior knowledge of oral pathology,
1418
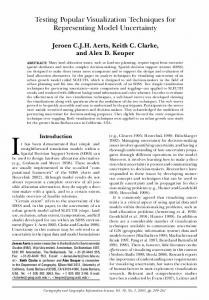
anatomy, and radiography. All aspects of the study were approved and performed in accordance with the guidelines of the ethical review process of the University of Queensland. The design was a before and after experimental study with self-controls organized into three parts, all of which took place in a single day. In the first part, participants were assessed on their visual-spatial ability, as well as their radiographic interpretation of oral pathosis as seen on a panoramic radiograph, in the form of a multiple-choice question (MCQ) test. In the second part—the intervention phase—participants underwent training in object depth localization utilizing the 3D software to analyze depth relationships on a panoramic radiograph. The third part was performed immediately after the intervention phase, in which participants were reassessed on their interpretation of oral pathosis as seen on a panoramic radiograph, using a second MCQ test. Finally, the participants were asked to complete a questionnaire to provide their impressions regarding the effect of the 3D software on their learning of oral radiographic interpretation as compared to conventional oral radiology textbooks. The questionnaire was designed with a four-point Likert scale, with the options strongly agree, agree, disagree, and strongly disagree, to determine whether this 3D software enhanced student learning of radiographic interpretation of oral pathosis. Training in depth object localization was performed in a group-learning setting using the 3D software and nine cases of pathosis. The training lasted ninety minutes and was supported by a lecturer in oral pathology (author C.S.F.), who provided interactive discussions of the cases. Each case was presented initially as an original panoramic radiograph, while the lecturer initiated discussions regarding the anatomical location and differential diagnosis of the pathosis. The same case was then presented again using the 3D software, in particular the 3D view of the skull that enables rotation of the image in any direction to better visualize the exact location of the pathosis. The case was discussed again in the same manner, with the lecturer supporting discussions regarding the anatomical location and differential diagnosis of the pathosis (Figure 1). It was anticipated that presenting the cases in this manner would give students an appreciation of the depth of localization of the object when comparing the 3D view to the panoramic view. Since none of the participants had prior interaction with the 3D
Journal of Dental Education ■ Volume 75, Number 11
Figure 1. Example of the 3D navigational image provided by 3D cone beam computed tomography (CBCT) visualization software (EzyImplant)
software, the lecturer introduced the 3D software and gave an instructional lecture (in the same group learning setting) on its use immediately before proceeding with the learning intervention. The assessment of radiographic interpretation, which took place both pre- and post-intervention, consisted of twelve MCQs based on radiographic signs of pathosis as seen on panoramic radiographs (Figure 2). The MCQ test was provided to each participant in hard-copy format, whereas the panoramic radiographs corresponding to each question were provided in the form of a PowerPoint presentation projected to the entire class on dual screens with all panoramic radiographs presented in the same order as the questions. The total time allocated was twentyfour minutes (two minutes per question), and each student was asked to circle the one correct answer (out of four alternatives) on the hard copy provided. The two MCQ tests were standardized such that the questions asked were of equal relevance and difficulty
November 2011 ■ Journal of Dental Education
(as reviewed by the lecturer, author C.S.F.), and a certain number of the panoramic radiograph images used in the first test were reused in the second test. The MCQ tests were marked by one of the authors (J.V.) in a blinded manner, and the scores from each test were compared for each student. To ensure anonymity while simultaneously being able to compare the scores from the two MCQ tests, each participant used a randomly allocated number, anonymous to the marker. The aim of comparing the scores from the two MCQ tests was to determine, quantitatively, whether the 3D software had a significantly positive effect on student learning of radiographic interpretation of oral pathosis. All participants underwent assessment of their visual-spatial ability using the redrawn Vandenberg and Kuse mental rotations test version A (MRTA).10 This is the most commonly used version of the MRT, which examines the ability to mentally rotate figures around the vertical axis. The test consisted of
1419
Figure 2. Representative multiple-choice questions asked on the radiographic interpretation test (MCQ test), with correct answers in bold
twenty-four items, and for each item a target figure was presented on the left and four stimulus figures on the right (Figure 3). For all items, two of the four stimulus figures were rotated versions of the target figure. Participants had to mentally rotate the figures and identify the two rotated versions of the target figure. A score of 1 was given only if both choices were correct. The maximum score was 24. These instructions, procedures, and scoring methods were identical to those reported by Peters et al.10 The score obtained on the MRT was compared to the score
1420
obtained on the MCQ tests to determine a putative correlation between visual-spatial ability and the ability to interpret 3D information from 2D radiographs. Statistical analysis of groups was performed using the Student’s t-test for two sample data, and statistical significance was accepted at the level p