The Geological Society of America Special Paper 492 2012
Testing the effects of prior coursework and gender on geoscience learning with Google Earth Janice Gobert* Social Sciences and Policy Studies, Worcester Polytechnic Institute, 100 Institute Road, Worcester, Massachusetts 01609-2280, USA Steven C. Wild* Old Dominion University, Physics Department, 4600 Elkhorn Ave., Norfolk, Virginia 23529, USA Lisa Rossi* Social Sciences and Policy Studies, Worcester Polytechnic Institute, 100 Institute Road, Worcester, Massachusetts 01609-2280, USA ABSTRACT Two sets of learning activities in Google Earth were developed for use by geoscience majors and non-science majors. The first activity aimed to foster undergraduate students’ understanding of the geography and basic geology of Iceland. We tested the efficacy of this activity for learning with 300 undergraduates from a university in the southeastern part of the United States. In terms of post- versus pre-test scores we found: (1) overall learning gains when collapsing over type of prior knowledge and gender, (2) no differences in learning gains when comparing those with prior coursework in geology or geography to other students without such prior coursework, and (3) no differences in learning gains when comparing males and females. In terms of items completed during the lab exercise, again we found no differences by prior coursework (prior geology, prior geography, or none), and no differences by gender. Lastly, moderate positive correlations were found between students’ pre-test and post-test scores, as well as between students’ embedded lab scores and post-test scores. For the second activity, we developed a laboratory activity about the classic Tonga region of the west Pacific in order to support undergraduate students’ understanding of: (1) the physical geography of the Tonga Subduction System, (2) the dynamic geological processes involved in plate movement, subduction, magmatic arc evolution, and trench rollback, and (3) geological processes resulting from subduction, including volcanism, and earthquake formation. Using the program called Sketch-Up, we created 3-D COLLADA (three-dimensional COLLAborative Design Activity) models
*
[email protected];
[email protected];
[email protected]. Gobert, J., Wild, S.C., and Rossi, L., 2012, Testing the effects of prior coursework and gender on geoscience learning with Google Earth, in Whitmeyer, S.J., Bailey, J.E., De Paor, D.G., and Ornduff, T., eds., Google Earth and Virtual Visualizations in Geoscience Education and Research: Geological Society of America Special Paper 492, p. 453–468, doi:10.1130/2012.2492(35). For permission to copy, contact
[email protected]. © 2012 The Geological Society of America. All rights reserved.
453
454
Gobert et al. that are viewable as four-dimensional animations in the Google Earth API (application programming interface; a web-based version of Google Earth) to help demonstrate several geophysical processes. These animations potentially have a wide range of learning application from basic to more abstract ideas. Specifically, the learning objects created involve the Pacific Plate subducting underneath the Australian Plate in the Tonga Region. These are designed to help show subduction, active and dormant volcanoes, back-arc spreading, trench rollback, and migration of the tear point that marks the northern termination of the subduction system. We tested the efficacy of this activity with 127 undergraduates from a university in the southeastern part of the United States. In terms of post- versus pre-test scores we found: (1) overall learning gains when collapsing over type of prior knowledge and gender, (2) no differences in learning gains when comparing those with prior coursework in geology or geography to other students without this prior coursework; and (3) no differences in learning gains when comparing males and females. For the lab activity itself, we found no differences by prior coursework (geology and/or geography versus none), but found a gender difference favoring males; however this learning did not show up as statistically significant at post-test (as previously mentioned). Lastly, moderate positive correlations were found between students’ pre-test and lab scores. Data is discussed with respect to Google Earth’s utility to convey basic geoscience principles to non-geology undergraduates and its potential impact on public understanding. This is important and aligned with many current educational reform efforts (the American Association for the Advancement of Science, National Science Education Standards), which call for broader scientific literacy.
INTRODUCTION Learning in this Domain: Why is it Difficult? The domain chosen for this study is plate tectonics, the lead paradigm for understanding the origin and evolution of Earth’s surface features including continents, oceans, and island arcs. This is a difficult topic to learn both because of the hidden mechanical processes, which are outside our direct experience, and because it involves several different types of knowledge including spatial, causal, and dynamic knowledge (Gobert and Clement, 1999; Gobert, 2000). Specifically, conceptual understanding in this domain requires understanding the spatial arrangement of the various material components of the earth (i.e., spatial/static information) as well as understanding the movements within these layers and their dynamic causes (i.e., primordial core) and radioactive sources of heat (i.e., mantle) that must escape Earth’s deep interior (KamLAND Collaboration, 2011), convection of solid material through the mantle (Wilson, 1973), plate movements, divergence and convergence at plate boundaries, and the interaction of surface plates with deep mantle plumes (Morgan, 1972). In addition to acquiring two types of knowledge (spatial/static and kinematic/dynamic), several concepts need to be integrated into a complex causal chain to build a rich, 4-D mental model of the system (Gobert and Clement, 1999; Gobert, 2000). From these mental models, predictions and inferences can be made about the system’s behavior: in the case of plate tectonics, explaining or depicting
locations of earthquakes and volcanoes, sea-floor spreading, mountain building, and island-arc evolution. Among the most difficult concepts that we present to students are (1) plate-plume interaction as in Iceland (Ito and Lin, 1995), and (2) trench rollback as in the Tonga region (Isacks et al., 1968). Iceland stands high above sea level because it marks the intersection of the Mid-Atlantic Spreading Ridge and a deep mantle plume emanating from the core-mantle boundary. Students thus have to visualize two processes with very different length and time scales. Time scale is particularly difficult to understand, even for graduate students of geology (Jacobi et al., 1996). Tonga is the type locality for the process of trench rollback whereby the line along which the plate bends into a subduction zone migrates in the opposite direction to the material of the plate (Uyeda and Kanamori, 1979; Rosenbaum and Lister, 2004; Moores and Twiss, 1995). At Tonga, for example, the rocks of the Pacific plate move westward while the trench marking the initiation of subduction migrates east. Relevant Work on Learning in Geoscience Google Earth, a fairly new program (version 1 was released in 2005), constructs pictures of Earth by downloading satellite data from a remote terabyte server (Lisle, 2006) and rendering them on a virtual globe in real time. The program is interactive so that the location and size of the region viewed is under full control of the learner/user; the user can zoom in, pan, and tilt the terrain from any desired viewpoint, and the surface imagery
Testing the effects of prior coursework and gender on geoscience learning communicates information in a format that is more intuitive and realistic than paper maps and cross-sections (Whitmeyer et al., 2010). This last feature makes them useful for learning and reasoning for experts in the domain, as well as for students and lay people, e.g., non-science majors (this is addressed more fully later in the paper). It is argued that Google Earth is a tool that can help build scientific literacy on a broad scale because it and other geotechnologies are ways to give citizens basic knowledge of geography (Sanchez, 2009) and geoscience (Thompson et al., 2006). Secondly, in addition to basic content knowledge, some researchers claim that working in Google Earth can hone one’s data analysis and interpretation skills, which, many argue, are becoming increasingly important in scientific and industrial fields. As an extension to this latter point, it has been further argued that the ability to use images and spatial technologies is necessary in order to participate in modern society (Bednarz et al., 2006) since information and data tends to be displayed in spatially oriented formats. To date, there have been a fairly large number of studies that address learning in geoscience, but most of these have been conducted with a pre-college population (Libarkin and Anderson, 2005), and studies on college students or other adults only emerged within the last decade or so (cf. DeLaughter et al., 1998; Trend, 2000; Libarkin, 2001; Libarkin et al., 2005; Dahl et al., 2005). Amongst the research on this topic with an adult population, the research that is most closely related to the present research is the research on learning with visualizations in geoscience (cf. Hall-Wallace and McAuliffe, 2002; Whitmeyer et al., 2009; Thompson et al., 2006). With respect to training students in geoscience specifically, recent reform efforts emphasize the need to utilize technology in teaching and learning (Stout et al., 1994; National Research Council, 1996), which has translated into greater demand for technology-based teaching methods (Cruz and Zellers, 2006). In parallel, there also have been demands for greater instructor accountability for students’ learning at all levels, as decreasing enrollment trends continue in the STEM (science, technology, engineering, and mathematics) disciplines (McConnell et al., 2006). Although learning with Google Earth has been touted as having great potential for improving students’ knowledge about geological phenomena, spatial skills, problem-solving, etc., and the fact that, intuitively it appears to have many affordances for geoscience learning (Cruz and Zellers, 2006; Whitmeyer et al., 2009), there are relatively few studies that either characterize the learning processes that students engage in while learning with Google Earth, or that address the efficacy of learning with Google Earth. Characterizing Learning Processes with Google Earth It has been noted that Google Earth (referred to herein as GE) offers a benefit over more traditional GIS (geographic information systems) in that GE can be implemented into classrooms at any level because it has relatively few tools and thus less over-
455
head for the teacher in learning it (Patterson, 2007; Bodzin et al., 2012). In terms of the utility of GE for college professors and high school teachers, GE only requires a basic knowledge of scripting languages in order to construct materials (Whitmeyer et al., 2010). For example, GE has been used in high school classrooms for virtual exploration of geologic features to support students’ understandings of geological processes (Fermann, 2006; Stahley, 2006). Similarly, Sanchez (2009) describes implementations in which a teacher developed a geological map that encompasses layers of data about earthquakes and volcanoes. Here, it was suggested that these implementations help students to identify different aspects of oceanic crust formation and understand the mid-ocean ridge system. Lastly, Patterson (2007), who has used GE for middle school instruction, suggested that GE’s interactive exploration capacity helps students understand the spatial context of their location and engage in spatially oriented learning in an entertaining and meaningful manner. Studies that have Addressed the Efficacy of Google Earth One study compared GE to traditional textbook materials for undergraduates’ learning of landforms (Cruz and Zellers, 2006). Findings revealed that students in the GE condition gained deeper understanding of the content compared to those in the traditional textbook condition. Furthermore, those students who had previous exposure to GE performed better than those who did not. Similarly, Martin and Treves (2008) showed that GE is effective to help students and the general public (i.e., non-majors) visualize both scientific data and science content in 3-D. Martin and Treves (2008) stressed the importance of promoting active learning and dissuaded the development of “flashy” 3-D animations, since students, who by definition lack expertise, do not know what is salient in order to engage in knowledge acquisition from information sources (Gobert, 2005a). Bodzin and Cirucci (2009) similarly noted that resources such as GE, when used in conjunction with appropriately designed instructional materials, show much potential in promoting students’ spatial thinking. In two innovative studies in which students constructed their own materials using GE, learning gains were obtained. First, Whitmeyer et al. (2009) had undergraduates use handheld computers to collect lithologic and structural data and then analyze it in order to construct geologic maps of their field areas. This approach, according to the authors, familiarizes students with GE tools, and in turn, can be useful in improving students’ interpretations of field geology. Similar results have been found in which students constructed their own representations of geoscientific phenomena (Gobert and Clement, 1999; Gobert, 2000; Gobert and Pallant, 2004; Gobert, 2005b). In another study, Thompson et al. (2006) showed students how to create their own content in GE. Here, not only did students learn important design elements and skills, but students also reported that these skills were amongst the most important that they learned in their geoscience program. These last studies described address an important issue underlying learning with visualizations; that is, that deep learning
456
Gobert et al.
with visualizations typically requires accompanying materials, scaffolds, etc., in order to support and guide students in their learning processes. This is critical since students often do not know what is salient within these rich visual information sources (Lowe, 1993) because they present all information simultaneously (see Larkin and Simon [1987] and Gobert [2005a] for more on this topic).
TABLE 1. AN EXAMPLE OF TWO QUESTIONS FROM THE PRE- AND POST-TEST, ICELAND ACTIVITY Q8 What is the principle rock type seen in Iceland (i) limestone (ii) basalt (iii) granite (iv) marble Q9 Which best describes the geological origins of Iceland? (i) Iceland sits on top of both a deep mantle plume and a divergent plate boundary. (ii) Iceland is a fragment of continental crust, like Britain and Ireland, that detached from the European margin during North Atlantic spreading. (iii) Iceland is a volcanic island arc forming above a subduction zone. (iv) Iceland is a huge floating mass of ice drifting very slowly away from Greenland.
RATIONALE In our project, we address the learning gains for two different units developed in GE. In particular, in each study we address the efficacy of those with prior coursework in geology and geography, compared to non-majors with no prior coursework in these domains. Secondly, although it was not part of the original design of the research, we compare the learning gains of both males and females, since many studies have shown that females lag behind males in their learning of geoscience concepts due to their inherent spatial nature and females’ oft-reported diminished spatial skills (Kahle et al., 1993; Dabbs et al., 1998; Burkham et al., 1997; Britner, 2008).
TABLE 2. AN EXAMPLE OF A QUESTION ASKED IN THE ICELAND LAB ACTIVITY 15.1 Wait for the images to load, then drag the time slider in order to reveal the deep mantle plume under Iceland (Fig. 15). Compare the height (thickness) of the plume and the thickness of the lithosphere:
STUDY 1
…………………………………………………………………………….
Purpose In the first study, we developed a GE activity to support students’ understanding of the geography and basic geology of Iceland. We tested the efficacy of this activity in terms of post- versus pre-test scores for: (1) overall learning gains as measured by preand post-tests, (2) differences in learning gains when comparing those with prior coursework in geology or geography to other students without such prior coursework, and (3) differences in learning gains when comparing males and females. Lastly, we also compared students’ learning on the lab activity itself (i.e., the pedagogical activities that were completed as part of the lab). Method Participants A total of 225 undergraduate students from a southeastern university participated in this study as part of their coursework1; age data for the participants was not collected. All students were part of the same large lecture; there were nine sections of the lab that corresponded to the lecture from which our data was drawn. Materials Pre-Test/Post-Test The pre-test and post-test consisted of the same set of 10 questions on basic geological and geographical knowledge of
Estimate how deep the plume extends: ……………………………………………………………………………..
Iceland as well as one question asking about prior experience studying this topic (Table 1). Of these questions, nine were multiple choice, and one asked participants to locate Iceland on a provided map. The pre-test served to determine a baseline of prior knowledge that a participant had coming into the activity, while the post-test determined what knowledge was gained as a result of participating in the lab activity (Table 2). All items were developed by experts in the area of geoscience as part of three ongoing projects (NSF-CLLI #0837040, De Paor and Whitmeyer, 2008; NSF-GEO #1034643, De Paor and Whitmeyer, 2010; NSF-DUE #1022755, De Paor et al., 2010). Some examples of items on the pre- and post-test are given below; the full set of items is included in Appendix A2. Lab Activities for Iceland The Iceland lab activity consisted of a series of tasks that were designed to develop students’ understanding of the geography and geology of Iceland. Tasks included: locating Iceland in Google Earth, specifying its relationship geographically with respect to the Arctic Circle, using the time slider to observe the GSA Data Repository item 2012308, Appendices A and B, is available at http://www.geosociety.org/pubs/ft2012.htm, or on request from editing@ geosociety.org. 2
Data were collected, coded, and stored in compliance with the requirements as outlined by Federal Policy for the Protection of Human Subjects. 1
457
Testing the effects of prior coursework and gender on geoscience learning horizon, asking students what they would expect to see here at the Winter Solstice, observing the landscape, geological features (e.g., rock types), and other characteristics of Iceland’s urban and rural landscapes by driving around in a virtual car, observing the formation of the Mid-Atlantic Ridge by using a time slider, noting how the Mid-Atlantic Ridge is displaced across the Gibbs Fracture Zone, and observing the deep mantle plume under Iceland.
The last part of the lab consisted of the post-test. The post-test is the same as the pre-test. Each student was given a post-test and upon completion was allowed to leave the lab. No collaboration was allowed during the pre- or post-tests. The pre-test, lab activity, and post-test were all completed in one, two-hour lab period.
Procedure
Pre- and Post-Test Scoring The pre- and post-tests consisted mainly of multiple choice questions and were scored on a partial- or full-credit basis. A participant could earn a maximum of two points on each question for choosing the correct answer, one point for choosing a partially correct answer, and zero points for choosing an incorrect answer. Some questions had more than one possible answer worth one point, as shown in Table 3. Answer “iii” is worth two points, answers “i,” “iv,” or “v” are each worth one point, and answer “ii” is worth zero points.
Students initially were given consent forms, with verbal explanation, and a tracking identification number was assigned. Identification numbers were based on the course lab number, the beginning five digits, and then some digits after that given by the lab teaching assistant. Students were informed to not use their university identification numbers. Labs and pre- or post-tests with university identification numbers were not used and were removed from the study. Once the consent forms were completed and tracking identification numbers administered, each student was given a pre-test. If students finished their pre-test early, they were asked to wait quietly while others finished. The students worked in groups of two to four depending on the lab section, with lab sections having different numbers of students. Students were encouraged, sometimes with help from instructors, to take turns working on the computers. Instructors were only allowed to help if students had technical problems but not with lab material itself. The students were informed that the lab itself would not be graded as part of their lab score, which may have had an effect on the way students answered questions or participated during lab. As students completed the labs, they were collected and the students were asked to wait for their fellow classmates to finish.
Data scoring
Lab Items Scoring The lab activity consisted of seven open response or “yes/ no” questions, which were scored on a partial credit basis out of a possible one, two, or three, depending on the question. The scoring scheme for a three-point question is shown below in Table 4. Each correctly circled answer earned one point, and the open response portion was scored as zero, 0.5, or one point based on accuracy and detail. Results Data were analyzed to address overall learning gains from the Iceland lab, as measured by pre- and post-tests, as well as to test whether there were any learning gain differences due to prior
TABLE 3. QUESTION 2 AND ITS CODING SCHEME FOR THE ICELAND ACTIVITY Q2 Where is Iceland relative to the Arctic Circle? Scoring Q2 (i) Iceland lies entirely south of the Arctic Circle. (ii) Iceland lies entirely north of the Arctic Circle. (iii) The Arctic Circle touches the northern coast or offshore islands. (iv) The Arctic Circle touches the southern coast or offshore islands. (v) The Arctic Circle goes through the center of Iceland.
i. ii. iii. iv. v.
1 0 2 1 1
TABLE 4. QUESTION 4.4 AND ITS CODING SCHEME FOR THE ICELAND ACTIVITY 4.4 Visit various parts of Iceland and record your first impressions of the country here: Outiside of Reykjavik, is Iceland heavily populated/developed?
[Yes / No]
Do you see a lot of large-scale agricultural or industrial plants?
[Yes / No]
How would you describe the terrain? undeveloped or under-developed or poor land or barren or isolated or partly farmed or grassland or tundra or equivalent
458
Gobert et al. TABLE 5. AVERAGE SCORES ON PRE-TEST BY TOTAL, GENDER, AND PRIOR COURSEWORK FOR THE ICELAND ACTIVITY Geology and/or No geology or Overall Female Male geography geography Mean pre-test score 6.69 6.32 7.05 7.44 6.57 Standard deviation 2.95 2.52 3.44 3.37 2.75
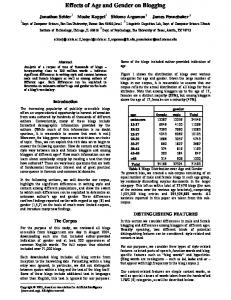
coursework in geology and/or geography. Gender differences were also analyzed, although this was not part of the original design of the study. Lastly, data were analyzed with respect to learning during the lab activity itself. Each analysis is presented and described in turn. The unit of analysis here was data from each individual student. Were there Differences by Prior Coursework or Gender before the Iceland Learning Activity with Google Earth? First, we addressed if there were any differences on the pretest both by prior coursework and by gender. A univariate analysis of variance was computed for each of these analyses. First, the difference between the total scores on the pre-test was not statistically different when comparing those with prior coursework to those with no prior coursework (F = 1.838, p = 0.162). Secondly, the difference on the total pre-test score was not statistically different when comparing males and females (F = 1.890; p = 0.154). See Table 5 for means and standard deviations for each of these analyses.3 Did the Iceland Activity Yield Differences in Overall Pre-Post Comparisons? Next we addressed if there were differences in overall posttest scores compared to pre-test scores collapsing over both prior coursework and gender categories. A paired t-test was computed for this analysis. The difference in overall pre-test score and overall post-test score was statistically significant, [t(224) = 13.33, – – p = 0.000; X pre = 6.69, SD = 2.95; X post = 9.68, SD = 3.58] – (X —mean; SD—standard deviation); this result demonstrates that on average, students had higher scores on the post-test than on the pre-test. See Table 6 and Figure 1.
was used as a covariate. The difference in post-test score by level of prior coursework was not statistically significant (F = 2.107; p = 0.124). Thus, both students with prior geology or geography coursework and those without this prior coursework learned approximately the same amount of content knowledge from the Google Earth Iceland activity, as measured by the post-test gains. The means and standard deviations can be seen in Table 7. Were Post-Test Differences by Gender Yielded for the Iceland Activity? In order to address whether the overall pattern observed was different when comparing males and females, a univariate analysis of variance was conducted with the total post-test as the dependent variable and gender as the independent variable. Pretest was used as a covariate. The difference in post-test minus pre-test scores by gender was not significant (F = 0.436; p = 0.647). Thus, both males and females learned approximately the same amount of content knowledge, as measured by the post-test,
TABLE 6. OVERALL SCORES FOR PRE- AND POST-TEST FOR THE ICELAND ACTIVITY Pre-test Post-test t (df) P Overall score 6.69 9.68 13.329 (224) 0.000 Standard deviation 2.95 3.58
Did Type of Prior Coursework Influence Learning in the Iceland Activity? In order to address whether there were differences between the pre- and post-test scores when comparing those with prior coursework in geology or geography to those with no relevant prior coursework, a univariate analysis of variance was conducted with the total post-test as the dependent variable and type of prior coursework as the independent variable. Pre-test
Although the means appear different when both comparing males and females, and when comparing those with prior relevant coursework to those with no relevant prior coursework, the standard deviations associated with these means indicate that the dispersion of scores was large in both cases, thus no statistically reliable differences were found for either comparison. 3
Figure 1. Overall scores on both pre-test and post-test for the Iceland activity.
Testing the effects of prior coursework and gender on geoscience learning TABLE 7. AVERAGE SCORES ON PRE-TEST AND POST-TEST FOR THE ICELAND ACTIVITY BY TYPE OF PRIOR COURSEWORK Geology and/or No geology or geography geography Mean pre-test score 7.44 6.57 Standard deviation 3.37 2.75 Mean post-test score 10.78 9.57 Standard deviation 3.22 3.58
TABLE 9. AVERAGE SCORES ON THE ICELAND LAB ACTIVITY BY GENDER AND PRIOR COURSEWORK Geology No geology and/or or Female Male geography geography Mean lab score 4.36 4.69 4.51 4.55 Standard deviation 1.62 1.87 1.52 1.77
TABLE 10. PEARSON CORRELATION VALUES BETWEEN PRE-TEST, POST-TEST, AND LAB SCORES FOR THE ICELAND ACTIVITY Pre-test Post-test Lab Pre-test 1 0.483* 0.101 Post-test 0.483* 1 0.291* Lab 0.101 0.291* 1 *Statistically significant at the 0.01 level of alpha.
TABLE 8. AVERAGE SCORES ON PRE-TEST AND POST-TEST FOR THE ICELAND ACTIVITY BY GENDER Female Male Mean pre-test score 6.32 7.05 Standard deviation 2.52 3.44 Mean post-test score 9.37 10.21 Standard deviation 3.30 3.84
holding the effects of the pre-test score constant. The means and standard deviations can be seen in Table 8.
459
STUDY 2 Purpose
Were There Any Differences on the Lab Scores for the Iceland Activity When Comparing by Prior Coursework or by Gender? Next we addressed the differences on the lab activity scores both by prior coursework and by gender; in other words, whether there was a difference on students’ performance in the lab activity by prior coursework in geology and/or geography, or by gender. A univariate analysis of variance was computed for each of these analyses. There was no statistically significant difference found between the total scores on the lab activity when comparing those with prior coursework to those with no prior coursework (F = 0.069, p = 0.934). Additionally, the difference on the total score for the lab activity was not statistically significant when comparing males and females (F = 1.109, p = 0.332). This result demonstrates that on average, males and females scored similarly on the lab activity (see Table 9). Is There a Relationship between the Pre-Test Scores, the Lab Scores, and the Post-Test Scores for the Iceland Activity? In order to establish whether there was a relationship between these learning measures, a Pearson correlation analysis was conducted between all the measures, namely, the pre-test, the lab scores, and the post-test. A statistically significant correlation was found between the pre-test and post-test (r = 0.483, p = 0.000, [two-tailed]), indicating a moderate, positive relationship between the pre-test and the post-test. Another statistically significant correlation was found between the lab scores and the post-test (r = 0.291, p = 0.000, [two-tailed]). The Pearson correlation values can be seen in Table 10. No statistically significant correlation was found between the pre-test score and the lab scores (r = 0.101, p = 0.132, [two-tailed]). The scatterplots for pre-test and post-test, and pre-test and lab scores can be seen in Figures 2 and 3, respectively.
In the second study, we developed a laboratory activity focused on the classic Tonga region of the west Pacific in order to support undergraduate non-geology majors’ understanding of: (1) the geographic layout of the Tonga Subduction System, (2) the dynamic geological processes involved in plate movement, subduction, magmatic arc evolution, and trench rollback, and (3) geological processes related to subduction, including volcanism and earthquake formation. Method Participants A total of 138 undergraduate students from a southeastern university participated in this study4; age data for the participants was not collected. All students were part of the same large lecture; there were nine sections of the lab that corresponded to the lecture, from which our data was drawn. Materials Pre-Test/Post-Test The pre-test and post-test consisted of the same set of 11 questions on basic geological and geographical knowledge of the American-Samoa/Tonga region as well as one question asking about prior experience studying this topic. Of these questions, nine were multiple choice, one asked for the order of four listed events, and one asked participants to locate AmericanSamoa/Tonga on a map that was provided to them. All items were developed by experts in the area of geoscience as part Data were collected, coded, and stored in compliance with the requirements as outlined by Federal Policy for the Protection of Human Subjects. 4
460
Gobert et al.
Figure 2. Scatterplot of correlation between total pre-test scores and total post-test scores for the Iceland activity.
Figure 3. Scatterplot of correlation between total lab scores and total post-test scores for the Iceland activity.
Testing the effects of prior coursework and gender on geoscience learning
461
TABLE 11. A SAMPLE OF A QUESTION FROM THE PRE- AND POST-TEST FOR THE TONGA ACTIVITY
of three ongoing projects (NSF-CLLI #0837040, De Paor and Whitmeyer, 2008; NSF-GEO #1034643, De Paor and Whitmeyer, 2010; NSF-DUE #1022755, De Paor et al., 2010). The pre-test served to determine a baseline of prior knowledge for each participant, while the post-test determined what knowledge gains were made after participating in the lab activity. See Tables 11 and 12 for sample items; all items are shown in Appendix B (see footnote 2). Lab Activities for Tonga The Tonga lab activity consisted of a series of tasks that were designed to develop students’ understanding of the geology of the Tonga region in the western Pacific Ocean. Tasks included: locating the Tonga Region with respect to the Tropic of Capricorn, viewing and manipulating virtual block diagrams to observe animations of subduction, island arc formation, and
trench migration, answering questions about the relative location of volcanoes and earthquakes, and answering questions about plate movement, trench formation, and plate movement and trench rollback. Procedure The process of gathering student performance was done in the following manner. Students initially were given consent forms, with verbal explanation, and a tracking identification number was assigned. Identification numbers were based on the course lab number, the beginning five digits, and then some digits after that given by the lab teaching assistant. Students were informed to not use their university identification numbers. Labs and pre- or post-tests with university identification numbers were not used and were removed from the study. Once the consent
TABLE 12. AN EXAMPLE OF TWO QUESTIONS ASKED IN THE PRE- AND POST-TEST FOR THE TONGA ACTIVITY Q2 Name two features present on the surface during subduction. 1. 2. Q3 When subduction occurs, do the volcanoes form on the down-going plate (on the east side of the trench in this case) or the over-riding plate (on the west side of the trench in this case)? _____________________________________________________________________________
462
Gobert et al. TABLE 13. QUESTION 6 AND ITS CODING SCHEME FOR THE TONGA ACTIVITY Q6 The Tonga Trench’s motion relative to the Pacific Plate is Scoring Q6 (i) Moves forward with the Pacific Plate. (ii) Stationary (trench does not move). (iii) Moves against plate motion. (iv) There is no such thing as the Tonga Trench.
i. ii. iii. iv.
1 1 2 0
TABLE 14. QUESTION 1 AND ITS CODING SCHEME FOR THE TONGA ACTIVITY Q1 What is your previous experience of the geology or geography of American Samoa/Tonga Scoring Q1 (i) I have no significant previous study experience. (ii) I did a class project about the geology or geography of American Samoa/Tonga. (iii) I participated in a real field trip or a holiday visit. (iv) I am native to or lived in the American Samoa/Tonga region for an extended period.
forms were completed and tracking identification numbers administered, each student was given a pre-test. If students finished their pre-test early, they were asked to wait quietly while others finished. The lab only had 10 MacBooks available for use, thus, students worked in groups of two to four depending on the lab section, with all lab sections having different numbers of students. Students were encouraged, sometimes with help from instructors, to take turns working on the computers. Instructors were only allowed to help if students had technical problems but not with lab material itself. The students were informed that the lab itself would not be graded as part of their lab score, which may have had an effect on the way students answered questions or participated during lab. As students completed the labs, they were collected and the students were asked to wait for their fellow classmates to finish. The last part of the lab consisted of the post-test. The post-test is the same as the pre-test. Each student was given a post-test and upon completion was allowed to leave the lab. No collaboration was allowed during the pre- or post-tests. The pre-test, lab activity, and post-test were all completed in one, two-hour lab period. Data Scoring Pre- and Post-Tests The pre- and post-tests consisted mainly of multiple choice questions and were scored on a partial- or full-credit basis. A participant could earn a maximum of two points on each question for choosing the correct answer, one point for choosing a partially correct answer, and zero points for choosing an incorrect answer. Some questions had more than one possible answer worth one point, as shown in Table 13 below. Answer “iii” is worth two points, either answers “i” or “ii” are worth one point, and answer “iv” is worth zero points. The four choices for the question asking about the participant’s prior knowledge on the subject were coded for categorization purposes as zero, one, two, or three. This scheme is illustrated in Table 14.
i. ii. iii. iv.
0 1 2 3
Lab Items Scoring The lab activity consisted of 13 open response or matching questions, which were scored on a partial- or full-credit basis out of a possible one, two, or three, depending on the question. These questions ranged on topics covered in the activity including plate movement, subduction processes, and trench formation (see Tables 15 and 16). Results Data were analyzed to address overall learning gains from the Tonga lab, as measured by pre- and post-tests, as well as to test whether there were any learning gain differences due to prior coursework in geology and/or geography. Gender differences were also analyzed although this was not part of the original design of the study. The unit of analysis here was data from each individual student. Each analysis is presented and described in turn. Were there Differences by Prior Coursework or Gender before the Tonga Learning Activity with Google Earth? We first addressed if there were any differences on the pre-test by prior coursework and by gender; in other words, whether there was a difference on students’ knowledge going into the pre-test either by prior coursework in geology and/or geography, or by gender. A univariate analysis of variance was computed for each of these analyses. The difference between the total scores on the pre-test was not statistically significant when comparing those with prior coursework to those with no prior coursework (F = 3.052, p = 0.051). Secondly, there was no statistically significant difference on the total pre-test score when comparing the males and females (F = 1.831; p = 0.179; see footnote 3). See Table 17 for means and standard deviations for each of these analyses. Were Differences in Overall Pre-Post Comparisons Found for the Tonga Activity? Next we addressed if there were differences in overall posttest scores compared to pre-test scores collapsing over prior
Testing the effects of prior coursework and gender on geoscience learning TABLE 15. QUESTION 4 AND ITS CODING SCHEME FOR THE TONGA ACTIVITY Q4 On which side of the trench do we expect to see earthquakes on, the down-going plate (on the east side of the trench in this case) or the over-riding plate (on the west side of the trench in this case)? over-riding plate or west side (1 pt)
TABLE 16. QUESTION 5 AND ITS CODING SCHEME (1 POINT FOR EACH PROPER MATCH) FOR THE TONGA ACTIVITY Q5 Match the depth of the earthquakes based on their distance from the trench. Put one distance for each depth. Shallow earthquakes
Between close and far from trench
Mid-depth earthquakes
Far from the trench
Deep earthquakes
Close to the trench
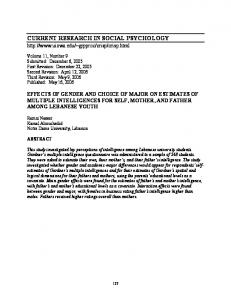
coursework and gender. A paired t-test was computed. The difference in overall pre-test score and overall post-test score was – statistically significant, [t(136) = 6.591, p = 0.000; X pre = 0.82, – SD = 0.35; X post = 1.09, SD = 0.38]; this result demonstrates that on average, students had higher scores on the post-test than on the pre-test (see Table 18 and Figure 4).
463
test was used as a covariate. The difference in post-test score by type of prior coursework was not statistically significant (F = 0.692; p = 0.502). Thus, both students with prior coursework and those without prior coursework learned approximately the same amount of content knowledge from the Tonga lab, as measured by the post-test, when holding the pre-test scores constant. The means and standard deviations can be seen in Table 19. Were Post-Test Differences by Gender Found for the Tonga Activity? In order to address whether there were differences when comparing males and females on their post-test scores for the Tonga activity, a univariate analysis of variance was conducted with the total post-test as the dependent variable and gender as the independent variable. Pre-test was used as a covariate. The difference in post-test score by gender was not significant (F = 0.545; p = 0.462). Thus, both males and females learned approximately the same amount of content knowledge, as measured by the post-test. The means and standard deviations can be seen in Table 20. WereThere any Differences on the Lab Scores for the Tonga Activity When Comparing Groups by Prior Coursework or by Gender? Next, we addressed the differences on the lab activity scores both by prior coursework and by gender; in other words, whether
Were Post-Test Differences by Type of Prior Coursework Found for the Tonga Activity? We addressed whether there were differences between the pre- and post-test scores when comparing those with prior coursework in geology or geography to those with no relevant prior coursework. To do this, we conducted a univariate analysis of variance with the total post-test as the dependent variable and type of prior coursework as the independent variable. Pre-
TABLE 17. AVERAGE SCORES ON PRE-TEST BY TOTAL, GENDER, AND PRIOR COURSEWORK FOR THE TONGA ACTIVITY Geology No geology and/or or Female Male geography geography Mean pre-test score 0.88 0.80 0.86 0.85 Standard deviation 0.36 0.31 0.25 0.36 Mean post-test score 1.13 1.07 1.03 1.12 Standard deviation 0.37 0.39 0.39 0.35
TABLE 18. OVERALL SCORES FOR PRE- AND POST-TEST FOR THE TONGA ACTIVITY Pre-test Post-test t (df) p Overall score 0.82 1.09 6.591 0.000* (136) Standard deviation 0.35 0.38 *Significant at the p < 0.001 level.
Figure 4. Overall scores on both pre-test and post-test for the Tonga activity.
TABLE 19. AVERAGE SCORES ON PRE-TEST AND POST-TEST FOR THE TONGA ACTIVITY BY TYPE OF PRIOR COURSEWORK Geology Non-geology and/or and/or geography geography Mean pre-test score 0.86 0.85 Standard deviation 0.25 0.36 Mean post-test score 1.03 1.12 Standard deviation 0.39 0.35
464
Gobert et al.
there was a difference on students’ performance in the lab activity by prior coursework in geology and/or geography, or by gender. A univariate analysis of variance was computed for each of these analyses. The difference between the total scores on the lab activity was not statistically significant when comparing those with prior coursework to those with no prior coursework (F = 0.738, p = 0.480); however, the difference on the total scores on the lab activity was statistically significant when comparing males and females (F = 8.463, p = 0.004). This result demonstrates that on average, males outperformed females on the lab activity (see Table 21 and Fig. 5). Correlations between Pre-Test, Lab, and Post-Test Scores In order to establish whether there was a relationship between each of the three scores, a Pearson correlation analysis was conducted using the pre-test, post-test, and lab scores. A statistically significant correlation was found between the pre-test and lab scores (r = 0.384, p = 0.000, [two-tailed]), indicating a moderate, positive relationship between pre-test and lab scores. Pearson correlation values can be seen in Table 22. These results are depicted in Figure 6. DISCUSSION Summary of Goals and Approach In this research and development effort, we report on two studies that examined the efficacy for learning with Google Earth lab activities. This involved examining students’ prior knowledge, their knowledge acquired during the lab activity, and their post-test learning gains, thereby examining both the processes (answers to the lab exercises) and products of learning (post-test compared to pre-test); an approach that is important since it has the potential to inform instruction in the geosciences (Libarkin and Anderson, 2005). Our goal in these studies was to compare learning during the lab activity, as well as the resulting learning gains by comparing pre- and post-test scores for those with prior geology and/or
TABLE 20. TONGA ACTIVITY RESULTS OF AVERAGE SCORES ON PRE-TEST AND POST-TEST BY GENDER Female Male Mean pre-test score 0.88 0.80 Standard deviation 0.36 0.31 Mean post-test score 1.13 1.07 Standard deviation 0.37 0.39
TABLE 21. AVERAGE SCORES ON THE TONGA LAB ACTIVITY BY GENDER Female Male p Lab score 9.85 11.07 0.004* Standard deviation 3.40 2.20 *Significant at the p