Original Article
Testing the Incremental Value of a Separate Measure for Secure Attachment Relative to a Measure for Attachment Anxiety and Avoidance A Study in Middle Childhood and Early Adolescence Katrijn Brenning, Bart Soenens, and Caroline Braet Ghent University, Belgium Abstract. Research on attachment in middle childhood and early adolescence has typically relied on either unidimensional measures of attachment security (vs. insecurity) or on differentiated measures of attachment anxiety and avoidance. This study addressed the question whether there is a need to add an explicit measure of security when operationalizing parent-child attachment in terms of anxiety and avoidance. Both dimensional (i.e., regression analyses) and person-centered analyses (i.e., cluster analysis) are used in this study (N = 276, 53% boys, mean age = 10.66) to examine the incremental value of a scale for attachment security (in this study, the Security Scale) in addition to a scale for attachment anxiety and avoidance (in this study, the Experiences in Close Relationships Scale-Revised – Child version; ECR-RC). The present results suggest that an assessment of anxious and avoidant attachment (using the ECR-RC) may suffice to capture the quality of parent-child attachment in middle childhood and early adolescence. Keywords: ECR-RC, attachment security, cluster analysis
For quite a long time, middle childhood and early adolescence have been relatively neglected developmental periods in attachment research (Dwyer, 2005; Kerns, Tomich, Aspelmeier, & Contreras, 2000). Moreover, attachment research in this age period typically relied on broad assessments of attachment security versus insecurity using instruments such as the Security Scale (SS; Kerns, Klepac, & Cole, 1996) and the Inventory of Parent and Peer Attachment (IPPA; Armsden & Greenberg, 1987). This reliance on unidimensional measures of attachment security is in contrast with research on attachment in early childhood and adulthood, two life periods in which it is more common to distinguish between two fundamental and qualitatively different dimensions of attachment, that is, attachment anxiety and avoidance. A number of efforts have been made to introduce the distinction between attachment anxiety and avoidance into research on middle childhood and early adolescence (Dwyer, 2005; Yunger, Corby, & Perry, 2005), thereby using for instance the Experiences in Close Relationships Scale-Revised Child version (ECR-RC; Brenning, Soenens, Braet, & Bosmans, 2011a). The present research Ó 2015 Hogrefe Publishing
aimed to investigate whether this two-dimensional approach can largely replace the unidimensional secure-insecure approach to the assessment of attachment, or whether we need to combine both approaches. More specifically, the present research aimed to investigate whether the dimensions of anxious and avoidant attachment, as assessed with the ECR-RC, suffice to capture the quality of parent-child attachment in middle childhood and early adolescence or whether an explicit measure of secure attachment needs to be added for the purpose of incremental validity.
The Anxiety-Avoidance Model of Attachment Particularly in research on adult attachment, there is increasing consensus that, in order to model quality of attachment, it is necessary to assess both anxiety and avoidance (see Mikulincer & Shaver, 2007; Mikulincer & Shaver, 2012). Attachment anxiety involves European Journal of Psychological Assessment 2015 DOI: 10.1027/1015-5759/a000264
2
K. Brenning et al.: Measuring Attachment Anxiety and Avoidance
a preoccupation with social support, jealousy, fear, and vigilance concerning abandonment and rejection. Attachment avoidance involves avoidance of intimacy, discomfort with closeness, and self-reliance. Attachment anxiety and attachment avoidance are considered the underlying dimensions of earlier categorical approaches to adult attachment (Bartholomew & Horowitz, 1991; Hazan & Shaver, 1987). Specifically, by crossing these two dimensions, four categorical attachment orientations can be distinguished: secure attachment (low on both dimensions), anxious or preoccupied attachment (high on anxiety and low on avoidance), dismissive-avoidant attachment (low on anxiety and high on avoidance), and fearful-avoidant attachment (high on both dimensions). The usefulness of the anxiety-avoidance distinction has received abundant support in research on adult attachment (for a review, see Mikulincer & Shaver, 2012). Much of this research has relied on the ECR-R (Fraley, Waller, & Brennan, 2000), which is one of the best validated self-report measures for attachment anxiety and avoidance (Sibley, Fischer, & Liu, 2005; Tsagarakis, Kafetsios, & Stalikas, 2007). Both anxious and avoidant attachment were found to predict unique variance in well-being and psychopathology and were found to be associated with these outcomes via different mechanisms of emotion regulation (Shaver & Mikulincer, 2002). In particular, anxious attachment has been found to be primarily linked to hyperactivation of emotions, whereas avoidant attachment has been found to be primarily linked to emotional deactivation (Mikulincer & Shaver, 2012).
Applying the Anxiety-Avoidance Model to Attachment in Middle Childhood and Early Adolescence In line with research on adults, the distinction between anxious and avoidant attachment has also been introduced in middle childhood and early adolescence (e.g., Brenning et al., 2011a; Finnegan, Hodges, & Perry, 1996). Although relatively less common than in research with adults, recent research with middle childhood children and early adolescents showed that both attachment anxiety and avoidance are uniquely related to well-being and psychopathology (e.g., Brenning, Soenens, Braet, & Bal, 2012). Further, in line with the model by Shaver and Mikulincer (2002), findings showed that children and adolescents scoring higher on attachment anxiety showed more dysregulation of negative emotions (i.e., an emotion regulation strategy conceptually similar to hyperactivation), whereas youngsters scoring higher on attachment avoidance used relatively more suppressive strategies to deal with their emotions (i.e., an emotion regulation strategy conceptually similar to deactivation) (Brenning, Soenens, Braet, & Bosmans, 2012). To tap into children’s and adolescents’ anxious and avoidant attachment representations a number of attachment instruments were developed (for an overview, see Dwyer, 2005), including the Preoccupied and Avoidant Coping Questionnaire (PACQ; Finnegan et al., 1996), and European Journal of Psychological Assessment 2015
more recently the ECR-RC (Brenning et al., 2011a). The PACQ has continuous scales for children’s preoccupied attachment (which is similar to anxious attachment) and for avoidant attachment. Interestingly, the PACQ also contains a third, separate, and explicit measure of secure attachment. The ECR-RC is a child version of the ECR-R that consists of two continuous scales to measure children’s and adolescents’ anxious and avoidant attachment. Remarkably, in contrast to the PACQ, the ECR-RC contains no separate scale to measure secure attachment. It is assumed that secure attachment is represented by low scores on both attachment anxiety and avoidance. An important question, which will be addressed in the current study, is whether this assumption is valid or whether, in contrast, an explicit measure of secure attachment needs to be added for a complete assessment of the quality of attachment in this age period. Notably, the question whether the distinction between anxiety and avoidance sufficiently captures the domain of attachment is not unique for middle childhood and early adolescence. For instance, in discussing limitations of the ECR-R for adults, Fraley et al. (2000) raised concerns that the ECR-R may not sufficiently capture the secure region of the two-dimensional space (Fraley et al., 2000, p. 364). The question whether a separate measure of secure attachment is needed is all the more important in middle childhood and early adolescence because, as discussed before, research on the differentiation between attachment anxiety and avoidance is less well established in this developmental period.
The Present Study The current study aimed to investigate whether the addition of a scale for secure attachment (i.e., the SS) would have added value when measuring attachment anxiety and avoidance (as assessed with the ECR-RC). We chose the ECR-RC as this is a recently developed but very promising self-report questionnaire, analogous to the ‘‘golden standard’’ that taps into anxious and avoidant attachment representations in adulthood. Both ECR-RC attachment scales were administered with regard to the mother-child relationship because this relationship still represents a key resource for psychosocial adjustment during the life period of middle childhood and early adolescence (Allen, 2008). First, using regression analyses we aimed to investigate whether attachment security would explain additional variance in conceptually important and frequently studied outcomes of attachment. In examining this question we focused not only on maladaptive outcomes (i.e., depressive symptoms, emotional dysregulation, and inhibition). It was deemed important to also include more adaptive outcomes because one might argue that measures of anxiety and avoidance merely capture the dark side of human functioning and fail to capture the bright side. On the basis of this argument one might predict that a measure of attachment security might be of particular added value when studying adaptive developmental outcomes. Based on previous research (e.g., Mikulincer & Shaver, 2012; Sroufe, Egeland, Carlson, & Collins, Ó 2015 Hogrefe Publishing
K. Brenning et al.: Measuring Attachment Anxiety and Avoidance
2005), we included self-esteem and adaptive emotion regulation as two additional outcomes in this study. In a second step, cluster analysis was used to identify attachment profiles on the basis of the ECR-RC. We expected that this cluster analysis would yield each of the four attachment types proposed by Bartholomew and Horowitz (1991). Next, we examined whether the addition of a measure of attachment security to the cluster analysis would result in a different cluster solution or even in an extended cluster solution (e.g., one in which an additional profile of attachment emerged). If the ECR-RC sufficiently captures the quality of parent-child attachment in middle childhood and early adolescence, the addition of a measure of secure attachment should not give rise to additional clusters. Also, between-cluster differences in psychosocial outcomes (i.e., depressive symptoms, self-esteem, and emotion regulation strategies) should be virtually identical irrespective of whether security of attachment is added as a clustering variable.
Materials and Method Participants and Procedure The data for this study were used and reported in Brenning et al. (2011a). As such, the present research involves a reanalysis of existing data. The sample consisted of 276 participants (52.9% boys) with a mean age of 10.65 years (SD = 0.92; range = 8–13 years) from nine elementary schools. All participants voluntarily and anonymously completed a battery of questionnaires during class periods and in the presence of a research assistant. All families had a middle-class background. In terms of family structure, 80.3% of the participants came from intact families whereas the remaining participants were from divorced families (19.3%) or families where the father was deceased (0.4%).
Statistical Analyses Our main goal was to examine the incremental value of the SS in addition to the ECR-RC using both dimensional (i.e., regression analysis) and person-centered analyses (i.e., cluster analysis). With regard to the dimensional analysis, two separate series of hierarchical linear regression analyses (using enter method) were used. Specifically, we examined whether the attachment security score (block 2) would contribute to the prediction of several outcome variables beyond the variance explained by the scores for attachment anxiety and avoidance (block 1). Vice versa, we also examined whether the scores for attachment anxiety and avoidance (block 2) would contribute to the variance explained in several outcome variables beyond the attachment security score (block 1). When interpreting the results of these regression analyses, statistical significance of the standardized regression coefficients and effect sizes was inspected. According to Cohen (1988), 0.2 is a small effect size, 0.5 is a medium or moderate effect, and 0.8 is a large effect. Ó 2015 Hogrefe Publishing
3
In a next step, cluster analysis was used to identify attachment profiles on the basis of the dimensions of anxious and avoidant attachment (as assessed with the ECRRC), and in combination with an explicit measure of secure attachment (as assessed with the SS). Based on the recommendations by Gore (2000), cluster analysis was performed in two steps. In a first step, the standardized scale scores for attachment were entered in a hierarchical cluster analysis. Second, nonhierarchical k-means cluster analysis was performed to optimize the hierarchical solution, using the initial seed points of the best cluster solution as derived from the hierarchical cluster solution in Step 1. Two separate cluster analyses were conducted, that is, (a) one where only the ECR-RC scores for anxiety and avoidance were used as clustering variables and (b) one in which the SS-security score was added as a clustering variable. In a final analysis, we examined between-cluster differences in the outcome variables using both solutions. A series of ANOVAs were conducted with cluster membership as the independent variable and the outcomes (i.e., self-esteem, depressive symptoms, and emotion regulation strategies) as dependent variables. For all analyses in this study, SPSS 22 was used.
Measures Experiences in Close Relationships Scale-Revised Child Version The ECR-RC (Brenning et al., 2011a) was used to assess attachment anxiety (e.g., ‘‘I worry about being abandoned’’) and attachment avoidance (e.g., ‘‘I prefer not to show how I feel deep down’’). Items are rated on a 7-point scale ranging from ‘‘not at all’’ to ‘‘very much.’’ The reliability and validity of the ECR-RC has been evidenced in several studies. In terms of reliability, the ECR-RC showed high levels of internal consistency (e.g., Brenning & Braet, 2013; Brenning, Soenens, Braet, & Bosmans, 2011b). In terms of construct validity, research by Brenning et al. (2011a) showed expected associations between the ECR-RC and other attachment measures (e.g., the Relationship Questionnaire). Further, the predictive validity of the ECR-RC was supported by theoretically plausible associations with assessments of both depressive symptoms (Brenning, Soenens, Braet, & Bal, 2012) and strategies of emotion regulation (Brenning, Soenens, Braet, & Bosmans, 2012). In the present study, Cronbach’s alphas of the ECR-RC were .83 and .85 for anxious and avoidant attachment, respectively. Security Scale The SS (Kerns et al., 1996) is a 15-item measure that taps into children’s felt security. More specifically, items assess the degree to which children believe an attachment figure is available and responsive, the child’s use of the attachment figure as a safe haven, and the child’s report of open communication with the attachment figure (Dwyer, 2005). For each item, participants are asked to choose between European Journal of Psychological Assessment 2015
4
K. Brenning et al.: Measuring Attachment Anxiety and Avoidance
one of two response options (e.g., ‘‘Some kids are not sure if they can trust their mom BUT other kids find it easy to trust their mom’’) and, next, to indicate their level of agreement with that option (i.e., ‘‘sort of true for me’’ or ‘‘really true for me’’). As such, each item can be scored from 1 to 4, with a higher score indicating greater perceptions of security. The SS has good psychometric properties, including high internal consistency, test-retest reliability, and good construct validity (Kerns et al., 1996; Van Ryzin & Leve, 2012). In this study, Cronbach’s alpha for the SS was .76. Child Depression Inventory The CDI (Kovacs, 1985) is an adaptation of the Beck Depression Inventory for use with children 7–17 years of age. The scale has 27 items dealing with sadness, selfblame, loss of appetite, insomnia, interpersonal relationships, and school adjustment. For each item, respondents choose one of three responses that best describes them (e.g., ‘‘I am sad sometimes’’; ‘‘I am often sad’’ or ‘‘I am always sad’’). Acceptable levels of internal consistency, test-retest reliability, and validity have been established (e.g., Saylor, Finch, Spirito, & Bennett, 1984). Cronbach’s alpha in the current study was .88. Self-Perception Profile for Children Participants completed the Global Self-Worth subscale of the Self-Perception Profile for Children (Harter, 1985). This subscale consists of five items (e.g., ‘‘I am pretty happy with myself’’), which can be scored on a scale ranging from 1 (= not at all) to 5 (= very much). The questionnaire has good internal consistency, convergent validity, and factorial validity (see Van den Bergh & Marcoen, 1999). In the current sample, Cronbach’s alpha was .81.
Children’s Sadness Management Scale
of sadness expression (e.g., ‘‘I get sad inside but don’t show it’’), (b) dysregulated expression (4 items), defined as expressing sadness in nonconstructive, hyperactivating ways (e.g., ‘‘I whine/fuss about what’s making me sad’’), and (c) adaptive emotion regulation coping (5 items), which refers to intentional, proactive, and targeted strategies for coping with sadness (e.g., ‘‘I try to calmly deal with what is making me feel sad’’). Children responded to the items on a 3-point scale (1 = hardly ever, 2 = sometimes, 3 = often). Research has shown moderate internal consistency for the three subscales and construct validity has been established in relation to self- and other-report measures of sadness regulation and children’s psychological and social functioning (Zeman et al., 2001). Cronbach’s alphas in the present study were as follows: .72 for inhibition, .58 for dysregulation, and .61 for adaptive emotion regulation. These Cronbach’s alpha values are similar to the values obtained in previous research (Zeman et al., 2001).
Results Preliminary Analyses Preliminary analyses were conducted to examine differences in the study variables in terms of children’s age, gender, and family structure. A multivariate analysis of variance (MANOVA) was conducted with gender and family structure as fixed factors and age as a covariate for each of the study variables. No significant multivariate effects were obtained for gender, Wilk’s Lambda = .95; F(8, 205) = 1.32, p > .05, g2 = .05, family structure, Wilk’s Lambda = .94; F(16, 410) = 0.85, p > .05, g2 = .03, or age, Wilk’s Lambda = .96; F(8, 205) = 1.19, p > .05, g2 = .05. Accordingly, these variables were not considered further in the main analyses. Correlations between the study variables are shown in Table 1.
Regression Analyses
Based on the CSMS (Zeman, Shipman, & Penza-Clyve, 2001), 14 items were administered that tap into three dimensions of sadness management: (a) inhibition (5 items), which refers to the deactivation or suppression
A first set of regression analyses included the ECR-RC attachment dimensions in Block 1 and self-esteem, depressive symptoms, and strategies of emotion regulation as
Table 1. Means, standard deviations, and correlations among all study variables Variable 1. ECR-RC anx 2. ECR-RC avoid 3. SS-security 4. Self esteem 5. Depression 6. Dysregulation 7. Inhibition 8. Adaptive ER M SD
1
2
3
4
5
6
7
8
_ .53*** .65*** .37*** .49*** .24*** .21** .11 2.26 0.78
– .68*** .40*** .36*** .12 .34*** .22*** 2.59 0.89
– .37*** .44*** .12 .26*** .14* 26.35 6.29
– .57*** .32*** .23*** .11 3.90 0.80
– .47*** .30*** .15* 36.74 6.52
– .04 .10 1.80 0.47
– .03 2.04 0.50
– 2.22 0.44
Notes. *p < .05. **p < .01. ***p < .001. European Journal of Psychological Assessment 2015
Ó 2015 Hogrefe Publishing
K. Brenning et al.: Measuring Attachment Anxiety and Avoidance
dependent variables (see Table 2). The two attachment dimensions explained a significant portion of variance in the prediction of each of the outcomes (R2 ranges from .04 to .25). Specifically, the results showed that both anxious and avoidant attachment had independent negative associations with self-esteem and positive associations with depressive symptoms. As for the emotion regulation strategies, attachment anxiety was related uniquely to dysregulation, whereas attachment avoidance was related uniquely to inhibition. Note that attachment anxiety was significantly related to inhibition when using a correlational analysis (r = .21, p < .01), while this association was not significant when using a regression analysis with both attachment anxiety and attachment avoidance as independent variables. This result is in line with theory (Shaver & Mikulincer, 2002) and previous research findings (see e.g., Brenning & Braet, 2013; Brenning, Soenens, Braet, & Bosmans, 2012) suggesting that attachment anxiety does not have a unique association with emotional inhibition. With regard to the link with adaptive emotion regulation strategies, attachment avoidance showed a unique and negative association whereas the association with attachment anxiety was nonsignificant. When added in a second step, the score for secure attachment did not account for significant incremental variability in self-esteem or any of the emotion regulation variables (R2change = .00). Secure attachment did explain a statistically significant but small (R2change = .02) amount of variance in depression scores above and beyond the variability explained by ECR-RC anxiety and avoidance. To further examine the relative contribution of scores for attachment anxiety/avoidance and security, we also performed a series of regression analyses in which the order of entry into the equations was reversed. As can be seen in Table 2, SS attachment security (block 1) was associated with each of the outcome variables (R2 ranges from .02 to .20), except for dysregulation (R2 = .01). When entered in a second block, the scores for anxious and avoidant attachment did account for significant incremental variability in the outcome variables (R2 ranges from .02 to .07). More specifically, attachment anxiety and avoidance both contributed independently to the prediction of self-esteem. For each of the other outcome variables it was either anxiety (for depression and dysregulation) or avoidance (for inhibition and adaptive emotion regulation) that contributed. As such, ECR-RC anxiety and avoidance account for additional variance once the ASS security scale has been allowed to account for as much variance as possible. Further (not shown in Table 2), the initially significant
1
5
associations between secure attachment and all of the outcome variables were turned to nonsignificance (except for the negative association with depressive symptoms, which remained significant). Overall, these results suggest that attachment anxiety and avoidance have the most robust and unique associations with the developmental outcomes.1
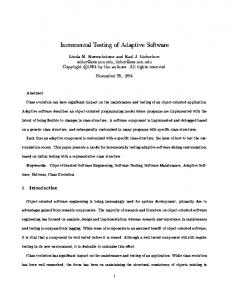
Cluster Analyses Cluster Analysis on the ECR-RC Scores Alone To determine the number of clusters that will be retained for the cluster analysis, we inspected the scree plot of cluster properties (Mooi & Sarstedt, 2011). In the current study, the scree plot showed a clear elbow after the first five factors. Based on this scree plot, we estimated a cluster solution with five clusters and inspected the percentage of variance explained. One commonly used criterion is that the cluster solution should explain at least 50% of the variance in each of the defining variables (Milligan & Cooper, 1985). This was indeed the case for our five-factor cluster solution (R2 = .85 for attachment anxiety and .67 for attachment avoidance). To optimize the five-factor cluster solution and to address its interpretability, in a second step, the five-cluster centers derived from Ward’s method were used as the initial cluster centers for a nonhierarchical k-means clustering procedure. We examined the interpretability of the cluster solution by inspecting the z-scores of the clustering variables within each of the clusters. These z-scores, which represent the distances between the cluster means and the total sample standardized mean, in standard deviation units, can be interpreted as effect sizes (0.2 is a small effect, 0.5 is a moderate effect, 0.8 is a large effect). As presented in Figure 1, the results show a distinction between profiles of attachment that could largely be understood using the model by Bartholomew and Horowitz (1991). Participants in a first ‘‘secure attachment’’ cluster scored low on both anxiety and avoidance (z = 0.77 and z = 1.14, respectively). Participants in a second ‘‘preoccupied attachment’’ cluster scored high on anxiety and average on avoidance (z = 1.25 and z = 0.02, respectively). Participants in a third ‘‘dismissive-avoidant attachment’’ cluster scored average on anxiety and high on avoidance (z = 0.03 and z = 0.98, respectively). Participants in a fourth ‘‘fearful-avoidant attachment’’ cluster scored high on both attachment anxiety and avoidance (z = 1.38 and z = 1.56, respectively).
As recommended by a reviewer, all abovementioned analyses were also performed using latent variables. The results of these analyses provided further evidence that secure attachment adds little to the measure of attachment anxiety and avoidance, as none of the effects of secure attachment to the outcome variables were significant after taking into account the effects of attachment anxiety and avoidance. However, the effects of attachment anxiety and avoidance to the outcome variables also became nonsignificant when using latent variables rather than manifest variables. Further inspection revealed that this was due to the very high correlations between the latent scores for attachment anxiety and avoidance on the one hand and the latent score for secure attachment on the other hand. These very high correlations caused problems of multicollinearity, resulting in unstable parameter estimates in the structural models. In our view, the very high correlations between secure attachment and the two attachment scores derived from the ECR-RC (anxiety and avoidance) further underscore the conclusion of this paper. That is, low scores on anxiety and avoidance are largely redundant with high scores on secure attachment. As such, a separate score for secure attachment does not add much to the scores for anxiety and avoidance.
Ó 2015 Hogrefe Publishing
European Journal of Psychological Assessment 2015
Y axis: Z-scores
.14* (g2 = .02) .04 (g2 = .00) .21* (g2 = .03) .02* .02* 4.88* 3.44* 2.69
2
.03 (g2 = .00) .22** (g2 = .04) .02 (g2 = .00) .04** .00 5.16** 3.44* 0.05
Adaptive emotion regulation
K. Brenning et al.: Measuring Attachment Anxiety and Avoidance
1.5 1 0.5
Anx Av
0 Preocc.
Dismiss.
Fearful
-0.5 Undiff.
European Journal of Psychological Assessment 2015
-1.5
Sec.
X axis: Clusters
Figure 1. z-scores for Anxious (Anx) and Avoidant attachment (Av). Five-cluster solution: Secure attachment cluster (Sec.); Preoccupied attachment cluster (Preocc.); Dismissive-avoidant attachment cluster (Dismiss.); Fearful-avoidant attachment cluster (Fearful); Undifferentiated attachment cluster (Undiff.). Note. Coefficients shown are standardized regression coefficients (effect sizes), *p < .05. **p < .01. ***p < .001.
.27*** (g2 = .07) .05 (g2 = .00) .23** (g2 = .04) .08*** .03* 18.96*** .. 9.21*** 4.12* .10 (g2 = .01) .28** (g2 = .04) .02 (g2 = .00) .01 .04** 2.37 4.28** 5.20** Block 1: SS-security Block 2: ECR-RC anxiety ECR-RC avoidance Block 1: R2 SS scale Block 2: R2change ECR-RC scales Block 1: F(1, 235) SS scale Block 2: F(3, 232) ECR-RC scales Fchange (2, 232)
.37*** (g2 = .14) .19* (g2 = .02) .21* (g2 = .04) .14*** .05** 36.95*** 18.00*** 7.40**
.44*** (g2 = .19) .34*** (g2 = .08) .04 (g2 = .00) .20*** .07*** 57.67*** 28.00*** 10.86***
Inhibition
.08 (g2 = .00) .27*** (g2 = .08) .08 (g2 = .00) .10*** .00 13.46*** ´9.21*** 0.72
Dysregulation Depression Self-esteem
.23** (g2 = .04) .25*** (g2 = .07) .10 (g2 = .01) .19*** .00 26.37*** 18.00*** 1.21
.42*** (g2 = .14) .13* (g2 = .02) .19* (g2 = .02) .25*** .02* 39.02*** 28.00*** 4.71*
.25** (g2 = .04) .05 (g2 = .00) .07 (g2 = .00) .05** .00 6.19** 4.28** 0.48
-1
Block 1: ECR-RC anxiety ECR-RC avoidance Block 2: SS-security Block 1: R2 ECR-RC scales Block 2: R2change SS scale Block 1: F(2, 233) ECR-RC scales Block 2: F(3, 232) SS scale Fchange (1, 232)
Table 2. Results of regression analyses: The contribution of attachment security beyond attachment anxiety and avoidance to the prediction of the outcomes
6
Y axis: Z-scores 2 1.5 1 0.5
Anx Av Sec
0 Dismiss.
-0.5
Undiff.
-1 -1.5 -2
Sec.
Preocc. Fearful
X axis: Clusters
Figure 2. z-scores for Anxious (Anx), Avoidant attachment (Av), and Secure attachment. Five-cluster solution: Secure attachment cluster (Sec.); Preoccupied attachment cluster (Preocc.); Dismissive-avoidant attachment cluster (Dismiss.); Fearful avoidant attachment cluster (Fearful); Undifferentiated attachment cluster (Undiff.). Finally, an undifferentiated cluster emerged with scores that were average on both dimensions (z = 0.42 and z = 0.16, respectively). Cluster Analysis on the ECR-RC and SS Analogous to the ECR-RC cluster analyses, five clusters could be retained after inspecting the scree plot of cluster properties. Again, this five-cluster solution explained at least 50% of the variance in each of the defining variables (R2 = .73 for attachment anxiety, .58 for attachment avoidance, and .78 for attachment security). Ó 2015 Hogrefe Publishing
Ó 2015 Hogrefe Publishing
Inhibition
Dysregulation
Adaptive emotion regulation
Depression
Notes. 1 = ECR-RC Clusters; 2 = ECR-RC/SS clusters. Means not sharing subscripts differ significantly, as indicated by post hoc contrasts (Tukey, p < .05). ***p < .001.
.15 .15 .21 .20 .07 .07 .07 .07 .07 .07 (4, 254) 11.16*** (4, 252) 10.66*** (4, 253) 17.19*** (4, 250) 15.59*** (12, 649) 4.69*** (12, 619) 4.13*** (12, 649) 4.69*** (12, 619) 4.13*** (12, 649) 4.69*** (12, 619) 4.13*** (0.75)bc (0.69)bc (5.04)ab (5.84)ab (0.44)b (0.46)b (0.45)a (0.46)ab (0.52)ab (0.48)ab 4.05 4.04 35.27 35.96 2.29 2.30 1.71 1.76 2.07 2.07 (0.72)a (0.76)a (8.89)c (8.17)c (0.49)a (0.47)a (0.53)ab (0.54)a (0.37)b (0.40)b 3.43 3.30 41.27 40.76 2.00 2.01 1.84 1.73 2.28 2.30 (0.89)a (0.86)ab (5.94)bc (6.11)bc (0.41)ab (0.41)ab (0.50)ab (0.48)ab (0.50)b (0.51)ab 3.56 3.60 38.41 38.44 2.07 2.05 1.93 1.97 2.17 2.17 (0.64)ab (0.66)a (6.95)c (6.13)c (0.35)ab (0.42)ab (0.37)b (0.41)b (0.45)b (0.43)ab 3.63 3.54 41.49 42.15 2.20 2.15 2.00 2.04 2.13 2.15 (0.65)c (0.74)c (4.84)a (5.21)a (0.44)b (0.41)ab (0.48)ab (0.46)a (0.47)a (0.50)a 4.28 4.16 33.43 34.02 2.28 2.27 1.73 1.73 1.79 1.89 1 2 1 2 1 2 1 2 1 2 Self-esteem
Preoccupied Secure Measure Variables
Clusters
Table 3. Univariate ANOVAs and Post hoc cluster comparison
Dismissive-avoidant
Fearful-avoidant
Undifferentiated
F-value
R2
K. Brenning et al.: Measuring Attachment Anxiety and Avoidance
7
In a second step, this five-cluster solution was subjected to the k-means clustering procedure. This procedure (see Figure 2) resulted in a very similar pattern of results as cluster analysis relying only on the ECR-RC scores (see Figure 1). Participants in a first ‘‘secure attachment’’ cluster scored low on both attachment anxiety and avoidance and high on security (z = 0.71, z = 0.83, and z = 0.83, respectively). Participants in a second ‘‘preoccupied attachment’’ cluster scored high on anxiety but average on avoidance and low on security (z = 1.29, z = 0.39, and z = 1.13, respectively). Participants in a third ‘‘dismissive-avoidant attachment’’ cluster scored high on avoidance but average on anxiety and security (z = 0.97, z = 0.04, and z = 0.06, respectively). Participants in a fourth ‘‘fearfulavoidant attachment’’ cluster scored high on both attachment anxiety and avoidance but low on security (z = 1.06, z = 1.68, and z = 1.69, respectively). Finally, an undifferentiated cluster again emerged with scores that were average on all dimensions (z = 0.04, z = 0.15, and z = 0.06, for anxiety, avoidance, and security, respectively). Between-Cluster Differences in Outcome Variables When examining between-cluster differences in the outcome variables using the ECR-RC solution (see Table 3), the secure attachment cluster showed a more adaptive psychological profile for self-esteem, depression, and inhibition than the insecure clusters. For dysregulation and adaptive emotion regulation, secure did not consistently do better than insecure. Importantly, these results of between-cluster differences were practically identical when cluster analysis on the ECR-RC and SS was used. Moreover, the percentages of explained variance were essentially identical (see Table 3).
Discussion The results of this study suggest that the addition of a separate score for secure attachment (i.e., SS) contributes little to the assessment of mother-child attachment in addition to scores for attachment anxiety and avoidance obtained using the ECR-RC. In terms of assessment, the present results provide support that the ECR-RC contains enough items that tap into the secure region of the anxiety/avoidance spectra. Three different results support this conclusion: (a) secure attachment generally did not add to the prediction of relevant outcomes beyond the variance explained by anxiety and avoidance, (b) the same attachment profiles were identified using cluster analysis on the ECR-RC scores alone or cluster analysis on both the ECR-RC and SS scores, and (c) similar between-cluster differences were found in the outcome variables when relying on both cluster solutions. In spite of the clear-cut results obtained in the present study, we want to highlight a number of important cautionary notes. First, it is important to bear in mind that the European Journal of Psychological Assessment 2015
8
K. Brenning et al.: Measuring Attachment Anxiety and Avoidance
present results were obtained with the specific self-report measures used in this study. As such, until other studies using a wider variety of measures (e.g., IPPA) replicate the current findings, the conclusions drawn from this study apply only to the measures used in this study. Second, as the internal consistency of the CSMS Dysregulation scale was only borderline acceptable, the possibility exists that the relationships obtained with this scale were less reliable. This may explain why the Tukey contrasts for dysregulation did not indicate significant differences between the ECRRC based secure cluster and any of the three insecure clusters. Third, in order to make more general conclusions, future research including a larger number of participants and using more sophisticated latent statistical methods (e.g., Factor Mixture Modeling) should try to replicate the findings. Future research may also extend our findings to other developmental periods (e.g., early childhood and adulthood), to other attachment figures (e.g., fathers, peers, and teachers), and studying a broader range of adjustment measures (e.g., children’s social adjustment).
References Allen, J. P. (2008). The attachment system in adolescence. In J. Cassidy & P. R. Shaver (Eds.), Handbook of attachment: Theory, research, and clinical applications (pp. 419–435). New York, NY: The Guilford Press. Armsden, G. C., & Greenberg, M. T. (1987). The inventory of parent and peer attachment: Individual differences and their relationship to psychological well-being in adolescence. Journal of Youth and Adolescence, 16, 427–454. doi: 10.1007/bf02202939 Bartholomew, K., & Horowitz, L. M. (1991). Attachment styles among young-adults: A test of a 4-category model. Journal of Personality and Social Psychology, 61, 226–244. doi: 10.1037/0022-3514.61.2.226 Brenning, K., & Braet, C. (2013). The emotion regulation model of attachment: An emotion-specific approach. Personal Relationships, 20, 107–123. doi: 10.1111/j.1475-6811. 2012.01399.x Brenning, K., Soenens, B., Braet, C., & Bal, S. (2012). The role of parenting and mother-adolescent attachment in the intergenerational similarity of internalizing symptoms. Journal of Youth and Adolescence, 41, 802–816. doi: 10.1007/s10964-011-9740-9 Brenning, K., Soenens, B., Braet, C., & Bosmans, G. (2011a). An adaptation of the Experiences in Close Relationships Scale-Revised for use with children and adolescents. Journal of Social and Personal Relationships, 28, 1048–1072. doi: 10.1177/0265407511402418 Brenning, K., Soenens, B., Braet, C., & Bosmans, G. (2011b). The role of depressogenic personality and attachment in the intergenerational similarity of depressive symptoms: A study with early adolescents and their mothers. Personality and Social Psychology Bulletin, 37, 284–297. doi: 10.1177/ 0146167210393533 Brenning, K., Soenens, B., Braet, C., & Bosmans, G. (2012). Attachment and depressive symptoms in middle childhood and early adolescence: Testing the validity of the emotion regulation model of attachment. Personal Relationships, 19, 445–464. doi: 10.1111/j.1475-6811.2011.01372.x Cohen, J. (1988). Statistical power analyses for the behavioral sciences (2nd ed.). Hillsdale, NJ: Erlbaum.
European Journal of Psychological Assessment 2015
Dwyer, K. M. (2005). The meaning and measurement of attachment in middle and late childhood. Human Development, 48, 155–182. doi: 10.1159/000085519 Finnegan, R. A., Hodges, E. V. E., & Perry, D. G. (1996). Preoccupied and avoidant coping during middle childhood. Child Development, 67, 1318–1328. doi: 10.1111/j.14678624.1996.tb01798.x Fraley, R. C., Waller, N. G., & Brennan, K. A. (2000). An item response theory analysis of self-report measures of adult attachment. Journal of Personality and Social Psychology, 78, 350–365. doi: 10.1037/0022-3514.78.2.350 Gore, P. A. (2000). Cluster analysis. In H. E. A. Tinsley & S. D. Brown (Eds.), Handbook of applied multivariate statistics and mathematical modeling (pp. 297–321). San Diego, CA: Academic Press. Harter, S. (1985). Manual for the self-perception profile for children. Denver, CO: University of Denver. Hazan, C., & Shaver, P. (1987). Romantic love conceptualized as an attachment process. Journal of Personality and Social Psychology, 52, 511–524. doi: 10.1037/0022-3514.52.3.511 Kerns, K. A., Klepac, L., & Cole, A. K. (1996). Peer relationships and preadolescents’ perceptions of security in the child-mother relationship. Developmental Psychology, 32, 457–466. doi: 10.1037/0012-1649.32.3.457 Kerns, K. A., Tomich, P. L., Aspelmeier, J. E., & Contreras, J. M. (2000). Attachment-based assessments of parent-child relationships in middle childhood. Developmental Psychology, 36, 614–626. doi: 10.1037/0012-1649.36.5.614 Kovacs, M. (1985). The Children’s Depression Inventory (CDI). Psychopharmacology Bulletin, 21, 995–998. Mikulincer, M., & Shaver, P. R. (2007). Attachment in adulthood: Structure, dynamics, and change. New York, NY: Guilford. Mikulincer, M., & Shaver, P. R. (2012). An attachment perspective on psychopathology. World Psychiatry, 11, 11–15. Milligan, G. W., & Cooper, M. C. (1985). An examination of procedures for determining the number of clusters in a data set. Psychometrika, 50, 159–179. doi: 10.1007/bf02294245 Mooi, E., & Sarstedt, M. (2011). Chapter 9: Cluster analysis. In E. Mooi & M. Sarstedt (Eds.), A concise guide to market research: the process, data, and methods using IBM SPSS statistics. Berlin, Germany: Springer. Saylor, C. F., Finch, A. J., Spirito, A., & Bennett, B. (1984). The Children’s Depression Inventory: A systematic evaluation of psychometric properties. Journal of Consulting and Clinical Psychology, 52, 955–967. doi: 10.1037/0022-006x.52.6.955 Shaver, P. R., & Mikulincer, M. (2002). Attachment-related psychodynamics. Attachment and Human Development, 4, 133–161. Sibley, C. G., Fischer, R., & Liu, J. H. (2005). Reliability and validity of the revised experiences in close relationships (ECR-R) self-report measure of adult romantic attachment. Personality and Social Psychology Bulletin, 31, 1524–1536. doi: 10.1177/0146167205276865 Sroufe, L. A., Egeland, B., Carlson, E. A., & Collins, W. A. (2005). The development of the person: The Minnesota study of risk and adaptation from birth to adulthood. New York, NY: Guilford Press. Tsagarakis, M., Kafetsios, K., & Stalikas, A. (2007). Reliability and validity of the Greek version of the revised experiences in close relationships measure of adult attachment. European Journal of Psychological Assessment, 23, 47–55. doi: 10.1027/1015-5759.23.1.47 Van den Bergh, B. R. H., & Marcoen, A. (1999). Harter’s selfperception profile for children: Factor structure, reliability, and convergent validity in a Dutch-speaking Belgian sample of fourth, fifth and sixth graders. Psychologica Belgica, 39, 29–47.
Ó 2015 Hogrefe Publishing
K. Brenning et al.: Measuring Attachment Anxiety and Avoidance
Van Ryzin, M. J., & Leve, L. D. (2012). Validity evidence for the security scale as a measure of perceived attachment security in adolescence. Journal of Adolescence, 35, 425–431. doi: 10.1016/j.adolescence.2011.07.014 Yunger, J. L., Corby, B. C., & Perry, D. G. (2005). Dimensions of attachment in middle childhood. In K. A. Kerns & R. A. Richardson (Eds.), Attachment in Middle Childhood (pp. 46–70). New York, NY: The Guilford Press. Zeman, J., Shipman, K., & Penza-Clyve, S. (2001). Development and initial validation of the children’s sadness management scale. Journal of Nonverbal Behavior, 25, 187–205. doi: 10.1023/a:1010623226626
9
Katrijn Brenning Department of Developmental, Personality and Social Psychology Ghent University H. Dunantlaan 2 9000 Ghent Belgium E-mail
[email protected]
Date of acceptance: January 10, 2015 Published online: xx, 2015
Ó 2015 Hogrefe Publishing
European Journal of Psychological Assessment 2015