Testing the Suitability of Wavelet Preprocessing for TSK Fuzzy Models Ademola Popoola, Member, IEEE, and Khurshid Ahmad
Abstract— Forecast performance on time serial data by soft computing models like fuzzy systems depends critically, in some cases, on the preprocessing methods used. Time series that exhibit changes in variance require preprocessing, and wavelet-based preprocessing provides a ‘natural’, parameterfree method for decomposing such time series. However, there are cases where the variance structure of a time series is homogeneous and wavelet-based preprocessing leads to worse results compared to an equivalent analysis carried out using raw data. An automatic method for detecting variance breaks in time series is used as an indicator as to whether or not wavelet-based preprocessing is required. We have evaluated our method by using ten economic time series from the US Census Bureau and Federal Reserve Board, and the results appear to have promise.
I. INTRODUCTION
S
OFT computing techniques - fuzzy systems, neural networks, genetic algorithms, chaos systems, and hybrids – are increasingly used for analysis of nonlinear time series. However, many time series are not only invariably nonlinear but also incorporate non-stationarity, significant distortions, and ‘dramatic changes in variance’ [1]. Moreover, many real-world systems comprise subprocesses that operate at different frequencies and timescales [2]. Global approximators may be inappropriate for characterizing such non-stationary time series [3]-[5], which exhibit complex local behavior – mean and variance changes, seasonality and other features. Limitations of global models have been addressed through the use of local approximation methods, and complex processes are characterized by decoupling and separately analyzing the different sub-processes, or components. In particular, methods based on the use of multiscale wavelet transform provide powerful analysis tools for decomposing time series into coefficients associated with time and a specific frequency band (or scale) [6]-[8]. The wavelet transform provides a good local representation of a signal, in both time and frequency domain, and is not restrained by the assumption of stationarity [9]. Wavelets
A. Popoola is with the Department of Computing, School of Electronics and Physical Sciences, University of Surrey, Guildford, GU2 7XH, UK (phone: +44 (0)1483-68-2206; fax: +44 (0)1483-68-6051; e-mail:
[email protected]). K. Ahmad is with the Department of Computer Science, Trinity College, Dublin 2, Ireland. He is a Visiting Professor at the University of Surrey, UK. (e-mail:
[email protected]).
have been described as robust parameter-free tools [10] that capture events that are local in time, without knowledge of the underlying generation phenomena [8], and thereby ‘formalize’ notions of decomposing time series into components [11]. Motivated by the capability of wavelets, hybrid models that use a combination of wavelets and other time series modeling tools have been developed. The focus in this study is on the use of wavelets as a preprocessing tool for time series analysis. Wavelet analysis has been used for data ‘filtering’ prior to the application of neural networks [12]-[16], fuzzy systems [17], [18], and autoregressive (AR) models [19], [20]. In these studies, models built from wavelet-processed data consistently resulted in superior model performance. However, a recent study on Takagi-Sugeno-Kang (TSK) fuzzy models of time series that exhibit seasonal changes and structural breaks indicates that, depending on the variance profile of the time series under analysis, models built from wavelet-processed data may under perform compared to models trained on raw data [21]. In this paper, we propose a methodology that uses formal hypothesis testing to determine a priori whether wavelet preprocessing will improve forecast performance. We evaluate our method using ten economic time series, and compare observed variance profiles of each time series with the corresponding forecast performance of fuzzy models built from raw and wavelet-processed data. The paper is organized as follows. In Section II, the use of wavelets for testing for homogeneity of variance is presented. This is followed, in Section III, by a description of the TSK fuzzy model used in our experiments, and the proposed method for automatically testing the suitability of time series for wavelet preprocessing. In Section IV, experimental results are presented and discussed. The conclusions of the paper are reported in Section V. II. WAVELET-BASED TEST FOR HOMOGENEITY OF VARIANCE In wavelet formalism, a suitably chosen mother wavelet function ψ can be used to expand a function X as: X (t ) =
∞
∞
∑ ∑w
j = −∞ k = −∞
j,k
2 j / 2ψ ( 2 j t − k )
where the functions ψ (2jt – k) are all orthogonal to one another, and wj,k provides information about the behavior of function X, focusing on effects of scale around 2-j. This is
the discrete wavelet transform (DWT). Two properties of the DWT are of particular relevance in this study. First, the variance of a time series is preserved and captured in the variance of its wavelet coefficients [9]. Thus, the wavelet variance, obtained by decomposing the variance of a time series on a scale-by-scale basis, can be used to partition and summarize the properties of a time series at different scales [8]. Second, the DWT effectively dissolves the correlation structure of heavily autocorrelated time series, using a recursive two-step filtering and downsampling method [8]. Coefficients resulting from wavelet-filtered data therefore form a near independent Gaussian sequence. These properties form the basis of the test for homogeneity of variance. The variance preservation and approximate decorrelation properties of the DWT have been used for constructing a statistical test for variance homogeneity in long memory processes [22]. The test depends on the hypothesis that, for a given time series X1, …, XN, each sequence of wavelet coefficients Wj,t for Xt approximates samples of zero mean independent Gaussian random variables with 2 2 variancesi σ 1 ,...,σ N . The null hypothesis for this test is: H 0 : σ 12 = σ 22 = ... = σ N2
and alternative hypotheses are of the form:
H1 : σ12 = ... = σ c2 ≠ σ c2+1 = ... = σ N2 where c is an unknown variance change point. The test statistic is based on the use of the normalized cumulative sum of squares, ηc:
ηc ≡
∑ ∑
c j =1 N j =1
w 2j w 2j
,
where wj are scale j DWT coefficients. ηc measures variance accumulation in a time series, as a function of time. A plot of the rotated cumulative variance thus provides a means of studying the time dependence of the variance of a series: if the variance is stationary over time, i.e. the null hypothesis is accepted, ηc should increase linearly with c, at approximately 45o, with each random variable contributing the same amount of variance; conversely, if Ho is rejected, considerable divergence from the 45o line will occur. To enable formal hypothesis testing, test statistic D is defined to be the maximum vertical deviation from the 45o line, with critical levels of D at 1%, 5% and 10% significance levels under Ho empirically generated using Monte Carlo simulations, based on 10,000 replicates [22]. D is defined in terms of its components D+ and D-:
D + ≡ max 1≤ c ≤ N −1
and
c − η c , N −1
(1)
D − ≡ max η c − 1≤ c ≤ N −1
c −1 ; N −1
(2)
then D ≡ max[D + , D − ] .
(3)
III. RESEARCH DESIGN AND METHODOLOGY In the following, we describe the fuzzy model used in the study, and the proposed approach for testing time series for suitability of wavelet-based preprocessing. A. TSK Fuzzy Model for Time Series Prediction Given a time series {Xt: t = 1,…,N,} the aim is to generate a single step prediction X(N+1) of the series. We utilize two schemes for our analysis: the first is a hybrid fuzzy-wavelet method [21], in which fuzzy models are constructed from wavelet processed time series. The second or ‘control’ method uses raw data in building fuzzy models. This enables comparison of forecast performance of models constructed from raw, and wavelet-processed time series. The hybrid method is executed in three stages. In the first stage, the time series is decomposed into different scales using a variant of the DWT, the redundant non-orthogonal transform called the maximal overlap discrete wavelet transform (MODWT). Unlike the DWT, the MODWT has shift invariance, which means that circularly shifting a time series will shift its MODWT coefficients in a similar manner. Also, the MODWT can handle any sample size, as opposed to the DWT, which can only handle dyadic sample sizes. In the second stage, a separate fuzzy model is generated for each scale. Therefore, for time series Xt, decomposed into J level wavelet components with details Di at different levels of decomposition and smooth SJ, J+1 fuzzy models are generated: f 1 : D1t − n , D1t − n + 1 , ... , D1t → D1t + 1 f2
: D 2 t − n , D 2 t − n + 1 , ... , D 2 t → D 2 t +1
fJ
: D J t − n , D J t − n + 1 , ... , D J t → D J t + 1
⋅ ⋅ f J + 1 : S J t − n , S J t − n + 1 , ... , S J t
→ S J t +1
In the third stage the individual predictions at each scale are combined to generate an aggregate forecast: X t + 1 = D1t + 1 + D 2 t + 1 + ... + D J t + 1 + S J t +1 . The fuzzy model used in our study is the subtractive clustering (SC) method [23], which does not need a prespecified number of clusters and their initial location, unlike fuzzy c-means (FCM) clustering technique. With SC, given N data points, each point xi is a candidate cluster center, and is associated with a measure Pi that indicates the extent to which the point can be regarded as a cluster center:
Pi =
∑e N
−α || xi − x m || 2
m =1
where ra is the cluster radius, α = 4/ra2, and ||.|| is the Euclidean distance. The data point with the highest potential, P1*, at location x1* is selected as the first cluster center. In general, after obtaining the kth cluster center, the potential of other points Pi is reduced based on their distance from the cluster center, until all remaining data points fall below a threshold defined as a fraction of the first potential P1*. B. Testing for Suitability of Wavelet Preprocessing It has been argued that wavelets are better suited for modeling time series that exhibit local behavior or structural changes [9]. Also, periods of high volatility that result in variance changes in economic and financial time series occur in localized regions or ‘clusters’ [24]. For time series that exhibit variance changes and volatility clustering, the use of wavelet preprocessing is potentially advantageous. Conversely, for time series with homogeneous variance, the use of universal approximation models like fuzzy systems may be appropriate and sufficient. Our method tests candidate time series for homogeneity of variance, and selects only time series that exhibit variance change(s) for wavelet preprocessing. We have been inspired by literature on tests for variance homogeneity of time series described in [22]: i.
Given a time series {xi }, i=1…N, create training {xa}, a=1…T , T critical value at 5% significance level, Ho is accepted: use raw data to generate fuzzy model Else Ho is rejected: use wavelet-processed data to generate fuzzy model We are interested in j=1 level of wavelet coefficients (Step iiia), which are most sensitive to the presence of variance change in a series [25]. Also, the effect of zero padding on variance change is eliminated by only selecting coefficients that are related to the actual, not the padded series (Step iiib).
IV. EXPERIMENTS AND RESULTS To evaluate the proposed method, we carried out simulations using ten experimental dataset that are described as exhibiting different interesting behavior strong seasonal components, trends and discontinuities [5]. Each series records the price or production volume of a good/service stored on a monthly basis: five US Census Bureau (USCB) retail sales data (120 points each); one USCB housing start data (516 points); and four industrial production series, which vary between 384 and 660, from the Federal Reserve Board (FRB). This data set was originally analyzed in [5], where the last 12 months data for each series are used as out-of-sample test sets, and the remaining data used for training and validation (last 12 months of in-sample data used for data validation). The same data-partitioning scheme has been used in our simulations. The subtractive clustering fuzzy model was used to build first-order TSK models from training data, without iterative optimization. Following [23], we used cluster radius, ra of 0.5, neighborhood radius of 1.5ra, thresholds for acceptance and rejection of candidate cluster centers, respectively, of 0.5 and 0.15 of the first potential P1*. Time lags between 1 and 20 were tested on the validation set, and lags with minimum mean absolute percentage error (MAPE) were used on the test set to obtain single-step forecasts. Forecast performance of the fuzzy model using (i) raw, unprocessed data and (ii) wavelet processed data were obtained on all ten time series. In all cases, MAPE values were computed after converting the pre-processed series back to the original. All experimental time series were also separately tested using the proposed algorithm to determine each series’ suitability for wavelet-based preprocessing. A. Results and Discussion The best results obtained from using raw (F-Raw) and wavelet-based processing (F-W), and recommended preprocessing methods using the proposed algorithm, are presented in Table I. In seven out of the ten time series studied, model performance improved with wavelet preprocessing, while there was degradation in performance for the remaining three time series (columns 4 and 5 in Table I). The results indicate that models trained on waveletprocessed data do not necessarily exhibit superior performance. Furthermore, tests for homogeneity of variance in the ten series signify that five of the series have homogeneous variance, while the other five are characterized by one or more variance changes. Therefore, using inhomogeneity of variance in the time series as the criterion for selecting time series suitable for wavelet-based processing, five of the series are selected as requiring wavelet preprocessing (column 2).
TABLE I PREPROCESSING METHOD SELECTION: COMPARISON OF ALGORITHM RECOMMENDATIONS AND ACTUAL (BEST) RESULTS Algorithm Data Sets
Recommendation
Actual (Best) Result
Method
MAPE
Method
MAPE
1. FRB Durable Goods
F-W
1.70
F-W
1.70
2. FRB Consumer goods
F-W
1.04
F-W
1.04
3. FRB Total production
F-W
1.06
F-W
1.06
4. FRB Fuels
F-W
1.02
F-W
1.02
5. USCB Book Store
F-Raw
8.43
F-W
6.92
6. USCB Clothing
F-Raw
4.26
F-Raw
4.26
7. USCB Department
F-Raw
2.45
F-Raw
2.45
8. USCB Furniture
F-Raw
3.88
F-Raw
3.88
9. USCB Hardware
F-Raw
5.05
F-W
3.30
F-W
3.28
F-W
3.28
10. USCB Housing Start
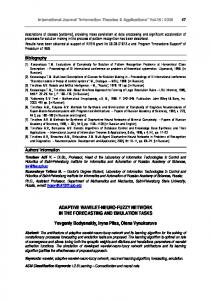
In comparison, empirically determined actual (best) results using both raw and wavelet-processed data indicate that seven out of the ten series benefit from wavelet-based processing. Thus, in all but two (shown in boldface in Table I) of the ten cases under consideration, the use of the proposed method correctly identifies time series that are best suited for wavelet-based preprocessing. In order to better understand the effect of the variance structure of time series on its suitability for wavelet-based processing, we examine the wavelet variance profiles of all ten series studied. Recall that wavelet variance decomposes the variance structure of a time series on a scale-by-scale basis. Plots of the wavelet variances of the ten series are presented in Figure 1. The numbering on the plots corresponds to specific time series in Table I. The plots show that USCB clothing, department, and furniture data (Figure 1, nos 6-8) exhibit homogeneous variance structure with respect to time. This suggests that there are no significant structural breaks or changes in these time series. Hence, universal approximators like fuzzy models by themselves are appropriate and sufficient for modeling their behavior. It appears that such series with homogeneous variance structures do not require significant preprocessing.
variance structures do not require significant preprocessing. This, perhaps, explains the deterioration in performance for the fuzzy-wavelet model as compared to the fuzzy-raw model for these three time series. Conversely, for five of the remaining seven series (Figure 1, nos 1-4, and 10), the variance structure is not homogeneous, indicating the presence of structural breaks and local behavior. For these series, wavelet-based preprocessing helped in improving forecast performance. These results are consistent with the observation in the literature that wavelets are better suited for data with significantly varied behavior across various time scales [8]. Further work is required to examine the two cases (Figure 1, nos 5 and 9) where the method failed to correctly prescribe the best processing method. We observe that the variance profiles of the two series are similar, with fairly homogeneous variance in scales 2-5, and noticeable discontinuity between scales 1 and 2. It has been suggested that the use of cross-validation, rather than the MAPE, will help in assessing the statistical significance of the results, especially the cases where the method failed to prescribe the correct processing method. This is currently being investigated. B. Comparison of Wavelet and Power Transformed Data It can be argued that, if wavelet preprocessing shows better performance for time series with nonstationarity in the variance, then (i) using Occam’s razor, one should apply relatively simpler preprocessing methods for stabilizing the variance of time series, rather than wavelets. Such methods include logarithmic and square root transformations, which are special cases of Box-Cox power transformations [26]; (ii) the effects on forecast performance for these transformations should be similar to those observed for wavelet-processed data. To investigate the above points, we compare the prediction performance of fuzzy models generated from (Box-Cox) power transformed data and wavelet-processed data (Table II).
Fig. 1. Multiscale wavelet variance for time series plotted on a log scale. Plots 1-4 and 10 indicate inhomogeneous variance structure; 5-9 exhibit homogeneous structure, though with noticeable discontinuities between scales 1 and 2 for plots 5 and 9
TABLE II COMPARISON OF FORECAST PERFORMANCE (MAPE) OF FUZZY MODELS DERIVED FROM WAVELET AND BOX-COX TRANSFORMED DATA (WORSE RESULTS RELATIVE TO RAW DATA ARE SHOWN IN BOLDFACE) Preprocessing Method
REFERENCES [1]
[2]
Data Sets Raw
Box-Cox
Wavelets
1. FRB Durable Goods
2.37
2.13
1.70
2. FRB Consumer goods
2.26
2.43
1.04
3. FRB Total production
1.94
1.59
1.06
4. FRB Fuels
1.89
1.18
1.02
5. USCB Book Store
8.43
6.90
6.92
6. USCB Clothing
4.26
10.41
8.94
7. USCB Department
2.45
4.28
3.21
8. USCB Furniture
3.88
6.96
4.84
9. USCB Hardware
5.05
4.24
3.30
10. USCB Housing Start
6.14
3.21
3.28
The maximum likelihood method was used to estimate the transformation parameter (λ) for power transformations, and MAPE values were computed after converting transformed series back to the original. We observe that models developed from wavelet decomposed data exhibit better performance for all time series, except USCB bookstore and housing start, where models from power transformed data are marginally better. Thus, for the time series analyzed, wavelet processing was better able to deconstruct the variance structure. Furthermore, the results show strikingly similar effects on forecast performance, relative to raw data, for both power transformed and wavelet processed data: better results in series with variance change (except FRB consumer goods), and worse results in USCB clothing, department, and furniture time series, where there is variance homogeneity. V. CONCLUSION We have described a method, based on hypothesis testing for variance homogeneity, for determining the suitability of wavelet preprocessing for subtractive clustering fuzzy models. The use of hypothesis testing, it appears, makes possible the automatic selection of candidate time series for wavelet processing. Initial results based on the analysis of economic time series are encouraging: in eight out of the ten cases investigated, the method successfully identifies candidate time series for wavelet preprocessing. The proposed approach needs to be further evaluated using (i) synthetic time series with known variance characteristics; (ii) much longer real-world time series that exhibit local behavior and variance change e.g. intraday trading data, Nile River data; (iii) cross validation to examine the statistical significance of observed results. We also intend to explore whether similar results are obtainable with other classes of fuzzy models, and neural networks.
[3]
[4]
[5]
[6] [7]
[8]
[9] [10] [11]
[12]
[13]
[14] [15] [16]
[17]
[18]
[19]
[20]
[21]
[22]
[23] [24]
[25]
[26]
C. W. J. Granger, “Forecasting in Economics,” in Time Series Prediction: Forecasting the Future and Understanding the Past, Edited by N. A. Gershenfeld and A. S. Weigend, Reading, Mass.: Perseus Books, 1994, pp. 529-538. R. Gençay, M. Dacorogna, R. Olsen, and O. Pictet, “Real-time foreign exchange trading models and market behavior,” J. Econ. Dyn. Control, vol. 27, no. 6, pp. 909-935, April 2003. F. Virili, and B. Freisleben, “Nonstationarity and data preprocessing for neural network predictions of an economic time series,” Proc. IEEE Conf. On Neural Networks, Como, Italy, July 2000, vol. 5, pp 129-134. M. Nelson, T. Hill, T. Remus, and M. O’Connor, “Time series forecasting using neural networks: Should the data be deseasonalized first?,” J. Forecasting, vol. 18, no. 5, pp. 359–367, September 1999. P.G. Zhang, and M. Qi, “Neural network forecasting for seasonal and trend time series,” Eur. J. Op. Res., vol. 160, no. 2, pp. 501-514, January 2005. I. Daubechies, Ten Lectures on Wavelets, Philadelphia: SIAM, 1992. I. Daubechies, “Where do wavelets come from? – A personal point of view,” Proc. IEEE Special Issue on Wavelets, vol. 84, no. 4, pp. 510513, April 1996. R. Gençay, F. Selçuk, and B. Whitcher, An Introduction to Wavelets and Other Filtering Methods in Finance and Economics, San Diego, California; London: Academic Press, 2002. D. B Percival, and A. T. Walden, Wavelet Methods for Time Series Analysis, Cambridge: Cambridge University Press, 2000. U-L. Pen, “Application of wavelets to filtering noisy data,” Phil. Trans. R. Soc. Lond., vol. 357, pp. 2561-2571, September 1999. J. B. Ramsey, “The contribution of wavelets to the analysis of economic and financial data,” Phil. Trans. R. Soc. Lond., vol. 357, pp. 2593-2606, September 1999. A. Aussem, and F. Murtagh, “Combining neural network forecasts on wavelet-transformed time series,” Connection Science, vol. 9, pp. 113122, March 1997. B. Zhang, R. Coggins, M. A. Jabri, D. Dersch, and B. Flower, “Multiresolution Forecasting for Futures Trading Using Wavelet Decompositions,” IEEE Trans. Neural Networks, vol. 12, no. 4, July 2001. S. Soltani, “On the use of the wavelet decomposition for time series prediction,” Neurocomp., vol. 48, nos. 1-4, pp. 267-277 October 2002. F. Murtagh, J.-L. Starck, and O. Renaud, “On neuro-wavelet modeling,” Dec. Sup. Syst., vol. 37, pp.475–484, 2004. E. Gómez-Ramírez, and A. Ayala-Hernández, “Evolutionary MultiResolution Filtering to Forecast Nonlinear Time Series,” J. Intell. Syst., vol. 14, no. 2/3, 2005. B. Zhang, L. Wang, J. Wang, “The Research of Fuzzy Modelling Using Multiresolution Analysis,” Proc. IEEE Conf. on Fuzzy Systems, pp. 378-383, 2003. A. Popoola, S. Ahmad, and K. Ahmad, “A Fuzzy-Wavelet Method for Analyzing Non-Stationary Time Series,” Proc. Conf. Advances in Soft Computing, Nottingham, UK, December 2004, pp. 231-236. O. Renaud, J.-L. Starck, and F. Murtagh, “Prediction based on a multiscale decomposition,” Int. J. Wavelets, Multiresolution and Information Processing, vol. 1, no. 2, pp. 217–232, 2003. O. Renaud, J.-L. Starck, and F. Murtagh, “Wavelet-based combined signal filtering and prediction,” IEEE Trans. Sys. Man and Cybernetics, Part B, vol. 35, no. 6, pp.1241-1251, December 2005. A. Popoola, S. Ahmad, and K. Ahmad, “Multiscale Wavelet Preprocessing for Fuzzy Systems,” Proc. ICSC Congress Comp. Intell. Methods and Apps., Istanbul, Turkey, December 2005. B. Whitcher, S.D. Byers, P. Guttorp, and D. B. Percival, “Testing for homogeneity of variance in time series: Long memory, wavelets, and the Nile River,” Water Resour. Res., vol. 38, no. 5, 2002. S. Chiu, “Fuzzy Model Identification Based on Cluster Estimation,” J. Intell. Fuzzy Systems, vol. 2, no. 3, pp. 267-278, 1994. P.H. Franses, and D.van Dijk, Non-linear Time Series Models in Empirical Finance, Cambridge and New York: Cambridge University Press, 2000. B. Whitcher, P. Guttorp, and D. B. Percival, “Multiscale detection and location of multiple variance changes in the presence of long memory,” J. Statist. Comp. Simulation, vol. 68, no. 1, pp. 65–88, 2000. Chatfield, C. The Analysis of Time Series: An Introduction. 5th Ed. Boca Raton: Chapman & Hall/CRC Press, 1996.