Objective: To test three methods of introducing health charts into the medical ... and #the ClinicalEpidemiology Unit, Sunnybrook Health Science Centre and ...
ORIGINAL RESEARCH * NOUVEAUTES EN RECHERCHE
Testing various methods of introducing health charts into medical records in family medicine units Renaldo N. Battista,*tt§ MD, ScD; J. Ivan Williams,*§ 1 PhD; Jane Boucher,§ MSc; Ellen Rosenberg,t§ MD; Sylvie J. Stachenko,1 MD, SM; Jeanne Adam,§ MSc; Carey Levinton,§l BSc; Samy Suissa,*t§ PhD Objective: To test three methods of introducing health charts into the medical records of six family medicine units. Design: Quasi-experiment. Participants: The staff physicians and family medicine residents in all six units and the nurses in two units. Interventions: Group 1 (minimal intervention): health charts, a user's guide and one training session. Group 2 (intermediate intervention): same intervention as for group 1 plus two feedback sessions at 3 and 6 months. Group 3 (maximum intervention): same intervention as for group 2 plus promotion of the team concept (nurses were included). The intervention phase lasted from September 1987 to August 198-8. Outcome measures: The frequency with which the health charts were used, the item scores of each preventive care activity and the overall unit scores. Data were gathered through chart audits at baseline and at the end of the intervention phase. Results: The frequency with which the health charts were used varied from 3.9% to 26.9%. The greatest increases in item scores were observed in the use of mammography (20.0%), counselling on lifestyle (19.4%) and breast examination (17.2%). Although the overall improvement in the unit scores was statistically significant (p < 0.05) the hypothesis of an increasing gradient of effect across the three intervention groups could not be tested because of the variation in scores across the units. Conclusion: Health charts and other similar tools are useful; however, they are not sufficient to change practice behaviours. The support of a "champion" on the health care team might well be a determining factor of success for the delivery of preventive services in primary care practice.
Objectif: Evaluer trois methodes d'introduction des fiches sante dans les dossiers medicaux de six unites de medecine familiale. Conception: Devis quasi-experimental. Participants: Residents et medecins dans les six unites et infirmieres dans deux unites. Interventions: Groupe 1 (niveau minimal): fiches sante, guide d'utilisation et seance de From the departments of *Epidemiology and Biostatistics, tFamily Medicine and tMedicine, McGill University, Montreal, Que., §the Division of Clinical Epidemiology, Montreal General Hospital, Montreal, Que., 1ithe Department ofFamily Medicine, University of Montreal, Montreal, Que., and #the Clinical Epidemiology Unit, Sunnybrook Health Science Centre and University of Toronto, Toronto, Ont. Dr. Battista is a research scholar of the National Health Research and Development Program, Ottawa, Ont. Dr. Suissa is a research scholar of the Fonds de la recherche en sante du Quebec, Montreal, Que.
Reprint requests to: Dr. Renaldo N. Battista, Division of Clinical Epidemiology, Montreal General Hospital, 1650 Cedar Ave., Montreal, PQ H3G 1A4 -
For prescribing information see page 1548
CAN MED ASSOC J 1991; 144 (11)
1469
formation. Groupe 2 (niveau intermediaire): meme intervention que pour le groupe 1 et deux sessions de retroaction a 3 et 6 mois. Groupe 3 (niveau maximum): meme intervention que pour le groupe 2 et promotion du concept d'equipe infirmieresmedecins. La phase d'intervention a dure de septembre 1987 a aouit 1988. Mesures des resultats: La frequence d'utilisation des fiches sante, les scores specifiques a chaque activite de prevention et les scores globaux pour chaque unite. Les donnees ont ete colligees a partir des dossiers medicaux avant et apres la phase d'intervention. Resultats: Le taux d'utilisation des fiches sante a varie de 3,9 % a 26,9 %. Des gains importants ont ete notes pour l'utilisation de la mammographie (20,0 %), le counselling sur les habitudes de vie (19,4 %) et l'examen des seins (17,2 %). Bien qu'une amelioration statistiquement significative (p < 0,05) ait ete notee dans les scores globaux des six unites, l'hypothese d'un effet croissant a travers les trois groupes n'a pu Wtre verifiee en raison de la variabilite des scores entre les unites. Conclusion: Les fiches sante et autres outils semblables sont utiles, mais insuffisants pour modifier les comportements de pratique. L'appui d'un dans l'equipe de soins semble etre un facteur determinant de succes dans l'integration des services preventifs A la pratique clinique.
In an era when the benefits of curative medicine are being questioned, renewed interest in the potential gains from the periodic monitoring of healthy people is emerging, as demonstrated by several landmark documents published in the past decade.'-3 Several surveys have suggested that physicians lack adequate knowledge about preventi've activities and generally underestimate the importance of their role in prevention.4-9 Although there is general agreement that preventive and curative services are fundamental and interdependent ingredients of good health care, the integration of preventive activities into medical practice seems to be a problem because of barriers related to providers and consumers of health care and to the organizational features of practices. 10-12 There is considerable evidence that new information and recommendations on measures to improve health care, even if widely disseminated, are not universally, extensively or quickly adopted.'3'4 Direct efforts to encourage physicians to change their professional behaviour are the most difficult and critical components of any strategy. One approach is to develop tools that will facilitate the performance of preventive activities recommended by task forces. Studies have shown that the introduction of flow sheets,'5-'7 checklists,'8 computer-generated prompts'9-24 or nurse-initiated reminders25 and the use of educational interventionsl6,23,26 have increased the level of integration of preventive activities into primary care practice. The objective of this study was to explore and test different strategies for increasing the level of preventive activities in family medicine units.
Methods We used a quasi-experimental design to test the 1470
CAN MED ASSOC J 1991; 144 (11)
effects of three levels of intervention. We hypothesized an increasing gradient of effect across the three intervention groups.
Interventions Three study groups were formed to receive different interventions from September 1987 to August 1988. Each group comprised two family medicine teaching units: one from the McGill University program and the other from the University of Montreal program. The groups were balanced with respect to possible confounders such as university program, type of hospital (tertiary care or community) and location (southeastern and northeastern sections of the greater Montreal area) as proxy measures of the socioeconomic status of patients. The health charts were designed on the basis of the recommendations of the Canadian Task Force on the Periodic Health Examination2 and, to a lesser extent, complementary documents such as those recommended by Breslow and Somers,' the Institute of Medicine27 and the College of Family Physicians of Canada.28 The various age-specific and sex-specific health protection packages proposed in the task force recommendations were incorporated into the health charts; the packages covered three areas: history and physical examination, immunization and laboratory testing, and counselling. For the purpose of this study, emphasis was placed on the four adult age categories (20 to 44 years, 45 to 64, 65 to 76 and 77 years or older). Group I (minimum level of intervention): This group comprised physicians and family medicine residents in units A and B. All of the residents and staff members received an intervention package consisting of the health charts, an accompanying user's guide and a comprehensive training session. Group 2 (intermediate level of intervention): In LE Ier JUIN 1991
m
this group, comprising physicians and family medicine residents in units C and D, the same intervention as described for group 1 was given along with two detailed feedback sessions at 3 and 6 months based on samples of data abstracted from medical records and analysed before each feedback session. Group 3 (maximum kvel of intervention): This group, in units E and F, incorporated the team concept and included physicians, residents and nurses working together. All of the team members received the health charts, the user's guide, the training session and the feedback sessions at 3 and 6 months.
Outcome variables Three outcomes were examined: (a) use of the health charts - success was defined as the presence of the health charts in the medical record and at least one preventive item reported as covered (or checked) in the charts; (b) individual item scores of preventive activities - the score was the proportion of eligible patients offered a given intervention in each unit; and (c) overall unit scores of preventive activities these scores were the estimated proportions of recommended age-specific and sex-specific preventive items recorded in the health charts or medical records of each unit. The three outcomes were examined from data gathered during the last 3 months of the intervention phase but pertaining to the entire 12-month period. In addition, baseline item and unit scores were determined before the beginning of the intervention phase.
Field work and data collection To establish baseline levels of preventive practice in each unit, 1170 medical records stratified by age and sex were sampled through a systematic selection technique and reviewed retrospectively for the 5 years before the introduction of the health charts into clinical practice. At 3 and 6 months into the study 100 charts were sampled from each of units C, D, E and F in order to provide feedback to the participants. The fourth collection period focused on the last 3 months of the intervention phase; 1800 charts were systematically selected to examine the overall use of the charts and the degree to which preventive activities were integrated into clinical practice in the previous year. Although the length of the abstraction period at baseline and at the end of the intervention phase differed, the data were adjusted for time through the standards of practice adopted in the study. Data abstraction forms were designed for the coding of information. Data were retrieved from the JUNE 1, 1991
.M
medical records and the health charts whenever appropriate. Written standards, prepared by the project coordinator (J.B.) and two family physicians (R.N.B. and S.J.S.), were provided to data abstractors. Interrater and intrarater reliability of the abstractors was then examined through randomly selected medical records independently scored by the project coordinator and the abstractors. An interrater agreement of more than 95% (direct agreement) was achieved and maintained throughout the study. Intrarater reliability was equally good, an agreement of 98% being obtained for all four data collection periods. Statistical significance was determined with the use of the Wilcoxon signed rank one-tailed test.29
Results The baseline characteristics of the family medicine units are shown in Table 1. The number of patient visits during the intervention phase varied considerably across the six units. Although the number of residents assigned to each unit was relatively similar, the number of physicians and nurses varied. The number of patient visits per health care provider further documented the variations in the intensity of clinical practice across the units. The greatest use of the health charts (26.9%) was in unit F (maximum intervention). Units C (intermediate intervention), E (maximum) and B (minimum) had virtually identical levels of use: 13.0%, 13.3% and 13.8% respectively. The remaining two units recorded very low levels of use: unit A (minimal intervention) 3.9% and unit D (intermediate) 5.0%. The item scores for baseline data indicated that a broad spectrum of preventive activities had been practised in the units (Table 2). The measurement of blood pressure was the most common preventive action noted. Indeed, 84% (weighted average) of the patients had their blood pressure taken. Counselling on the use of medications ranked second, 79% of the patients 65 years of age or older receiving advice on the effects and side effects of drug use. Evaluation of functional status, measurement of weight and counselling on lifestyle were recorded in slightly more than 50% of the charts of eligible patients. Breast examination, Papanicolaou smear and counselling on life stages, mental health, smoking, nutrition, and sex and contraception were reported for 30% to almost 50% of the eligible patients. All of the other items were covered in less than 30% of the charts of eligible patients, the scores for immunization being notably low. The item scores varied among the six units. The greatest increases in the item scores after intervention were in the use of mammography CAN MED ASSOC J 1991; 144 (1 1)
1471
(20.0%), counselling on lifestyle (19.4%) and breast examination (17.2%). The items with the next biggest increases were evaluation of functional status (1 5. 1%), assessment of vision (1 1.6%) and counselling on exercise (9.4%). Counselling on smoking
increased by 8.3%. Counselling on accidents, support services and occupational health decreased (by 3.6%, 2.7% and 0.8% respectively). The remaining items had modest increases (less than 8%). Relative changes in the item scores (with respect
..A
*.
-
i.
:-..
4 4 4
Ib
--i,,,1805-Ic>
,-
1.,
1)98
1.4
:
3;(-. ..' u
ryI
4b 0 1 805 39.4 1 805)
.:t,. 4r.
(598;
576-
40.2
1 6.
34.6 1 805" 3
168
1472
CAN MED ASSOC J 1991; 144 (1I
J)
1
-1.
(.
:
., 1-
:5981
9 1XQ)0S
539 8,
--, -' .., e -t-
12077
G8 1805) 'S 1(805) ;35 5 (I1 207
'568'
,
...1
..0 s805?
769:! 597
3
-i P
705,
,-
-.
LE I er JUIN 1991
m
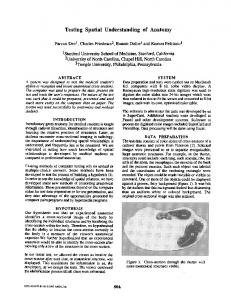
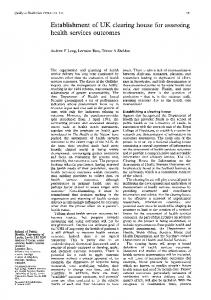
to the baseline scores) were calculated but not reported, since they can be misleading when the baseline score is either very low or very high. Relative changes in scores (with respect to the maximum improvement achievable from baseline scores) did not add much to the information provided by the absolute differences in scores. Approximately 33% of the recommended health care items were found at baseline in the medical records of units B (minimal intervention), C (intermediate) and F (maximum), whereas approximately 25% of the same items were found in the records of units A (minimal intervention) and E (maximum) (Fig. 1). Unit D (intermediate intervention) had a particularly low baseline score, only 18.3% of the eligible items being found in 193 medical charts selected. As at baseline, units B, C and F achieved the highest levels of preventive practice after the intervention phase, the overall scores being 52.6%, 40.1% and 36.7% respectively (Fig. 1). Again, units A and E followed, with 31.1% and 29.2%, and unit D remained low, at 17.8%. Clearly unit B demonstrated the greatest increase (17.7%) in the degree of inclusion of preventive activities. Increases for the other units were 7.2% (unit C), 5.4% (unit A), 3.9% (unit E) and 1.5% (unit F). In contrast, preventive activities were decreased by 0.5% in unit D. The overall improvement in the unit scores after the interventions was statistically significant (p < 0.05). Because of the variation in the unit scores we could not test our hypothesis of an increasing gradient of effect across the three intervention groups.
Discussion Our baseline information shows the varying degree at which recommendations are integrated into clinical preventive care and the diversity of performance levels in the six participating units. 100 80 o
52.6
60-
2040.1
20-
25.7
34.9
18~.3
32.9
0
25.3
35.2
E
F
17.8
A
B
D
C
Unit
Fig. 1: Overall unit scores of preventive activities for six family medicine units. White bars represent scores at baseline, and diagonally striped bars represent differences in scores after intervention. JUNE 1, 1991
The item scores indicated a clear improvement in the performance of several preventive activities such as the assessment of functional status, breast examination, mammography and counselling on lifestyle. Also, according to the unit scores increased performance, albeit of varying magnitude, was observed in five of the six units. Although seemingly modest, these changes are clinically relevant in that the potential public health impact of even small improvements in preventive care has been recog-
nized.'"2 Our hypothesis of an increasing gradient of effect across the three intervention groups could not be properly tested. The fact that unit B received the least intervention but showed the best performance and that unit D had feedback sessions but had the poorest performance testifies to the importance of the effect attributable to the unit itself. We could not identify any specific pattern in the number of patient visits per health care provider that correlated with our findings. A closer examination of the organizational structure of each unit pointed to a possible explanation for our findings. Unit B may have had the highest performance rating because of the enthusiasm and motivation of a very forceful advocate of preventive care. This "champion" was a nurse who had espoused the goals of the study and who promoted the introduction of the health charts into the medical record to remind residents and physicians of the importance of prevention on a daily basis. In contrast, in unit D there were major difficulties in the functioning of the unit throughout the study period. In fact, the unit underwent a major phase of instability because of a change in directorship and performed a substantive overhaul of the chart system during the study. Although we concur with Belcher30 that health charts and other similar tools are useful we do not believe that they are sufficient to change practice behaviours. Organizational factors, including the type of practice, the infrastructure and the reimbursement policies, are held by many to be the most powerful determinants of clinical practice.'0-'231-33 Hence, our findings have limited generalizability to other types of practices in that family medicine teaching units are not usually submitted to the pressures of fee-for-service practice. The great potential for the delivery of preventive services in primary care practice falls short of full realization. However, there may well be a limit to the level of preventive care achievable through a clinically based approach. A "ceiling effect"34 might be unavoidable. Therefore, a more broadly based approach to preventive care should be considered. Clinical and population strategies must be coordinated. Research into the delivery of preventive services should adopt a multifaceted perspective. More elabCAN MED ASSOC J 199 1; 144 ( 11)
1473
orate interventions based on the principles of behavioural sciences and organizational theory could be tested. Primary care and community health workers will have to determine their role in the common goal of improving the health of their patients.
16.
17.
We thank the participants in the family medicine units for their support and collaboration. We also thank Dr. Lawrence Joseph for providing comments on a previous version 18. of this article and Ms. Diane Telmosse, Ms. Azana Endicott, Ms. Barbara Cont and Ms. Dany Blanchette for 19. their assistance in preparing the manuscript. This study was funded by grant 6605-2544-57 from the National Health Research and Development 20. Program.
References 1. Breslow L, Somers AR: The lifetime health-monitoring program: a practical approach to preventive medicine. N Engl J Med 1977; 296: 601-608 2. Canadian Task Force on the Periodic Health Examination: The periodic health examination. Can Med Assoc J 1979; 121: 1193-1254 3. US Preventive Services Task Force: Guide to Clinical Preventive Services: an Assessment of the Effectiveness of 169
4. 5.
6.
7.
8. 9.
10. 11.
Interventions, Williams & Wilkins, Baltimore, 1989 Romm FJ, Fletcher SW, Hulka BS: The periodic health examination: comparison of recommendations and internists' performance. South Med J 1981; 74: 265-271 Battista RN: Adult cancer prevention in primary care: patterns of practice in Quebec. Am J Public Health 1983; 73: 1036-1039 Woo B, Woo B, Cook EF et al: Screening procedures in the asymptomatic adult - comparison of physicians' recommendations, patients' desires, published guidelines, and actual practice. JAMA 1985; 254: 1480-1484 Gemson DH, Elinson J: Prevention in primary care: variability in physician practice patterns in New York City. Am J Prey Med 1986; 2: 226-234 McPhee SJ, Richard RJ, Solkowitz SN: Performance of cancer screening in a university general internal medicine practice. J Gen Intern Med 1986; 1: 275-281 Lurie N, Manning WG, Peterson C et al: Preventive care: Do we practice what we preach? Am J Public Health 1987; 77: 801-804 Inui TS, Belcher DW, Carter WB: Implementing preventive care in clinical practice: I. Organizational issues and strategies. Med Care Rev 1981; 38: 129-154 Carter WB, Belcher DW, Inui TS: Implementing preventive care in clinical practice: II. Problems for managers, clinicians and patients. Ibid: 195-216
12. Battista RN, Williams JI, MacFarlane MA: Determinants of primary medical practice in adult cancer prevention. Med
21. 22.
23.
24.
25.
26. 27.
28.
29. 30. 31. 32.
Care 1986; 24: 216-224 13. Lloyd JS, Abrahmson S: The effectiveness of continuing medical education: a review of the evidence. Eval Health Prof 33. 1979; 2: 251-280 14. Haynes RB, Davis PA, McKibbon A et al: A critical appraisal of the efficacy of continuing medical education. JAMA 1984; 34. 251: 61-64 15. Madlon-Kay DJ: Improving the periodic health examination:
1474
CAN MED ASSOC J 1991; 144 (I1)
use of a screening flow chart for patients and physicians. J Fam Pract 1987; 25: 470-473 Shank JC, Powell T, Llewelyn J: A five-year demonstration project associated with improvement in physician health maintenance behaviour. Fam Med 1989; 21: 273-278 Prislin D, Vandenbark MS, Clarkson QD: The impact of a health screening flow sheet on the performance and documentation of health screening procedures. Fam Med 1986; 18: 290-292 Cheney C, Ramsdell JW: Effect of medical records' checklists on implementation of periodic health measures. Am J Med 1987; 83: 129-136 Laurent D, Mashruwala MD, Lucas CP: A computerized data-handling system in hypertension management. Arch Intern Med 1980; 143: 345-350 Cohen DI, Littenberg B, Wetzel C et al: Improving physician compliance with preventive medicine guidelines. Med Care 1982; 20: 1040-1045 Knight BP, O'Malley MS, Fletcher SW: Physicians' acceptance of a computerized health-maintenance prompting program. Am J Prev Med 1987; 3: 19-24 McDonald CJ: Protocol-based computer reminders, the quality of care and the non-perfectibility of man. N Engi J Med 1976; 295: 1351-1355 Tiemey WM, Hui SL, McDonald CJ: Delayed feedbaok of physician performance versus immediate reminders to perform preventive care - effects on physician compliance. Med Care 1986; 24: 659-666 McDonald CJ, Hui SL, Smith DM et al: Reminders to physicians from an introspective computer medical record a two-year randomized trial. Ann Intern Med 1984; 100: 130138 Davidson RA, Fletcher SW, Retchin S et al: A nurse-initiated reminder system for the periodic health examination implementation and evaluation. Arch Intern Med 1984; 144: 2167-2170 Dickinson JC, Warshaw GA, Gehlbach SH et al: Improving hypertension control: impact of computer feedback and physician education. Med Care 1981; 19: 843-854 Preventive Services for the Well Population. Report of the Institute ofMedicine, National Academy of Sciences, Healthy People (Appendices), US Dept of Health, Education, and Welfare, Washington, 1978: 1-22 Patterns of Practice and Health Care Delivery Committee: Health Maintenance Guide, College of Family Physicians of Canada, Willowdale, Ont, 1983 Sprent P: Applied Non-Parametric Statistical Methods, Chapman and Hall, London, 1989: 86-96 Belcher DW: Implementing preventive services: success and failure in an outpatient trial. Arch Intern Med 1990; 150: 2533-2541 Green LW, Eriksen MP, Schor EL: Preventive practices by physicians: behavioral determinants and potential interventions. Am JPrev Med 1988; 4 (4, suppl): 101-107 Battista RN, Mickalide AD: Integration of preventive services into primary care: a conceptual framework for implementation. In Goldbloom RB, Lawrence RS (eds): Preventing Disease: Beyond the Rhetoric, Springer-Verlag, New York, 1990: 467-473 Belcher DW, Berg AO, Inui TS: Practical approaches to providing better preventive care: Are physicians a problem or a solution,? Am J Prev Med 1988; 4 (4, suppl): 27-45 Buchner DM, Larson EB, White RF: Influenza vaccination in community elderly - a controlled trial of post card reminders. JAm Geriatr Soc 1987; 35: 755-760
For prescribing information see page 1542-