Testing Web Sites: Five Users Is Nowhere Near Enough Jared Spool User Interface Engineering 242 Neck Rd. Bradford, MA 01835 USA +1 978 374 8300
[email protected] ABSTRACT
We observed the same task executed by 49 users on four production web sites. We tracked the rates of discovery of new usability problems on each site and, using that data, estimated the total number of usability problems on each site and the number of tests we would need to discover every problem. Our findings differ sharply from rules-ofthumb derived from earlier work by Virzi[1] and Nielsen[2,3] commonly viewed as “industry standards.” We found that the four sites we studied would need considerably more than five users to find 85% of the problems Keywords
usability testing, number of users, usability engineering, web usability INTRODUCTION
Previous work on this topic [1,2,3] addressed the “How many tests are needed to find x% of the usability problems?” question with a priori models ignoring the effect of specific products, investigators, and techniques. And yet specific site or product features, individual’s testing techniques, complexity of usability tasks, and type or level of problem looked for must affect the number of problems that evaluators will find. We feel the analytical tools used in previous work [1,2] are generally valid and we’ve extended them in this paper. However, we challenge the “rule of thumb” conclusion drawn from them [3] using the test data we’ve presented here. We believe a new approach that’s based on rate of discovery of problems as testing progresses is required. TESTS
To test our theory, we conducted usability tests of four sites. Three of the sites primarily sell music CDs and movie videos and DVDs. The fourth site sells electronic gadgets. The users for the study all had a history of purchasing these types of products on-line. Each user made a list of specific products they wanted to purchase in each of the product categories. We conducted 49 tests, each with the same purchasing mission: “Describe an item that you want and buy it on this site.” The only differences between each test were the
Will Schroeder User Interface Engineering 242 Neck Rd. Bradford, MA 01835 USA +1 978 374 8300
[email protected] objects each user was attempting to purchase, which were taken from the shopping list each user brought to the test. We designed the test to accentuate problems that arise in the purchase process. To this end, we gave each user enough money to purchase the items within a predetermined budget for the site they were testing. Using that money, we instructed them to buy anything they wanted on the site or nothing. Users kept what they bought and any money they did not spend as well. From this we identified 378 problems that prevented people from completing their purchase. Although each usability test in this case was just a single task (“purchase a product”), we evaluated the complete purchasing process on each site which was equivalent to the usability tests providing the data in prior work[1,2]. Table 1 shows the problems we discovered in each test in the sequence for each site and how many were new (had not been observed previously in the test series). ANALYSIS
Estimates of the number of tests needed to find a fraction of all usability problems present in [2] are based on an assumed value of L—the expected proportion of usability problems found testing any single user. The probability of finding a new obstacle in test i is: pi = L(i-1) (1) pi is not only the expected fraction of obstacles in the ith test which will be new, but also the fraction of new obstacles not yet found. If we can estimate L then we can also estimate the test number i for which a percentage of obstacles will remain. The average of probabilities of finding a new obstacle in tests 1 through i is: (ai) = newi/alli. Smoother estimates of L based on a are still too noisy to use, so a cumulative average of the values is taken L = (iai – (i –1)ai-1)1/(i-1)
L = ΣL(estimated)/i
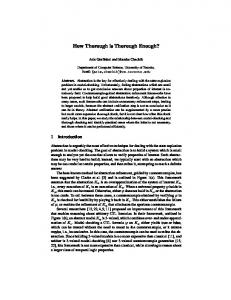
From (1) the test number where x% of obstacles remain to be found is: Tx% = Log(x/100)/Log(L) + 1 The rule-of-thumb given in [3] would estimate T10% as 6.2. For the first site, after we’d conducted 6 tests, the calculated value was 27, far above the rule-of-thumb estimate. Figure 1 gives estimates of T10% made after each completed test for sites I-IV. Note how all of the values are above 6.2, in some cases as high as 33.
whether) serious problems surface. If all serious problems are to be found, the task must take users over every possible path. The magnitude of L and the number of problems found in each test (new + old) together measure the effectiveness of a test. A good test finds a lot of problems with each user, and a rapidly decreasing fraction of new problems.
35
T10%
30 25
I
20
II
15
III
10
IV
5
Of the tests used to develop the “average” L =.31 in [2], three were voice response systems (averaging .34), two mainframe applications (averaging .33), one videotex (.51) and five were PC applications (averaging .28.) The lowest L (“Office system (integrated spreadsheet, etc.)”) was .16. In testing four sites, we found no L higher than .16.
0 2
6
10 Test Number
14
18
Figure 1: T10% made after each completed test
It is not hard to come up with reasons why e-commerce web sites might not have the same L values as voiceresponse systems, or even as a circa-1992 Office Suite. Today’s web sites have millions of pages of complex data where users have to make many personal choices.
Estimate of L
0.25 0.2
I
0.15
II III
0.1
The implications of these findings show that fundamental changes in our thinking about usability engineering will need to occur. What happens to a development process when the number of tests can’t be predicted until testing has begun?
IV
0.05 0 2
6
10 Test Number
14
18
Figure 2 shows L derived from Table 1’s data. None of the 11 products in [2] showed L near the values we saw in our study.
Analysis of this new data indicates that the formula given in [3] can still be usefully applied, but more work needs to be done in determining an appropriate value of L to use for web site testing. It looks very much like five users are not enough.
DISCUSSION
REFERENCES
Figure 2: L Derived from table 1
1. Virzi, Robert A. Refining the Test Phase of Usability Evaluation: How Many Subjects Is Enough?. Human Factors 34,4 (1992), 457-468.
Nielsen [3] proclaims that 5 users is enough to catch 85% of the problems on practically any web site. But our data shows differently. On sites I and II, taking L = 0.1 we had found approximately 35% of the problems after the first five users.
2. Nielsen, Jakob and Landauer, Thomas K. A Mathematical Model of the Finding of Usability Problems. INTERCHI ’93 206-213.
According to [1], serious usability problems are found “early in the testing.” In our studies, serious usability problems that prevented intended purchases were found on Site I first in tests 13 and 15. Is halfway through “early?” The design of the task obviously bears on when (and
All New All New All New All New
3. Nielsen, Jakob Why You Only Need To Test With Five Users, Jakob Nielsen’s Alertbox, March 19, 2000, http://www.useit.com/alertbox/20000319.html
Site
1
2
3
4
5
6
7
8
9
10 11 12 13 14 15 16 17 18
I I II II III III IV IV
14 14 15 15 6 6 6 6
6 5 5 4 7 7 7 5
8 7 2 1 4 1 17 13
7 5 7 5 11 9 11 6
12 7 6 2 7 5 6 5
9 5 12 9 10 6 7 2
12 11 5 5 5 2
7 6 6 2
11 9 1 0
14 10 13 8
7 5 6 2
Table 1. Obstacles Found By Test
8 5 6 4
6 2 1 0
10 8 7 2
7 3 3 2
4 1 6 3
8 2 2 1
14 9 7 1


![[PDF] Download Nowhere Near You Full Book - Google Sites](https://m.moam.info/img/260x300/pdf-download-nowhere-near-you-full-book-google-sit_6477ca76097c4737708c1742.jpg)