71
Testosterone protects from metabolic syndrome-associated prostate inflammation: an experimental study in rabbit Linda Vignozzi1, Annamaria Morelli1, Erica Sarchielli3, Paolo Comeglio1, Sandra Filippi4, Ilaria Cellai1, Elena Maneschi1, Sergio Serni5, Mauro Gacci5, Marco Carini5, Marie-Pierre Piccinni6, Farid Saad7,8, Luciano Adorini9, Gabriella B Vannelli3 and Mario Maggi1,2 1
Sexual Medicine and Andrology Unit, Department of Clinical Physiopathology, University of Florence, Viale Pieraccini 6, Florence 50139, Italy
2
CIRMAR (Centro Interuniversitario di Ricerca sulle basi molecolari della Malattie della Riproduzione), Milan, Italy
3
Department of Anatomy, Histology and Forensic Medicine, 4Interdepartmental Laboratory of Functional and Cellular Pharmacology of Reproduction, 5 Department of Urology and 6Immunoallergology Unit, Department of Internal Medicine, Center of Excellence for Research, Transfer and High Education DENOTHE, University of Florence, Florence, Italy
7
Scientific Affairs Men’s Healthcare, Bayer Pharma AG, Berlin, Germany
8
Gulf Medical University, Ajman, United Arab Emirates
9
Intercept Pharmaceuticals Italia Srl, Via Togliatti, 06073 Corciano, Perugia, Italy
(Correspondence should be addressed to M Maggi at Sexual Medicine and Andrology Unit, Department of Clinical Physiopathology, University of Florence; Email:
[email protected])
Abstract Metabolic syndrome (MetS) and benign prostatic hyperplasia (BPH)/lower urinary tract symptoms (LUTS) are often associated. One of their common denominators is hypogonadism. However, testosterone supplementation is limited by concerns for potential prostatic side effects. The objective was to determine whether MetS-associated prostate alterations are prevented by testosterone supplementation. We used a previously described animal model of MetS, obtained by feeding male rabbits a high-fat diet (HFD) for 12 weeks. Subsets of HFD rabbits were treated with testosterone or with the farnesoid X receptor agonist INT-747. Rabbits fed a standard diet were used as controls. HFD-animals develop hypogonadism and all the MetS features: hyperglycemia, glucose intolerance, dyslipidemia, hypertension, and visceral obesity. In addition, HFD-animals show a prostate inflammation. Immunohistochemical analysis demonstrated that HFD-induced prostate fibrosis, hypoxia, and inflammation.
The mRNA expression of several proinflammatory (IL8, IL6, IL1b, and TNFa), T lymphocyte (CD4, CD8, Tbet, Gata3, and ROR gt), macrophage (TLR2, TLR4, and STAMP2), neutrophil (lactoferrin), inflammation (COX2 and RAGE), and fibrosis/myofibroblast activation (TGFb, SM22a, aSMA, RhoA, and ROCK1/ROCK2) markers was significantly increased in HFD prostate. Testosterone, as well as INT-747, treatment prevented some MetS features, although only testosterone normalized all the HFD-induced prostate alterations. Interestingly, the ratio between testosterone and estradiol plasma level retains a significant, negative, association with all the fibrosis and the majority of inflammatory markers analyzed. These data highlight that testosterone protects rabbit prostate from MetS-induced prostatic hypoxia, fibrosis, and inflammation, which can play a role toward the development/progression of BPH/LUTS.
Introduction
In epidemiological studies, LUTS was associated with several MetS features, including obesity (Rohrmann et al. 2004, Seim et al. 2005, Laven et al. 2008), hypertension and type 2 diabetes mellitus (Michel et al. 2000, 2004, Tomita et al. 2009), hyperglycemia and low high density lipoprotein (HDL) cholesterol (Martin et al. 2011), and high polyunsaturated fat energy intake (Litman et al. 2007). Interestingly, we have recently demonstrated a positive association between obesity and ultrasound or biochemical (seminal interleukin 8 (IL8)) features of prostate inflammation (Lotti et al. 2011). Relationship between MetS and LUTS has been investigated in some animal models (Andersson et al. 2011),
Lower urinary tract symptoms (LUTS), generally regarded as a hallmark of benign prostatic hyperplasia (BPH), result from static (prostate enlargement), dynamic (a-receptor-mediated muscle tension), and inflammatory (prostate inflammation) components (Nickel 1994, Fibbi et al. 2010, Moul & McVary 2010, Donnell 2011). A growing body of evidence has documented a strong and independent association between BPH/LUTS and obesity/ metabolic syndrome (MetS; Mongiu & McVary 2009, Moul & McVary 2010, Gorbachinsky et al. 2010, Parsons 2011). Journal of Endocrinology (2012) 212, 71–84 0022–0795/12/0212–071 q 2012 Society for Endocrinology
Journal of Endocrinology (2012) 212, 71–84
Printed in Great Britain
DOI: 10.1530/JOE-11-0289 Online version via http://www.endocrinology-journals.org
72
L VIGNOZZI
and others . Testosterone prevents MetS-induced prostatitis
including a mouse model of type 2 diabetes mellitus/obesity (diabesity) in which prostate inflammation and bladder dysfunction were evident (Krajewska et al. 2008). MetS appears, therefore, related to the development of LUTS. Potential common etiological factors include hyperglycemia, insulin resistance, low-grade chronic inflammation (Moul & McVary 2010), and also hypogonadism (Pradidarcheep 2008). Recent data have in fact suggested that low testosterone in males might be considered an additional MetS component (Corona et al. 2009, Zitzmann 2009, Corona et al. 2011a,b, Traish et al. 2011). Although testosterone supplementation in MetS significantly improves metabolic parameters (fasting glucose, glucose tolerance, waist circumference, triglycerides, and HDL cholesterol; Corona et al. 2011a), concerns of potential prostatic side effects strongly limit a widespread clinical use. These concerns are based on the concept that androgens are essential for prostate growth, which potentially can worsen LUTS. However, some prospective (Kristal et al. 2008, Trifiro et al. 2010) and cross-sectional studies (Schatzl et al. 2000, Tan et al. 2003, Roberts et al. 2004, Miwa et al. 2008, St Sauver et al. 2011) have demonstrated an inverse association between serum testosterone and LUTS or BPH. Consistent with these observations, testosterone replacement therapy has been reported to relieve LUTS in hypogonadal men with both BPH (Holma¨ng et al. 1993, Saad et al. 2007, Kalinchenko et al. 2008, Karazindiyanog˘lu & C ¸ ayan 2008, Saad et al. 2008, Amano et al. 2010, Shigehara et al. 2011) and MetS (Haider et al. 2009). In this study, we use a previously described animal model of high-fat diet (HFD)-induced MetS in rabbit. MetS was characterized by hyperglycemia, glucose intolerance, hypercholesterolemia, hypertrygliceridemia, hypertension, increased visceral fat mass, and hypogonadotropic hypogonadism (Filippi et al. 2009, Vignozzi et al. 2011), We now report an additional feature of HFD-induced MetS: prostate inflammation. We also investigate the effect of dosing testosterone or INT-747, a farnesoid X receptor (FXR) agonist, because we previously demonstrated that these treatments could ameliorate/treat several MetS features (Filippi et al. 2009, Vignozzi et al. 2011). FXR is steroid nuclear receptor critically involved in the regulation of the hepato-biliary system, which also regulates lipid and glucose homeostasis, even in the HFD-induced MetS (Morelli et al. 2011). In previous studies, while testosterone supplementation also reverted MetS-associated hypogonadism (Filippi et al. 2009), INT-747 did not (Vignozzi et al. 2011).
Materials and Methods HFD rabbit model HFD-induced MetS rabbit model, as well as testosterone or INT-747 treatments, has been performed as described previously (Filippi et al. 2009, Vignozzi et al. 2011). Briefly, male New Zealand White rabbits (Charles River, Calco, Journal of Endocrinology (2012) 212, 71–84
Table 1 Primer sequences for quantitative RT-PCR in rabbit samples Gene names
Primer sequences
TLR2
F: 5 0 -CCGCGGGTTCCCCAGGTTG-3 0 R: 5 0 -GGATCTGGAGCGCCCATCGC-3 0 F: 5 0 -GCGGGTGGAGCTGTATCGCC-3 0 R: 5 0 -CTTGGGTTCAGCCGGGCAGG-3 0 F: 5 0 -CAGGTCAAGATCCTGGGAAA-3 0 R: 5 0 -CCCCCACTTCGCAGATATAA-3 0 F: 5 0 -AGGGACTACACTTGGCATGG-3 0 R: 5 0 -TGCAGAAGTAGACGCCAGTG-3 0 F: 5 0 -CCCTGACATCACCTGGAACT-3 0 R: 5 0 -TCACCCCTCTCGTTACCAAC-3 0 F: 5 0 -CGATGGAGGTCAAGGAACAT-3 0 R: 5 0 -CCAGTTTGGACTGGACGAAT-3 0 F: 5 0 -GCAGTCAGAGCTGATGGTGA-3 0 R: 5 0 -GCTACTGCTCCACCTTCTGG-3 0 F: 5 0 -AGTGTGCGATGTGCTCAAAC-3 0 R: 5 0 -AAAAGCAGCTCTGGGTCAAA-3 0 F: 5 0 -CTCTCTTGGCAACCTTCCTG-3 0 R: 5 0 -TTGCACAGTGAGGTCCACTC-3 0 F: 5 0 -CCACAGTGGCAATGAAAATG-3 0 R: 5 0 -AGAAAGTTCTCAGGCCGTCA-3 0 F: 5 0 -GTCTTCCTCTCTCACGCACC-3 0 R: 5 0 -TGGGCTAGAGGCTTGTCACT-3 0 F: 5 0 -GAACAGAAAGGAGGCACTGG-3 0 R: 5 0 -CTCCTGAACTTGGCCTGAAG-3 0 F: 5 0 -CTTCCGCAAGGACCTGGG-3 0 R: 5 0 -CGGGTTGTGCTGGTTGTAC-3 0 F: 5 0 -CCCTCCTCATCGTCTTCAGT-3 0 R: 5 0 -GTCGATGGAGAAGCACATGA-3 0 F: 5 0 -ACTGGGACGACATGGAAAAG-3 0 R: 5 0 -TACATGGCTGGGACATTGAA-3 0 F: 5 0 -CAAGACCGACATGTTCCAGA-3 0 R: 5 0 -CTATGTTGCTGCCCATCTGA-3 0 F: 5 0 -CGGAAGTGAACTCGGATTGT-3 0 R: 5 0 -TCCAAATGCACCTCTACCAA-3 0 F: 5 0 -CTACGGACGGGAATGTGACT-3 0 R: 5 0 -TGTTAAGAAGGCGCAGATGA-3 0 F: 5 0 -CCGTAACTTGCATGTGGATG-3 0 R: 5 0 -GCTGTACATCCGGGACTTGT-3 0 F: 5 0 -GCGTTCTACAGGCCAAGTTC-3 0 R: 5 0 -TCAATTGTGCACTGGTTGGT-3 0 F: 5 0 -TAGTGCGGAGACGGAGAAGT-3 0 R: 5 0 -GGACAGCATCATGGAGGTCT-3 0 F: 5 0 -TGCTCGTCTTCTTCATCTGC-3 0 R: 5 0 -CGTCTTCTGCTCCACGTACA-3 0 F: 5 0 -CCCCAAGTTCAACCACAGAT-3 0 R: 5 0 -CCAGATGCTCTGTCTCCACA-3 0 F: 5 0 -GGGCTTCATACCACCTTGAA-3 0 R: 5 0 -GTGCTCTGGGCCTATCTCTG-3 0 F: 5 0 -AGGCAGGGAGTGTGTGAACT-3 0 R: 5 0 -CGTCGTGGTCTGACAGTTTG-3 0 F: 5 0 -CCTTCCAAGAGACGCAGTTC-3 0 R: 5 0 -AGGAAGCTCGGGGTAGAAAC-3 0
TLR4 CD4 CD8 LACT STAMP2 RAGE COX2 IL8 IL1b TNFa IL6 TGFb1 RhoA aSMA SM22a ROCK1 ROCK2 AR ERa ERb GPR30/GPER1 FXR ROR gt GATA3 Tbet
TLR2, toll-like receptor 2; CD4, T-cell surface glycoprotein cluster of differentiation 4; LACT, lactoferrin; STAMP2, six transmembrane protein of prostate 2; RAGE, receptor for advanced glycation endproducts; COX2, cyclooxygenase isoenzyme 2; IL8, interleukin 8; TNFa, tumor necrosis factor a; TGFb1, transforming growth factor b; RhoA, Ras homolog gene family, member A; aSMA, a-smooth muscle actin; SM22a, transgelin; ROCK1, Rhoassociated coiled coil-containing kinase type 1; AR, androgen receptor; ERa, estrogen receptor a; GPR30/GPER1, G protein-coupled receptor 30/G protein-coupled estrogen receptor 1; FXR, farnesoid X receptor; ROR gt, retinoic acid receptor-related orphan receptor gt; GATA3, GATA-binding protein 3; Tbet, T-box transcription factor 3. www.endocrinology-journals.org
Testosterone prevents MetS-induced prostatitis .
Lecco, Italy), weighing about 3 kg (mean age 15 weeks), were individually caged under standard conditions in a temperature and humidity controlled room on a 12 h light:12 h darkness cycle. Water and food were unrestricted throughout the study. After 1 week of standard rabbit diet, animals were randomly numbered and assigned to different groups: control (nZ22) or treatment group (nZ44). The control group continued to receive a standard diet (Harlan-Global Diet 2030, produced by Mucedola s.r.l, Milan, Italy, constituted by water 12%, protein 16.5%, fiber 15.5%, vegetable fat 3.5%, and carbohydrate 44%), while the treatment group was fed a HFD (enriched by 0.5% animal-derived cholesterol and 4% peanut oil, Mucedola s.r.l), for 12 weeks (HFD rabbits). A first subset of HFD rabbits (nZ13) was supplemented with a pharmacological dose of testosterone (30 mg/kg weekly i.m. for 12 weeks). A second subset of HFD rabbits (nZ14) was treated with a FXR agonist, INT-747 (10 mg/kg body weight (bw), daily for 5 days a week for 12 weeks, by oral gavage). Any treatment (including diets and/or drug administration) was performed by a dedicated technician. Blood samples for glucose, total cholesterol, triglycerides, testosterone, 17b-estradiol (E2), and leptin analyses were obtained via marginal ear vein at time 0 (baseline) and at week 12 in all groups. The blood was immediately centrifuged at 1000 g for 20 min, and collected plasma was stored at K20 8C until assayed. Mean arterial blood pressure was measured by a polyethylene catheter inserted into a femoral artery at week 12, after pentobarbital (45 mg/kg)
L VIGNOZZI
and others 73
sedation as described previously (Filippi et al. 2009, Vignozzi et al. 2011). Shortly afterwards, the rabbits were killed by a lethal dose of pentobarbital. Leukocyte esterase and nitrites have been detected in rabbit urine by semi-quantitative urinary dipsticks (Combur-Test, Roche Diagnostics).
Collection of rabbit prostate Rabbit prostate, seminal vesicles, testis, and visceral fat were obtained and harvested from the different experimental groups and appropriately stored for the subsequent analyses (Filippi et al. 2009, Vignozzi et al. 2011). In particular, immediately after removal, tissue samples were shock frozen in liquid nitrogen and stored at K80 8C until RNA preparation. For immunohistochemistry preparations, tissues were immediately fixed in Bouin’s solution and embedded in paraffin. All the animal experiments were performed in accordance to D.L. 116/92 and approved by the Institutional Animal Care and Use Committee of the University of Florence.
Measurement of cholesterol, triglycerides, glycemia, testosterone, E2, and leptin in rabbits Blood samples were obtained via marginal ear vein at time 0 (baseline) and at week 12 in all groups. Plasma cholesterol, triglycerides, glucose, and testosterone levels were measured after appropriate extraction when needed, as described
Table 2 Metabolic and hormonal parameters in the rabbit model of metabolic syndrome. Results are reported as meanGS.E.M. Control (nZ22) Total body weight (g) Baseline Week 12 Blood glucose (g/l) Baseline Week 12 Cholesterol (mg/dl) Baseline Week 12 Triglycerides (mg/dl) Baseline Week 12 Testosterone (nmol/l) Baseline Week 12 OGTT (AUC; week 12) MAP (mmHg; week 12) Seminal vesicles weight (mg; week 12) Testis weight (g; week 12) Prostate weight (g; week 12) Visceral adipose tissue weight (g; week 12; Percentage of total body weight, %)
3219.70G51.84 3763.00G38.27 1.31G0.03 1.43G0.04
HFD (nZ17) 3250.93G54.65 3678.80G43.69 1.32G0.03 1.96G0.08‡,¶
HFDC testosterone (nZ13) 3260.48G53.81 3807.00G60.36 1.17G0.04 1.61G0.07‡,a
HFDCINT-747 (nZ14) 3378.61G52.10 3614.94G76.93 1.25G0.06 1.41G0.07b
38.14G2.62 44.95G3.74
45.89G2.36 1331.85G59.27‡,¶
45.35G2.39 1251.70G49.37‡,¶
36.78G1.96 1242.06G91.47‡,¶
86.43G4.95 114.20G7.41
88.90G4.39 302.01G31.24‡,¶
94.62G7.32 322.64G27.45‡,¶
76.83G5.67 231.22G36.75†,s
7.00G1.66 6.34G0.84 168.91G6.05 96.12G2.71 803.24G38.61 3.67G0.06 0.57G0.07 34.58G1.83 (0.84G0.04)
9.12G2.07 1.58G0.32‡,¶ 233.48G8.99¶ 135.46G3.72¶ 496.76G29.68¶ 2.99G0.07¶ 0.25G0.02§ 41.94G1.72§ (1.12G0.04)¶
4.17G0.66 15.38G2.86‡,¶,c 191.50G6.24b 111.30G1.80†,c 1375.24G98.35‡,c 1.65G0.06¶,c 0.93G0.06s,c 4.19G0.78¶,c (0.10G0.02)¶,c
9.83G3.36 1.19G0.33†,¶ 194.32G9.75a 129.16G4.35¶ 595.00G57.01 2.41G0.13¶,b 0.28G0.04a 15.23G2.05¶,c (0.41G0.05)¶,c
AUC, incremental area under the curve of glucose blood level during oral glucose tolerance test (OGTT); MAP, mean arterial pressure. †P!0.01, and ‡P!0.001 vs baseline. §P!0.05, sP!0.01, and ¶P!0.001 vs control week 12. aP!0.05, bP!0.01, and cP!0.001 vs HFD week 12. www.endocrinology-journals.org
Journal of Endocrinology (2012) 212, 71–84
L VIGNOZZI
and others . Testosterone prevents MetS-induced prostatitis
(a)
(d)
Control
Control
(b)
(e)
For extraction, samples were mixed with four volumes of diethyl ether for 15 min, centrifuged for 5 min at 400 g, and the aqueous phase frozen in dry ice. The organic phase was recovered, evaporated to dryness under a nitrogen stream, and reconstituted in the assay buffer. Leptin plasma level was measured by an ELISA according to the manufacturer’s instructions (Uscn Life Science, Inc., Wuhan, China).
Oral glucose tolerance test in rabbits *
HFD
HFD
(c)
(f)
Oral glucose tolerance test was performed in accordance with the published method (Filippi et al. 2009, Vignozzi et al. 2011). Briefly, after an overnight fasting a 50% glucose solution was orally administered to the rabbits, at a dose of 1.5 g/kg. Blood samples were collected 15, 30, and 120 min after glucose loading for blood glucose dosage. The incremental area under the curve was calculated by the Graphpad prism Software version 4.0 for Windows, as described previously (Filippi et al. 2009, Vignozzi et al. 2011).
*
HFD
HFD
*
(a)
(b)
(g) CD45 positive staining
74
0·80
***
0·60 0·40 0·20 0·00
Control
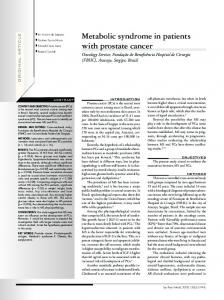
Figure 1 Infiltrating inflammatory CD45-positive cells in prostate sections. Prostate sections stained with CD45 of control (a and d), HFD (b and c, e and f). Upper panels: magnification 20! of sections counterstained with hematoxylin and eosin; lower panels magnification 4! of sections not counterstained with hematoxylin and eosin. A normal prostate gland composed by a luminal epithelium and a thick glandular-adjacent stroma with rare infiltrating CD45-positive inflammatory cells was present in control (a and d). In prostate sections of HFD (b and c, e and f) CD45-round positive cells were extensively present in both interductal stroma and intertwined within the epithelial glands (solid arrow). Numerous CD45-round positive cells were also present within the glandular lumen (*) often associated with corpora amylacea (dashed arrow; b and c) in HFD. Images are representative of three independent experiments. (g) Computer-assisted quantitative image analysis of immunpositive staining after background subtraction in three independent experiments (nZ3 for each group). ***P!0.001 vs control.
previously (Filippi et al. 2009, Vignozzi et al. 2011). Briefly, plasma cholesterol, triglycerides, and glucose levels were measured by an Automated System (ADVIA 2004 Siemens Chemistry System; Siemens Science Medical Solution Diagnostic, Tarrytown, NY, USA). Plasma testosterone and E2 levels were measured by an automated chemiluminescence system (Immulite 2000 Siemens, Siemens Healthcare Diagnostics, Deerfield, IL, USA), after appropriate extraction. Journal of Endocrinology (2012) 212, 71–84
Control
HFD
HFD
(c)
(d)
HFD+testosterone
HFD (e)
HFD+INT-747 Figure 2 Infiltrating cells and corpora amylacea in prostate sections. Prostate sections stained with hematoxylin and eosin of control (a), HFD (b and c), HFDC testosterone (d), and HFDCINT747 (e) rabbits (magnification 4!). A normal prostate gland composed by a luminal epithelium and a thick glandular-adjacent stroma with rare infiltrating inflammatory cells was present in control (a) and testosterone-treated HFD (d) rabbits. Areas of inflammatory cells infiltration (*) within the periacinar stroma and CA (solid arrow) were frequently observed in the prostate of HFD (b and c) and INT-747-treated (e) rabbits. Images are representative of three independent experiments. www.endocrinology-journals.org
Testosterone prevents MetS-induced prostatitis .
Immunohistochemistry Immunohistochemical studies were performed with slight modifications of previously described protocols (Penna et al. 2009). Briefly, prostate sections were incubated overnight at 4 8C or with the monoclonal mouse anti-CD45 (1:100 vol/ vol, DakoCytomation, Copenhagen, Denmark), the antimacrophage antibody RAM11 (Dako, Carpenteria, CA, USA; 1:80 vol/vol), or anti-lactoferrin (1:1000 vol/vol, Sigma) as primary antibodies. Sections were rinsed in PBS, incubated with biotinylated secondary antibody and then with streptavidin– biotin-peroxidase complex (Ultravision large volume detection system anti-polyvalent, Lab Vision, Fremont, CA, USA). Controls for antiserum specificity were performed as described previously (Filippi et al. 2009, Vignozzi et al. 2011). The reaction product was developed with the 3 0 ,3 0 -diaminobenzidine tetrahydrochloride as chromogen (Sigma–Aldrich). The slides were evaluated and photographed using a Nikon MicrophotFXA microscope (Nikon, Tokyo, Japan). Computer-assisted quantification of the staining of CD45 has been made on not hematoxylin and eosin counterstained images and after background subtraction using Adobe Photoshop 6.0 Software (Adobe Systems).
Hypoxia detection in rabbit prostate Tissue oxygenation has been analyzed as described previously (Vignozzi et al. 2006, 2008, 2009, Morelli et al. 2010a). Briefly, 1 h before being killed, rabbits of each experimental group were intraperitoneally injected with the bioreductive drug pimonidazole hydrochloride (Hypoxyprobe-1,
(a)
(b)
Control
and others 75
60 mg/kg). Pimonidazole (hypoxyprobe) is a water soluble substituted 2-nitrominidazole that is rapidly distributed to all tissues in the body, but it only forms adducts with proteins in hypoxic cells, which are at an oxygen pressure equal to or lower than 10 mmHg. Hypoxic cells are thereafter easily detected by immunohistochemistry, using a monoclonal antibody (Hypoxyprobe-1Mab1) that recognizes hypoxyprobe protein adduct (Durand & Raleigh 1998, Bennewith et al. 2002); Pimonidazole as a probe for the in vivo detection of hypoxia has been validated previously (Arteel et al. 1995, Vignozzi et al. 2006, 2008, 2009, Bouchentouf et al. 2008, Via et al. 2008, Morelli et al. 2010a). Rabbit ventral prostate samples were rapidly removed and fixed in 4% neutral buffered formalin, dehydrated, and embedded in paraffin. Immunohistochemical studies were performed on deparaffinized and rehydrated sections, according to the manufacturer’s instructions. Briefly, slides were exposed to hypoxyprobe-1Mab1 (diluted 1:50) for 40 min at room temperature, rinsed in PBS and 0.2% Brij 35 for seven times at 0 8C, incubated with a biotinylated secondary antibody, and finally were incubated with streptavidin–biotin-peroxidase complex (Lab Vision Corporation). The reaction product was developed with the 3 0 ,30 -diaminobenzidine tetrahydrochloride as chromogen (Sigma–Aldrich) and photographed using a Nikon Microphot-FXA microscope (Nikon). Computerassisted quantification of the staining has been made after background subtraction using Adobe Photoshop 6.0 Software (Adobe Systems). Some tissue sections were stained with hematoxylin and eosin or with Masson’s trichrome (Bio-Optica, Milan, Italy) as described previously (Vignozzi
(c)
HFD
L VIGNOZZI
(d)
HFD+testosterone
HFD+INT-747
Figure 3 Immunostaining for lactoferrin and RAM11 in rabbit prostate. Upper panels (magnification 10!): immunohistochemical analysis of prostate sections stained with lactoferrin. Control (a) and testosterone-treated HFD (c) show only scanty positivity for lactoferrin within the stroma (solid arrow) while HFD (b) and INT-747-treated (d) rabbits show an intense staining in both CA (dashed arrow) and stroma (solid arrow). CA staining was positive for lactoferrin with areas of dense staining and concentric rings that do not stain positive. Lower panels (magnification 10!): immunohistochemical analysis of prostate sections stained with RAM11 and hematoxylin counterstained. Control (a) and testosterone-treated HFD (c) are almost unstained, while HFD (b) and INT-747-treated (d) rabbits show intense staining in stromal compartments (arrows). Images are representative of three independent experiments. www.endocrinology-journals.org
Journal of Endocrinology (2012) 212, 71–84
L VIGNOZZI
and others . Testosterone prevents MetS-induced prostatitis
(a)
(b)
Control
HFD
(c)
(d)
HFD+ testosterone
HFD+INT-747 (e) Smooth muscle/fiber
2·00
performed by SYBR Green Real-time PCR Master Mix (Applied Biosystems) with the following thermal cycler conditions: 40 cycles at 95 8C for 30 s and 60 8C for 1 min followed by dissociation curve analysis to verify the primer specificity. Specific primers were designed on rabbit sequences available at NCBI GenBank (http://www.ncbi. nlm.nih.gov) or Ensemble Genome (http://www.ensembl. org), or based on homology to the human sequence. The primer sequences used are reported in Table 1. Amplification and detection were performed with the ABI Prism 7900HT Fast Real-time PCR System (Applied Biosystems). The expression of 18S rRNA subunit, chosen as reference gene, was quantified with a predeveloped assay (Applied Biosystems) and used for normalization and relative quantitation of the target genes. The analysis of the results was based on the comparative cycle threshold method according to the manufacturer’s instructions (Applied Biosystems), as described previously (Filippi et al. 2009, Vignozzi et al. 2011).
˚˚˚
1·50 ***
1·00
(a)
(b)
Control
HFD
(c)
(d)
HFD+testosterone
HFD+INT-747
H ste FD ro + ne IN HF T- D+ 74 7
l ro
te
sto
H
nt
FD
0·50 Co
Figure 4 Testosterone treatment inhibits fibrosis in HFD rabbit prostate sections. Smooth muscle fibers are stained in red and collagen fibers in blue by Masson’s trichrome staining (magnification 10!). (a) Control rabbits: smooth muscle cells are prevalent in the periacinar stromal layer (arrows). (b) HFD rabbits: a clear increase in collagen fibers is present in the stromal space. (c) HFDC testosterone rabbits: smooth muscle loss is essentially prevented and fibrosis limited. (d) HFDCINT-747 rabbits: HFDinduced increase in collagen fibers was not prevented by INT-747 treatment. (e) Computer-assisted quantitative image analysis of three independent experiments (nZ3 for each group). ***P!0.001 vs control and 888P!0.001 vs HFD.
et al. 2006). The images were imported into Adobe Photoshop 6.0 Software (Adobe Systems) and then split into their red, green, and blue staining components by selecting RGB color feature of Adobe Photoshop 6.0 Software. To measure the red (smooth muscle fibers) and blue (collagen fibers) staining components of the interductal stroma, the epithelial layer was omitted from the analysis by the computer-assisted manual delineation of regions of interest. Histograms of the individual components of the RGB images were then calculated and reported as red/blue ratio.
RNA extraction and quantitative RT-PCR analysis Isolation of RNA from frozen rabbit tissues was performed by Trizol reagents according to the manufacturer’s instructions (Invitrogen S.r.l). cDNA synthesis was carried out using the RT kit purchased from Applied Biosystems (Foster City, CA, USA), as described previously (Filippi et al. 2009, Vignozzi et al. 2011). Quantitative RT-PCR (qRT-PCR) was Journal of Endocrinology (2012) 212, 71–84
(e) Hypoxyprobe positivity (% of control)
76
450 400 350 300 250 200 150 100 50 0
***
˚˚˚ ol
ntr
Co
D+ D+ HF one HF 747 Tter s N o I st
D
HF
te
Figure 5 Testosterone treatment inhibits hypoxia in HFD rabbit prostate. Hypoxyprobe adducts were revealed in hypoxic cells (PO2 !10 mmHg) of prostate transverse sections by a monoclonal antibody (magnification 4!). (a) Control rabbits: only scanty positive labeling is present. (b) HFD rabbits: massive hypoxia is present in both the epithelium and stroma. (c) Testosterone-treated HFD rabbits: hypoxyprobe labeling is markedly decreased. (d) INT747-treated rabbits a severe hypoxia is present in both the epithelial and stromal compartments. (e) Computer-assisted quantitative image analysis of three independent experiments (nZ3 for each group). Control optical density was taken as 100%. ***P!0.001 vs control and 888P!0.001 vs HFD. www.endocrinology-journals.org
Testosterone prevents MetS-induced prostatitis .
Statistical analysis
L VIGNOZZI
and others 77
preliminary investigation, leptin levels were not different in MetS (44.91G2.8, nZ10) compared with control rabbit (44.79G2.7, nZ8, PZ0.93). Figure 1 (CD45 staining) and Fig. 2 (hematoxylin–eosin) show the effect of HFD-associated MetS on prostate histology. CD45-round positive cells were extensively present in both interductal stroma and intertwined within the epithelial glands. Numerous CD45-round positive cells were also present within the glandular lumen often associated with corpora amylacea (see below). Computer-assisted image analysis indicated a highly positive increase in CD45 staining in MetS rabbits (P!0.0001). Overt hypogonadism was induced by HFD-associated MetS, and characterized by low testosterone along with prostate, seminal vesicle, and testis hypotrophy (see Table 2).
Statistical analysis was performed with one-way ANOVA test followed by Tukey–Kramer post-hoc analysis, and P!0.05 was considered significant. Maximal inhibitory effect (Imax) and half-maximal response inhibiting concentration (IC50) values were calculated using the computer program ALLFIT (De Lean et al. 1978). The same program was used to statistically analyze differences in sigmoidal dose-response curves. Correlations were assessed by the Spearman’s method and statistical analysis was performed on Statistical Package for the Social Sciences (SPSS; SPSS, Inc., Chicago, IL, USA) for Windows 15.0.
Results Characterization of HFD-induced MetS features and histological prostate correlates
Effect of HFD and hormonal supplementation on MetS and prostate histological features
Biochemical and physical effects of feeding rabbits a HFD for 12 weeks are reported in Table 2. HFD induced a significant increase in mean arterial pressure, lipids, visceral fat, and glucose intolerance, as demonstrated by the area under the curve of the oral glucose tolerance test. Conversely, body weight was not affected (Table 2). Accordingly, in a
In HFD rabbits, testosterone supplementation not only restored testosterone plasma levels and prostate and seminal vesicles weight, but also normalized fasting glucose, glucose tolerance, and dramatically decreased visceral fat (Table 2). HFD-induced dyslipidemia was not affected by testosterone treatment, while mean arterial pressure was reduced (Table 2).
TLR4/18S
47
ne
T7
ro ste
H
nt
FD
H
+t
FD
es
+I
to
Co
N
l
FD
ro
47
ne
T7 N
ste
+I
to
FD
es
H
+I
to s
N
te r
T74 7
on e
FD H
H
H
FD
H
FD
+t es
7 FD
es
+I N
to ste
T74
ro ne
FD H
+t H
FD
H
TNFα/18S *** °
IL6/18S
10 000
**
1000
°
100
T74 7
e
+I FD H
+t H
FD
N
ste
ro n
FD
l nt ro
H
es to
N +I H
FD
Co
T74 7
e ste to es
+t FD H
FD
H
ro n
FD H
l ro Co nt
7
10
+I
N
T74
ne ro
H H
FD
+t
es to ste
FD
l
FD H
°
100
10 ro
T7 +I N
ste to es
+t
COX2/18S 1000
100
Co nt
47
e ro n
FD H FD
H
+t FD H Co
nt ro l
T74 7 N
+I FD
es +t FD H
°
10
H
ro
FD H
ro nt Co
N ne ro
FD
to ste
H
nt ro l
FD H
+t FD H
°°
10
1000
*
100
10 l
RAGE/18S ** °°
IL1β/18S
°
100
ro
l
47
ne
T7
ro
+I
es
FD H
+t FD
10
1000
*
100 10
H
10
+I
N
100
IL8/18S **
1000
Co nt
°°°
1000
100
Co
T74 7
ne ro
es
to ste
H
FD
10 nt ro l
FD to
Co
nt
ro
47
FD
es
H
+t FD H
°
100
1000
100
STAMP2/18S *** °
1000
1000
Co
°°
CD8/18S
*
10
+I
to
N
ste
T7
ro
ne
FD
ro
H
nt Co
LACTF/18S *
10 000
CD4/18S 1000
ste
10 l
10 l
100
H
*
100
***
nt ro l
1000
Co
TLR2/18S 1000
Figure 6 Testosterone treatment inhibits expression of inflammatory markers in rabbit prostate. Relative mRNA expression of inflammatory markers was evaluated using quantitative RT-PCR in prostate sample from control (nZ13), HFD (nZ9), HFDC testosterone (nZ9), and HFDCINT-747 (nZ11). Data were calculated according to comparative Ct method by rRNA subunit 18S as the reference gene for normalization. Results are expressed in percentage over control and are reported as meanGS.E.M. on a logarithmic scale graph. *P!0.05, **P!0.01, and ***P!0.001 vs control and 8P!0.05, 88P!0.01, and 888P!0.001 vs HFD. www.endocrinology-journals.org
Journal of Endocrinology (2012) 212, 71–84
78
L VIGNOZZI
100
and others . Testosterone prevents MetS-induced prostatitis Tbet/18S
GATA3/18S *
1 000 000
°
*
10 *
* 1
100 000
° 10 000
0
Prostate oxygenation was also examined (Fig. 5). In control rabbits, only scanty cells reacted with the hypoxyprobe (Fig. 5a). HFD dramatically increased immunopositivity in the epithelium and in fibromuscular stroma (Fig. 5b). Testosterone, but not INT-747, supplementation almost completely prevented hypoxygenation (Fig. 5c and d). Image analysis is in Fig. 5e.
1000 RORγt/18S
10 000
*
1000
mRNA expression of inflammatory and fibrosis/myofibroblast markers in the prostate °
*
100
10
Control
HFD
HFD+ HFD+ testosterone INT-747
Figure 7 Testosterone treatment modulates expression of T cell lineage-determining transcription factors in rabbit prostate. The mRNA expression of transcription factors Tbet, GATA3, and ROR gt was evaluated using quantitative RT-PCR in prostate sample from control (nZ9), HFD (nZ8), HFDC testosterone (nZ9), and HFDC INT-747 (nZ8). Data were calculated according to comparative Ct method by rRNA subunit 18S as the reference gene for normalization. Results are expressed in percentage over control and are reported as meanGS.E.M. on an arithmetic scale graph. *P!0.05 vs control and 8P!0.05 vs HFD.
Similarly, dosing INT-747 significantly ameliorated several MetS features (see Table 2). No leukocyte esterase and nitrites were detected in urine, suggesting no urinary infections (not shown). Hematoxylin–eosin staining of prostate from HFD confirms a diffuse inflammatory cell infiltration, localized in the interductal stroma, and glandular epithelial cells with the presence of corpora amylacea (CA), within the acinar lumen (Fig. 2b and c). In contrast, prostate from both HFDC testosterone (Fig. 2d) and controls (Fig. 2a) showed no alterations. INT-747 did not prevent these HFD-induced abnormalities (Fig. 2e). To better study inflammatory prostate infiltrates, we immunostained for the neutrophil marker lactoferrin and the macrophage marker RAM11 (Fig. 3). CA stained very strongly for lactoferrin, showing an unstained ring structure, as expected (Sfanos et al. 2009). Prostate from control and HFDC testosterone showed scanty positivity for lactoferrin (Fig. 3, upper panels). Anti-macrophage specific antibody RAM11 revealed a predominant staining within the prostatic interductal stroma of the HFD and HFDCINT-747 groups. In the HFDC testosterone, a reduced macrophage infiltration was observed (Fig. 3, lower panels). Figure 4a–d shows Masson’s trichrome staining, to evaluate fibrosis. Histomorphometric analysis (Fig. 4e) indicated that the muscle/fiber ratio was reduced by HFD (P!0.001 vs control) and was completely rescued by testosterone (1.4G 0.7, P!0.001 vs HFD, and PZ0.06 vs control). Conversely, HFDCINT-747 did not affect fibrosis. Journal of Endocrinology (2012) 212, 71–84
Using qRT-PCR, we observed a marked upregulation of inflammatory markers in prostate from HFD (Fig. 6). HFD induced an increase of testosterone lymphocyte (CD4 and CD8), neutrophil (lactoferrin), antigen presenting cells, leukocytes, regulatory testosterone lymphocyte (toll-like receptor 2 (TLR2), TLR4, six transmembrane protein of prostate 2 (STAMP2)), and inflammation (cyclooxygenase-2, receptor for advanced glycation endproducts (RAGE)) markers as well as IL8, IL1b, IL6, and tumor necrosis factor a (TNFa; Fig. 6). To characterize CD4CT lymphocyte subsets, expression of specific transcription factors namely
RhoA/18S
TGFβ1/18S 300 250 200 150 100 50 0
∗∗ °°
Control
HFD
∗
°° Control
300 250 200 150 100 50 0
HFD
Control
HFD+ HFD+ testosterone INT-747
αSMA/18S 300 250 200 150 100 50 0
∗∗∗
300 250 200 150 100 50 0
°° Control
ROCK1/18S ∗∗ °
Control
HFD
HFD+ HFD+ testosterone INT-747
HFD+ HFD+ testosterone INT-747
SM22α/18S
300 250 200 150 100 50 0
HFD+ HFD+ testosterone INT-747
HFD
HFD
HFD+ HFD+ testosterone INT-747
ROCK2/18S 300 250 200 150 100 50 0
∗∗ °°
Control
HFD
HFD+ HFD+ testosterone INT-747
Figure 8 Testosterone treatment inhibits expression of fibrosis and myofibroblast transdifferentiation markers in rabbit prostate. Relative mRNA expression of fibrosis and myofibroblast transdifferentiation markers was evaluated using quantitative RT-PCR in prostate sample from control (nZ15), HFD (nZ9), HFDC testosterone (nZ9), and HFDCINT-747 (nZ11). Data were calculated according to comparative Ct method by rRNA subunit 18S as the reference gene for normalization. Results are expressed in percentage over control and are reported as meanGS.E.M. on a logarithmic scale graph. *P!0.05, **P!0.01, and ***P!0.001 vs control and 8P!0.05 and 88P!0.01 vs HFD. www.endocrinology-journals.org
Testosterone prevents MetS-induced prostatitis . (b)
(a) 1 000 000 100 000 10 000 1000 100 10 0
AR/18S
700 600 500 400 300 200 100 0 FXR
AR
(c)
ERα
ERβ
l tro
n
Co
D+ HFrone e ost
FD
H
t
tes
(e)
ol
ntr
D+ HFrone e ost t s te
D
HF
∗∗∗ °°° l tro
n
Co
D+ D+ HFrone HF-747 T te s N o I st
FD
H
te
GPR30/18S
350 300 250 200 150 100 50 0
D+ HF-747 T IN
HFD+ HFD+ testosterone INT-747
ERα/18S
700 600 500 400 300 200 100 0
(f)
∗∗∗
Co
Control HFD
I
ERβ/18S 350 300 250 200 150 100 50 0
°
(d)
D+ HF-747 NT
∗∗∗ °° ol
ntr
Co
D+ D+ HFrone HF-747 e T ost IN t s te D
HF
Figure 9 Relative mRNA expression of sex steroid receptors and FXR in rabbit prostate. The mRNA expression of sex steroid receptors and FXR was evaluated using quantitative RT-PCR in the rabbit (a; nZ15) prostate. Results are expressed as arbitrary units after normalization over 18S rRNA subunit by the comparative Ct method and are reported as meanGS.E.M. on a logarithmic scale graph. The AR (b), FXR (c), ERa (d), and ERb (e) mRNA expression in prostate sample from control (nZ13), HFD (nZ9), HFDC testosterone (nZ9), and HFDCINT-747 (nZ11) are also reported. Results are expressed in percentage over control and are reported as meanGS.E.M. on an arithmetic scale graph. ***P!0.001 vs control and 8P!0.05, 88P!0.01 and 888P!0.001 vs HFD vs HFD.
T-box transcription factor 3 (Tbet), retinoic acid receptorrelated orphan receptor gt (ROR gt) and GATA-binding protein 3 (GATA3; markers for T helper type 1 (Th1), Th17, and Th2 respectively). In control rabbits, a constitutive high expression of GATA3 and ROR gt was detected, whilst Tbet was absent. HFD increased GATA3 and ROR gt and induced Tbet (Fig. 7). Testosterone, but not INT-747, treatment prevented all these changes (Figs 6 and 7). As shown in Fig. 8, HFD upregulated the expression of fibrosis and myofibroblast activation markers, including transforming growth factor b (TGFb1), a-smooth muscle actin (aSMA), Ras homolog gene family, member A (RhoA), Rho-associated coiled coil-containing kinase type 1 (ROCK1), and type 2 (ROCK2). This induction was prevented by testosterone, but not by INT-747, treatment (Fig. 8).
Sex steroid receptors and FXR expression Figure 9a shows the mRNA expression of sex steroid receptors and FXR in rabbit prostate. Androgen receptor (AR) showed the highest, and FXR the lowest expression. HFD increased mRNA expression of AR, estrogen receptor a (ERa), ERb, and GPR30 (Fig. 9b–f). AR, ERa, and www.endocrinology-journals.org
and others 79
GPR30 induction was completely counteracted by testosterone, but not by INT-747, treatment. In contrast, FXR gene expression was not affected by any treatment (Fig. 9c).
∗∗∗
GPR30
FXR/18S 250 200 150 100 50 0
L VIGNOZZI
Sex steroid plasma levels and their association with fibrosis/myofibroblast and inflammation markers Figure 10 shows E2 (Fig. 10a) along with the testosterone (see Table 2)/E2 ratio (Fig. 10b) as derived from immunoassays, after diethyl ether extraction. MetS was associated with a fall in testosterone and a rise in E2, which were restored by testosterone dosing. INT-747 normalized estrogen, but not androgen level (see Fig. 10a, Table 2). Accordingly, testosterone/E2 ratio was normalized but testosterone but not INT-747 treatment (Fig. 10b). Visceral adiposity was negatively associated with plasma levels of testosterone (rZK0.317, nZ119, P!0.0001, not shown), testosterone/ E2 ratio (rZK0.277, nZ116, P!0.01, see also Fig. 10c), and positively with E2 (0.256, nZ116, P!0.01, not shown). Testosterone/E2 ratio was negatively associated with all the aforementioned markers of fibrosis (see Fig. 10d–i) and several of inflammation (Table 3).
Discussion This study demonstrates that HFD-induced MetS is associated with hypogonadism and a prostatitis-like syndrome, characterized by prostatic inflammation, hypoxia, and fibrosis. All these features are markedly counteracted by testosterone supplementation. Hence, testosterone prevents (and not induces) prostatic diseases. Recently, we have established a non-genomic model of MetS, by exposing rabbits to an HFD for 12 weeks. HFD induces hyperglycemia, glucose intolerance, hypercholesterolemia, hypertriglyceridemia, hypertension, and increased visceral fat mass along with hypogonadotropic hypogonadism (Filippi et al. 2009, Vignozzi et al. 2011). Hence, HFD in rabbits recapitulates the clinical phenotype of human male MetS. In this study, we report an additional novel feature of HFD-induced MetS in rabbits: a prostatitis-like inflammation. The inflammation was characterized by infiltration of inflammatory cells and formation of corpora amylacea. Corpora amylacea are protein aggregates of lactoferrin (Sfanos et al. 2009), delivered by neutrophils following acute prostate inflammation (Legrand et al. 2005, Sfanos et al. 2009). As expected (De Marzo et al. 2007, Sfanos et al. 2009, Yanamandra et al. 2009), we have observed corpora amylacea adjacent to infiltrating inflammatory cells. Gene expression of macrophage, neutrophil, and CD4C and CD8CT lymphocyte markers were increased by HFD. The increased expression of TLR2, TLR4 mRNA – widely distributed not only in immune but also in non-professional antigen presenting cells, such as stromal prostatic cells (Fibbi et al. 2010) – suggests the activation of both innate and specific immune responses. Recent studies have shown that Journal of Endocrinology (2012) 212, 71–84
(b)
300
∗
∗° °
°
150
–1·5
100
60·00 40·00 20·00
50 0·00
–2·5 HFD
Control
Control
HFD HFD+ testosterone INT-747
(e)
500·00
r=–0·59 P