Aust. Met. Mag. 49 (2000)181-200
Subtropical fronts observed during the 1996 Central Australian Fronts Experiment Michael J. Reeder Department of Mathematics and Statistics, Monash University, Australia Roger K. Smith Meteorological Institute, University of Munich, Germany Roger Deslandes Bureau of Meteorology Training Centre, Australia
Nigel J. Tapper School of Geography and Environmental Science, Monash University, Australia and Graham A. Mills Bureau of Meteorology Research Centre, Australia
(Manuscript received January 2000; revised May 2000)
The 1996 Central Australian Fronts Experiment (CAFE96) was the third in a series of field experiments designed to better understand the structure and dynamics of late dry-season subtropical cold fronts that affect central Australia. In this paper, the behaviour of three fronts observed during CAFE96 are described in detail and the four other fronts that occurred are examined in the light of previous studies. In total, fourteen fronts were documented during the three field experiments, of which twelve crossed central Australia during the evening or early hours of the morning. Only one of the fourteen crossed central Australia during the late afternoon (Event 4 in CAFE96), and only one in the mid-morning (Event 6 in CAFE96). The latter front arrived at Alice Springs during the mid-morning and, as the daytime turbulent mixing increased, it ceased advancing northeastward and retrogressed. It subsequently retreated through Alice Springs, giving way to strong northwesterly winds and blowing dust. The front reversed direction once again and was observed at a station 70 km southeast of Alice Springs during the mid-afternoon. While it is probably quite common for the position of subtropical cold fronts to oscillate back and forth as the daytime turbulent mixing waxes and wanes, Event 6 is the first example to be documented in detail. Event 3 is more typical of the fronts observed in the two previous experiments, but is discussed briefly here because it is the best example to date exhibiting near-surface warming in a strip following the passage of the cold front. This warming was detected in satellite imagery and confirmed by surface measurements.
Introduction
Cold fronts frequently migrate equatorwards across Australia, penetrating deep into the subtropics. They Corresponding author address: M.J. Reeder, Department of Mathematics and Statistics, Monash University, Clayton, Vic. 3800, Australia. Email:
[email protected]
181
regularly reach as far north as the Gulf of Carpentaria (around 17°S), and occasionally push northward of Darwin (12°S). (The locations of places named in the text are shown in Fig. 1.) The synoptic environment of these fronts is similar to that of the summertime cool change of southeastern Australia (Reeder and
182
Smith 1992), with fronts forming normally in the trough region between the two subtropical anticyclones relatively far from the centre of the parent cyclone. One important difference is that the frontal passage is invariably accompanied by strong ridging from the west and the horizontal deformation flow that accompanies the ridge plays a central role in the re-intensification of the front in the subtropics (Deslandes et al. 1999). The frontal trough eventually merges with the heat troughs over northern Western Australia and northwestern Queensland (see Rácz and Smith (1999) and references therein). Frontal passages across the centre of Australia are most common during the dry season. They become less common as the continent warms, and the mean subtropical ridge axis and mid-latitude westerlies migrate polewards. At times the front is associated with a deep baroclinic disturbance. Fronts such as these have strong upper-level signatures and are most common in the mid dry season. Griffiths et al. (1998) have examined a cutoff low that developed over the ocean south of Australia and subsequently interacted with a deep subtropical frontal system over the central part of the continent. Throughout the life of the system the strongest temperature gradients lay through the subtropics. In this case, the subtropical temperature gradients strengthened while the mid-latitude temperature gradients associated with the cut-off low weakened. In the latter part of the dry season, subtropical cold fronts are generally shallow, typically no more than about 1 km deep, and they advance through a convectively well-mixed boundary layer which is normally 3-4 km deep. The fronts are often unmarked by cloud and rarely produce precipitation, although they may give rise to dust storms. However, as the wet season approaches these fronts frequently trigger deep convection as they approach the northern and eastern coastlines. Because of the coarse resolution of the routine observational network over Australia, specially designed field programs are the only way to adequately document the morphology of synoptic and mesoscale weather systems in the region. Accordingly, a series of field experiments has been carried out to investigate the structure and evolution of subtropical cold fronts during the late dry season. The first, in September 1988, was a small-scale pilot experiment conducted in the Mount Isa region, the results of which were reported by Smith and Ridley (1990). We refer to this experiment as pre-CAFE. Prior to preCAFE, Australian subtropical fronts had received little attention from researchers. The Central Australian Fronts Experiment took place in 1991 and is described by Smith et al. (1995) and Deslandes et al. (1999); here we refer to this experiment as CAFE91. In partic-
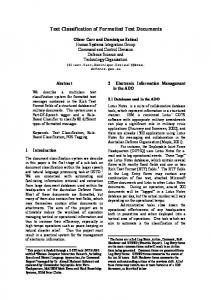
Australian Meteorological Magazine 49:3 September 2000 Fig. 1
Map of northern Australia indicating places named in the text and the locations of the automatic weather stations and the energy balance stations.
ular, CAFE91 documented the large diurnal variation of frontal structure associated with solar heating. The fronts weaken greatly during the late morning and afternoon when convective mixing is most vigorous, and generally stall or even retreat. However, they redevelop and accelerate in the evening as the dry boundary-layer convection subsides and a surfacebased radiation inversion forms. The previous observations together with those described here indicate that during the dry season, subtropical cold fronts almost always generate largeamplitude internal bore waves in the early hours of the morning (Smith et al. 1986; Smith et al. 1995; Reeder et al. 1995; Reeder and Christie 1998). These waves propagate on the shallow radiation inversion that forms at the surface overnight and are at least partially trapped by the deep well-mixed layer above. Wind squalls, intense low-altitude wind shear and a sharp pressure jump at the surface commonly accompany the passage of the waves. The bore waves dissipate shortly after sunrise when convective mixing destroys the nocturnal inversion. It appears that the disturbances are generated by enhanced nocturnal convergence associated with the cold front/trough system. At times the crests of these waves are marked by spectacular roll clouds known as morning glories. Those generated by subtropical fronts generally propagate from the south
Reeder et al.: Subtropical fronts observed in central Australia
and we refer to them as southerly morning glories. Reviews and bibliographies of the morning glory can be found in Smith (1988), Christie (1992) and Reeder and Smith (1998). The present study is based on observations taken as part of the Central Australian Fronts Experiment (CAFE96), a field experiment carried out mainly in the region between Giles (Western Australia) and Mount Isa (Queensland) from 31 August until 5 October 1996. The experiment was organised jointly by Monash University, the Australian National University, the University of New South Wales and the University of Munich, with collaborative support of the Bureau of Meteorology’s Northern Territory Regional Office. It was the third in a series of field experiments that are part of a longer term project to understand the behaviour of subtropical continental cold fronts and builds on the work of Smith and Ridley (1990), Smith et al. (1995) and Deslandes et al. (1999). The principal aim of CAFE96 was to investigate the structure and dynamics of subtropical cold fronts that affect central Australia. The present study synthesises the special observations taken during CAFE96 and diagnostic analyses from the Australian Bureau of Meteorology’s Limited Area Prediction System (LAPS), and is arranged as follows. The data obtained during the experiment and LAPS assimilated analyses are described briefly in the next section. The summary of events provides an overview of all the fronts observed, including a summary of the surface energy balance accompanying their passage. Three particular frontal systems, Events 3, 4 and 6, are examined in some detail. Events 4 and 6 are emphasised for three reasons. First, both events showed strong daytime signatures and, in this respect, their evolution was different from the other subtropical fronts documented in pre-CAFE, CAFE91 and CAFE96. Second, Event 6 showed a very marked change in strength and direction of propagation which, we argue, is related directly to the diurnal heating cycle. Third, Event 6 appeared to decay near Alice Springs, but re-developed two days later over northeastern Australia as a strong ridge built across the continent. Event 3 is more typical of the fronts observed in the two previous experiments, but is discussed briefly here because it is the best example to date exhibiting near-surface warming in a strip following the passage of the cold front. This warming was detected in satellite imagery and confirmed by surface measurements.
Data and analyses
Special observations Figure 1 shows the area of the field experiment and the places referred to in the text. The operations cen-
183
tre was located at the Bureau of Meteorology Forecasting Office in Alice Springs, where there is also a routine upper-air station. As in the CAFE91 experiment, a network of surface measuring stations was installed in the normally data-void region between Alice Springs and Mount Isa, and between Mount Isa and Burketown. However, the number of surface stations was more than doubled, with a higher density of stations near Alice Springs and more stations recording temperature, humidity and wind between Mount Isa and the southern Gulf of Carpentaria. Specifically, an array of fifteen automated stations recording wind speed, wind direction, temperature, wet-bulb temperature and pressure was established at the sites listed in Table 1 and marked on Fig. 1. In addition, measurements of surface radiative, sensible, evaporative and soil heat fluxes were made throughout the period of the field experiment at both Alice Springs and Mount Isa. As a check on the consistency of the results, Bowen ratio and eddy correlation techniques were used in flux determination at each of the two sites. Table 1. Location of the automatic weather stations. AWS site
Aileron Alice Springs Camooweal Curtin Springs Dajarra Gregory Downs Maryvale Mt Ebenezer Narwietooma Ringwood Santa Teresa Tarlton Downs Tobermorey Urandangi Waite River
Latitude 22.4°S 23.8°S 19.9°S 25.2°S 21.7°S 18.6°S 24.4°S 25.1°S 23.1°S 23.5°S 24.1°S 22.4°S 22.3°S 21.6°S 22.3°S
Longitude 133.2°E 133.9°E 138.1°E 131.5°E 139.5°E 139.2°E 134.0°E 132.4°E 132.4°E 134.6°E 134.2°E 136.5°E 138.0°E 138.3°E 134.3°E
Assimilated analyses LAPS is the Bureau of Meteorology’s operational limited area numerical weather prediction model. It is described in detail by Puri et al. (1998), and is an important component of the present study. LAPS has two parts: a forecast model and an objective analysis scheme. The forecast model is based on a finite-difference form of the hydrostatic primitive equations, and has a horizontal resolution of 0.75º. Terrain-following coordinates are used in the vertical with 19 sigma levels. LAPS includes a prognostic equation for the surface temperature, as well as parametrisa-
184
tions of the boundary-layer physics, large-scale and convective precipitation, and radiation. Observations are assimilated every six hours by LAPS. These data include surface synoptic measurements, ship and drifting-buoy reports, radiosonde and upper-level wind observations, satellite sounding data from the TIROS Operational Vertical Sounder (TOVS), Geostationary Meteorological Satellite (GMS) clouddrift winds, and single-level winds from aircraft reports. Note, however, that the special observations taken during CAFE96 were not used in constructing the LAPS analyses considered later.
Summary of the events
Seven subtropical fronts were observed during CAFE96 and the time at which each front arrived at Alice Springs is recorded in Table 2. For reference, Eastern Standard Time (EST) = UTC + 10 hours, and Central Standard Time (CST) = UTC + 9.5 hours. Although the Northern Territory uses CST, the observations reported throughout this study are referred to EST. This avoids artificial jumps in the frontal position as it crosses from one time zone to the next. Table 2 shows that four fronts arrived within an hour and a half of midnight, while the other three arrived between 0930 and 1010 EST (i.e. between 0900 and 0940 CST). The time at which the fronts arrived at each automatic weather station is summarised in Fig. 2. The most striking feature of this figure is that the fronts mostly crossed the observational network overnight between 1800 EST (1730 CST) and 1030 EST (1000 CST) on the following day. Only Event 6 crossed the observational network during the late morning and early afternoon, and only Event 4 during late afternoon. These observations are in line with the experience of the Bureau of Meteorology forecasters and are consistent with the observations made during CAFE91 and pre-CAFE. In total, 14 fronts have been documented in detail during CAFE96, CAFE91 and pre-CAFE, and only Events 4 and 6 were detected during the late morning or afternoon. This is, of course, the period in which convectively driven boundary-layer turbulence is at its peak. Unlike most of the 14 fronts studied, Events 4 and 6 were accompanied by severe weather over eastern Australia. There appear to be two physical mechanisms, both related to turbulent mixing, that cause subtropical cold fronts to weaken and stall during the day. First, the height of the daytime mixed layer in the cold air is lower than that in the warm air. As the cross-front sensible heat flux is almost homogeneous (see below), the mixed layer on the cold side of the front
Australian Meteorological Magazine 49:3 September 2000 Table 2. The time at which each front arrived at Alice Springs. Event 1 2 3 4 5 6 7
Fig. 2
Time and Date (EST) 2330 (2300 CST) 0100 (0030 CST) 2330 (2300 CST) 1000 (0930 CST) 0930 (0900 CST) 1010 (0940 CST) 2300 (2230 CST)
1 September 5 September 11 September 19 September 23 September 28 September 5 October
The local time at which the subtropical front arrived at each of the automatic weather stations in each of the events.
warms more quickly than the mixed layer on the warm side of the front. Consequently, the cross-front temperature gradient weakens during the day. Second, the leading edge of the front is generally much shallower than the depth of the daytime mixed layer and the depth of the cold air increases to the south of the front. Hence, the nose of the front is eroded by progressively deeper turbulent mixing in the vertical, and the boundary between the warm and cold air retreats southward as the daytime heating proceeds and the depth of the mixing increases. The overnight re-intensification of subtropical cold fronts appears to be related to the way in which the boundary layer adjusts to rapid changes in the turbulent stress. During the day, the winds in the boundary layer are generally sub-geostrophic because of the stress associated with turbulent mixing. At night, once
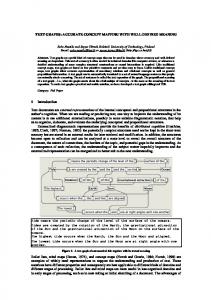
Reeder et al.: Subtropical fronts observed in central Australia Fig. 3
185
Time-height section of equivalent potential temperature θe at Alice Springs during August and September 1996. The section is constructed from the 2300 UTC (0900 EST) radiosonde sounding. The ticks along the abscissa mark each of the radiosonde soundings. Events 1-6 are marked. Height in km is marked along the ordinate.
the (buoyantly generated) turbulent mixing subsides, the balance of forces in the boundary layer is rapidly altered. In response, air parcels accelerate down the pressure gradient towards the trough, locally strengthening the low-level flow and increasing the convergence and deformation. This large-scale pattern of deformation acts to re-establish the cross-front temperature gradient and increase the cross-frontal circulation. Strong post-frontal ridging always accompanies this strengthening. Such rapid boundary-layer adjustments commonly generate bore waves that propagate on the nocturnal inversion, although the precise generation mechanisms are unclear. Figure 3 shows a time-height section of equivalent potential temperature* at Alice Springs from 2 August to 30 September 1996. The figure is constructed from daily 2300 UTC (0830 CST) radiosonde soundings. Frontal passages are characterised by strong falls in the equivalent potential temperature. During August (the month before CAFE96) the equivalent potential temperature perturbations associated with the fronts are around 8 km deep and at upper levels the moist isentropes descend. In September, however, the perturbations are much shallower and have little upper-level signature. Ahead of each front, the equivalent potential temperature is well mixed below about 4 km and the * More precisely, Fig. 3 shows the pseudo-equivalent potential temperature. A pseudo-adiabatic process is one in which the heat capacity of liquid water and ice are neglected. The pseudo-equivalent potential temperature is the equivalent potential temperature assuming a pseudo-adiabatic process. Further details can be found in Emanuel (1994, Section 4.7).
passage of each front is characterised by a significant decrease in equivalent potential temperature through most of the mixed layer. However, the change in potential temperature (not shown) is less pronounced. As noted earlier, intense daytime heating of the boundary layer causes subtropical cold fronts to weaken and decelerate as they progress across central Australia during the day. The mean diurnal surface energy balance at Alice Springs for the duration of the field experiment is shown in Fig. 4. This figure shows strong day-to-day consistency due to the predominance of clear-sky conditions. Through the period, daytime net radiation peaks at slightly more than 600 Wm-2. This energy flux is composed largely of sensible heat flux (~450 Wm-2) and substrate heat flux (~170 Wm-2), with evaporative heat flux remaining slightly negative (indicating a very dry environment). Overnight the net radiative deficit (~-80 Wm-2) is almost exactly balanced by substrate heat flux, with sensible and latent heat fluxes remaining close to zero. The effect of the central Australian cold fronts on surface energy fluxes is addressed in another paper (Beringer and Tapper 2000).
Event 4
Although seven events were documented in detail during CAFE96, the remainder of the paper focuses on Events 3, 4 and 6 only. In this section we examine Event 4. In most respects this event was a fairly representative subtropical cold front, although it was relatively moist and it re-intensified during the late afternoon.
186 Fig. 4
Australian Meteorological Magazine 49:3 September 2000 Mean diurnal energy balance for Alice Springs Airport for the entire study period. Data are 20-minute averages of the net radiation Q*, the sensible heat flux QH, the evaporative heat flux QE, and the substrate (soil) heat flux QG obtained using Bowen ratio techniques over a sparse cover of native grasses and shrubs (to a height of ~0.5 m). The bars indicate plus and minus one standard deviation for measurements at six-hourly intervals during the day. Time runs along the abscissa (EST).
Synoptic patterns A sequence of four, twelve-hourly mean sea-level pressure (MSLP) analyses is shown in Fig. 5. Those regions in which the analysed 900 hPa temperature gradient exceeds 2 x 10⁻⁵ Km-1 are marked. The evolution of the MSLP is typical of most Australian subtropical frontal systems. At the initial time, 1700 UTC on 18 September 1996, a broad surface low is analysed over the ocean south of Australia and a pronounced trough extends from the low centre to the northwestern corner of the continent. The trough and strong anticyclone to the west combine to produce a pronounced pattern of (geostrophic) deformation. A band of strong temperature gradient is oriented northwest to southeast across the southern part of the continent. Near the surface low, the band is positioned on the southwestern side of the trough. However, further to the northwest, the band lies nearer the ridge axis. As the sequence progresses, the surface low moves steadily eastwards. Strong ridging across the centre of the continent follows the passage of the low to the south, producing pronounced southwesterlies and strong cold air advection. The southern part of the band of strong temperature gradient weakens while the northern portion moves northeastwards, sandwiched between the trough and ridge axes.
As in Smith et al. (1995), fronts are defined here by the position of maximum low-level cyclonic relative vorticity. Although not commonly used in frontal analysis, this position is a reliable indicator of frontal location (as defined by the wind change) even when the front is affected by strong spatial and temporal changes in sensible heating (Reeder and Smith 1988; Deslandes et al. 1999). This property is especially important in regions like central Australia where the diurnal temperature range can be very large, and the diurnal cycle strongly modulates the speed and intensity of fronts. The relative vorticity at 950 hPa for Event 4 is shown in Fig. 6 and the axis of maximum relative vorticity is drawn on the MSLP maps (Fig. 5). At 1700 UTC on 18 September, a band of cyclonic relative vorticity extends from the parent cyclone across southeastern Australia and is connected to a second, separate band of cyclonic vorticity lying across northern Australia. This second band is associated with the heat troughs over the east and west of the continent. Heat troughs are nearly permanent features of the region throughout most of the year. (See for example, Leighton and Deslandes (1991).) Both bands of cyclonic vorticity are reflected in the MSLP chart with the axis of maximum relative vorticity lying along the trough axis. The ridge across western Australia is asso-
Reeder et al.: Subtropical fronts observed in central Australia Fig. 5
(a)
187
Analyses of mean sea-level pressure for Event 4 at (a) 1700 UTC 18 September 1996, (b) 0500 UTC 19 September, (c) 1700 UTC 19 September, and (d) 0500 UTC 20 September. Contour interval is 2 hPa. The dashed lines enclose those regions where ∇900 hPa T ≥ 5 x 10⁻⁵ Km-1. Axis of maximum cyclonic relative vorticity marked by thick lines.
(b)
ciated with a broad area of anticyclonic relative vorticity. The (cyclonic) relative vorticity strengthens overnight and weakens during the day, and by 1700 UTC on 19 September a strong band of cyclonic vorticity extends across northern Australia. A third band of cyclonic relative vorticity lies across southern Australia and marks a secondary cold front. This feature is not important in the present study. Figure 7 shows analyses of the 900 hPa (pseudo) equivalent potential temperature at twelve-hourly intervals starting from 1700 UTC on 18 September. The equivalent potential temperature at this level is a useful way of identifying different air masses over the Australian continent because the cold air immediately behind the front tends to be drier aloft than the warm air. Two distinct bands of equivalent potential temperature are analysed at the initial time. The first lies on the warm side of the trough and along the northwestern coastline, and marks a dry line separating moist tropical air from drier continental air. The
(c)
(d)
second band lies across the southern part of the continent, and its leading edge marks the weak subtropical cold front we refer to as Event 4. The two bands of enhanced equivalent potential temperature meet over southeastern Australia near the parent low. Event 4 advances northwards and eventually merges with the dry line. This event was unusually moist and upperlevel cloud developed along the front and during the afternoon of 19 September. Diurnal cycle and bore waves Like almost all subtropical fronts observed during CAFE91 and CAFE96, Event 4 showed a marked diurnal cycle in intensity. The diurnal cycle is evident, for example, in the low-level relative vorticity (Fig. 6). Another field exhibiting a clear diurnal signature is the (adiabatic) frontogenesis function, maps of which are shown in Fig. 8. Here, the frontogenesis function is defined as the rate-of-change of the magnitude of the 900 hPa temperature gradient following the fluid
188 Fig. 6
(a)
Australian Meteorological Magazine 49:3 September 2000 Analyses of relative vorticity on the 900 hPa surface for Event 4 at (a) 1700 UTC 18 September 1996, (b) 0500 UTC 19 September, (c) 1700 UTC 19 September, and (d) 0500 UTC 20 September. Dashed contours denote negative values and represent cyclonic vorticity in the southern hemisphere. Contour interval is 10-5 s-1 .
(b)
motion, i.e. D ∇900 hPa T /Dt . Although the calculation does not explicitly include the diabatic contribution, to some degree diabatic effects are included implicitly. This is because the wind and temperature fields used to calculate the frontogenesis function have been affected by diabatic heating. At 1700 UTC on 18 September (not shown) there is strong frontogenesis over southeastern Australia close to the parent low and a band of weaker frontogenesis oriented west-east across the western part of the continent. Twelve hours later at 0500 UTC on 19 September (1500 EST), there is a weak northwest to southeast band of frontogenesis across central and eastern Australia (Fig.8(a)). The maximum in the frontogenesis function is associated with strong northwesterlies and the attendant warm advection on the eastern side of the trough (Fig. 5(b)). Shortly after this analysis time, Event 4 strengthened and accelerated across eastern part of the instrument array (Fig. 2).
(c)
(d)
One of the most striking features of the analysis sequence is that the frontogenesis is strongest overnight in the subtropics. This aspect of Event 4 is common to all subtropical fronts observed during preCAFE, CAFE91 and CAFE96. Comparing Figs 5 and 8 shows that the frontogenesis maxima are located near and just ahead of the low-level temperature gradient maxima. The nocturnal subtropical frontogenesis is intimately tied to the strong ridging and the associated deformation. At each time the region of maximum frontogenesis is located between the trough and ridge axes. This is a general feature of frontogenesis in the Australian subtropics. Although the individual terms that comprise the frontogenesis function are not shown, the deformation term is the largest contributor. It reaches its maximum at 1700 UTC on 19 September, around the time at which the bore waves were generated. At this time the convergence term is a maximum also and is slightly more than half the deformation term.
Reeder et al.: Subtropical fronts observed in central Australia Fig. 7
(a)
189
Analyses of equivalent potential temperature on the 900 hPa surface for Event 4 at (a) 1700 UTC 18 September 1996, (b) 0500 UTC 19 September, (c) 1700 UTC 19 September, and (d) 0500 UTC 20 September. Contour interval is 4 K.
(b)
Figure 9 shows the 900 hPa ageostrophic wind vectors and the 850 hPa vertical motion calculated from LAPS at 0500 UTC on 19 September and at 1700 UTC on 19 September. During the middle of the day over eastern Australia there is ageostrophic flow towards the trough axis from the warm side, while on the cold side of the trough the ageostrophic wind is relatively light (although there are strong geostrophic southwesterlies in the region). Further, there are ageostrophic northwesterlies behind the trough over the centre of the continent. There is a band of ascent along the trough and another maximum over northwestern Australia associated with the heat low. After sunset, the low-level ageostrophic circulation changes dramatically. In the early hours of the morning, prominent south or southwesterly ageostrophic winds are analysed through central Australia on the cold side of the trough, and strong ageostrophic down-gradient flow has developed over eastern Australia on both sides of the trough. The ver-
(c)
(d)
tical motion along the trough has strengthened and links with the region of ascent connected to the heat low. These changes in the pattern of vertical motion are reflected in the low-level relative vorticity (cf. Figs 6(b) and 6(c) with 9(a) and 9(b)). In Event 4, the strongest daytime ageostrophic winds were found on the warm side of the trough because the pressure gradient was largest there. In most other fronts observed during CAFE91 and CAFE96, the prefrontal geostrophic flow was relatively weak and consequently the daytime ageostrophic flow was largest on the cold side of the trough (see e.g. Deslandes et al. 1999). Nonetheless, all fronts examined show strong overnight increases in the ageostrophic flow and in the vertical motion. The changes in the pattern of low-level ageostrophic flow are responsible for the rapid nocturnal frontogenesis. Figure 10 shows time-series of the maximum contributions to the frontogenesis function from the
190 Fig. 8
(a)
Australian Meteorological Magazine 49:3 September 2000 Analyses of the frontogenesis function on the 900 hPa surface for Event 4 at (a) 0500 UTC 19 September 1996, (b) 1700 UTC 19 September, and (c) 0500 UTC 20 September. Contour interval is 10-10 K m-1 s-1.
Fig. 9
(a)
Ageostrophic winds at 900 hPa, and the vertical motion at 850 hPa for Event 4. (a) 0500 UTC 19 September 1996, and (b) 1700 UTC 19 September. Contour interval is 5 hPa h-1. Dashed contours represent subsidence, solid lines ascent. Zero contour line omitted. Halflength wind barbs are 5 m s-1 , and full-length wind barbs are 10 m s-1.
(b) (b)
(c)
ageostrophic deformation and the geostrophic deformation along the vertical cross-section roughly normal to the front (approximately southwest to northeast). The geostrophic deformation term peaks mid after-
noon on 19 September, but nonetheless does not vary a great deal with time. In contrast, the ageostrophic deformation term shows a strong time variation. It is largest in the evening and early hours of the morning, at which time it is more than twice as large as the maximum in the geostrophic deformation term. Strong overnight post-frontal ridging and frontogenesis are features of all subtropical fronts studied as part of the three CAFE field experiments. During the afternoon, to the rear of the front, the ageostrophic winds are generally sub-geostrophic in the boundary layer due to the strong turbulent stresses. Later in the
Reeder et al.: Subtropical fronts observed in central Australia Fig. 10
191
Time-series of the maximum contributions to the total deformation term in the frontogenesis function from the ageostrophic deformation (Adef) and the geostrophic deformation (Gdef) for Event 4 along a vertical crosssection approximately normal to the front. The ordinate represents the deformation frontogenesis in units of 1.0 x 10⁻¹¹ K m-1 s-1, while the abscissa represents time.
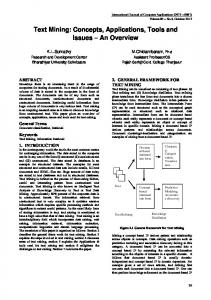
day as the sensible heating vanishes and the turbulent boundary-layer stresses weaken, the post-frontal ageostrophic winds in the boundary layer strengthen and rotate anticyclonically towards the trough. This in turn increases the convergence and ageostrophic deformation, producing rapid nocturnal frontogenesis. Sometime during the period of rapid nocturnal intensification, a family of southerly bore waves (or southerly morning glories) was generated and propagated ahead of the frontal cloudband. These waves can be seen in Fig. 11, the GMS visible satellite image centred over northern Queensland at 2033 UTC on 19 September 1996 (0633 EST on 20 September). Although partially obscured to the southwest by midlevel frontal cloud, the wave crests are marked by morning glory roll clouds. At this time a frontal cloudband lies across most of eastern Australia, extending northwestwards across the north of the continent, although only the most northward part is shown in Fig. 11. Time-series of temperature, dew-point temperature, wind direction and wind speed from the Dajarra and Gregory Downs automatic weather station are plotted in Figs 12 and 13 respectively. Event 4 is relatively unusual as the front re-intensified in the midafternoon. At 2015 EST on 19 September the front passed the Dajarra automatic weather station. With the passage, the temperature and dew-point temperature both fell sharply and the wind backed. The frontal passage was marked also by a pronounced
pressure rise. As the front progressed across the network it developed a series of bore waves at its leading edge. These bore waves passed the Gregory Downs automatic weather station at 0445 EST on 20 September, which is 1 h 48 mins before the GMS visible satellite image in Fig. 11. The bore waves feature prominently in the time-series. The pressure perturbations are accompanied by fluctuations in the wind direction, but little change in the temperature or dewpoint temperature. The pressure minimum in the Gregory Downs time-series (Fig. 13(d)) occurs at about 0300 EST (1700 UTC), which is consistent with the analysed position of the MSLP trough (Fig. 5(c)). Therefore, the pressure jump at 0445 EST marks the leading edge of the ridge as the latter extends across the continent. Although data assimilation schemes such as LAPS are unable to analyse bores, manual MSLP analyses could take account of the extremely strong pressure gradients and sharp wind changes at the leading edge of the ridge. Figure 14 shows the energy fluxes measured during the morning of 19 September at Alice Springs where the front passed at 1000 EST (0930 CST). Clearly the front had little effect on the surface energy balance as measured by both Bowen ratio and eddy correlation techniques. The radiative, sensible and evaporative heat fluxes were virtually unaffected, with substrate heat flux showing a slight reduction in the period
192 Fig. 11
Australian Meteorological Magazine 49:3 September 2000 GMS visible satellite image from Event 4 at 2033 UTC 19 September 1996 (0633 EST 20 September).
immediately following the frontal passage. Similar fluctuations in substrate heat flux were noted in our earlier work (Smith et al. 1995). Thus, boundary-layer heating is similar ahead of and behind the cold front. It should be noted that 25-30% underestimate of sensible heat flux (~100 Wm-2 in the middle of the day) by eddy correlation is typical of measurements using a one-dimensional array such as was used here.
Event 6
We examine now the structure and evolution of Event 6. Like Event 3, Event 6 was spawned by a deeply occluded low.
27 and 28 September Figures 15, 16 and 17 show analyses of MSLP, 900 hPa temperature gradient, 900 hPa relative vorticity,
and 900 hPa equivalent potential temperature respectively. The analyses are 24 hours apart and start from 1100 UTC on 27 September 1996. The central synoptic feature is a very broad slow-moving extratropical cyclone centred near the southern coastline. At 1100 UTC on 27 September (2100 EST) there is a very broad region of cyclonic relative vorticity associated with the low, over southwestern Australia with two pronounced bands extending from it. The weaker band is oriented northwest to southeast and marks a cold front. The stronger band is oriented roughly east-west and defines a warm front. Although rarely analysed as such, we believe that warm fronts are relatively common in the Australian region. The passage of the warm front was evident in the surface data at Santa Teresa and Maryvale as a sharp wind shift from weak easterlies to moderately strong westerlies at about 1030 EST (1000 CST) and 1200 EST (1130 CST), respectively. Both the cold and warm
Reeder et al.: Subtropical fronts observed in central Australia
193
Fig. 12
Dajarra automatic weather station time-series. (a) Temperature and dew-point temperature, (b) wind speed, (c) wind direction, and (d) pressure. The time-series begins at 0000 EST on 19 September 1996. Time runs along the abscissa (EST).
Fig. 14
Fig. 13
Gregory Downs automatic weather station time-series. (a) Temperature and dew-point temperature, (b) wind speed, (c) wind direction, and (d) pressure. The time-series begins at 0000 EST on 20 September 1996. Time runs along the abscissa (EST).
temperature comes from gradients in the water vapour mixing ratio. In fact, the strongest temperature gradient lies to the south of the warm front, as defined by the axis of maximum cyclonic relative vorticity. There is a local maximum in the temperature gradient over the southern section of the Cape York Peninsula caused by the previous day’s sea-breeze. Over the next 24 hours the heat trough over northwestern Australia strengthens slightly. At the same time the cold front weakens further, becoming a broad trough that extends from the parent low across central Australia to northwest Australia. This trough is marked by a weak band of cyclonic relative vorticity through northeastern and central Australia, and by pronounced gradients in the equivalent potential temperature. In terms of relative vorticity, the remnants of the front are separate from the heat trough over the coast of northwestern Australia. As is usually the case, the temperature gradient maximum is to the rear of the trough axis. A region of anticyclonic relative vorticity develops through central Australia and is reflected in the MSLP as a weak ridge. Event 6 crossed the AWS network around Alice Springs early to mid morning on 28 September. Santa Teresa is about 70 km southeast of Alice Springs and time-series of temperature, dew-point temperature, wind speed, wind direction and pressure from the AWS there are shown in Fig. 18. The front arrives at Santa Teresa at 0800 EST (0730 CST = 2200 UTC on 27
(a)
Surface flux measurements (20 minute averaged data) at Alice Springs during the passage of Event 4, 19 September 1996. The sensible and evaporative heat fluxes, QH and QE , are determined by the Bowen ratio and eddy correlation systems respectively. The net radiation and substrate heat flux measurements, Q * and Q , were common to both systems. Time G runs along the abscissa (EST).
(b) (c) (d)
(a)
(b) (c) (d)
fronts are marked by pronounced gradients in the equivalent potential temperature. However, the temperature gradient across the cold front is weak indicating that most of the contrast in equivalent potential
194 Fig. 15
(a)
Australian Meteorological Magazine 49:3 September 2000 Analyses of mean sea-level pressure for Event 6 at (a) 1100 UTC 27 September 1996, (b) 1100 UTC 28 September, (c) 1100 UTC 29 September, and (d) 1100 UTC 30 September. Contour interval is 2 hPa. The dashed lines enclose those regions where ∇900 hPa T ≥ 2 x 10⁻⁵ Km-1. Axis of maximum cyclonic relative vorticity marked by thick lines.
(b)
September). At this time the temperature falls sharply, the wind direction changes abruptly from westerly to southerly and the pressure jumps by about 1 hPa. A temporary wind surge accompanies the changes and the dew-point temperature rises sharply. For the next six hours the wind veers steadily and becomes westerly. During this period, the temperature climbs due to daytime solar heating. At 1400 EST (1330 CST) a second change is recorded. This time the wind speed increases abruptly to more than 12 m s-1, the temperature rises by about 3°C and the dew-point temperature falls sharply. The first change recorded at Santa Teresa marks the cold front as it advances through the network. Presumably the depth of the cold air increases towards the southwest behind the change. As the ground is heated during the morning, the leading edge of the cold air is eroded by turbulent mixing in the vertical. Consequently, the air mass boundary retreats towards the cooler air, and we hypothesise that the passage of
(c)
(d)
this boundary is the second change observed at Santa Teresa. This interpretation is consistent with observations made at Alice Springs. The front arrived at Alice Springs at 1010 EST (0940 CST), at which time the temperature fell sharply by 6°C and the dew-point rose. The front was followed by moderate south-southwesterlies. However, the front appeared to stall at Alice Springs and automatic weather stations to the north of Alice Springs did not record a change. Although not shown, the time-series of temperature, dew-point temperature, wind speed, wind direction and pressure at Alice Springs are similar to those recorded at Santa Teresa, the main difference being the time between the advancing and retreating changes; the changes were separated by only 1 hour and 45 minutes at Alice Springs. The second (retreating) change brought with it strong northwesterlies and blowing dust. A very weak change returned to Alice Springs at 2135 EST (2105 CST), although is there is no clear evidence for the change in any of the other AWS time-series.
Reeder et al.: Subtropical fronts observed in central Australia Fig. 16
(a)
195
Analyses of relative vorticity on the 900 hPa surface for Event 6 at (a) 1100 UTC 27 September 1996, (b) 1100 UTC 28 September, (c) 1100 UTC 29 September, and (d) 1100 UTC 30 September. Dashed contours denote negative values and represent cyclonic vorticity in the southern hemisphere. Contour interval is 10-5s-1.
(b)
According to the Bureau of Meteorology forecasters, it is not unusual for the position of subtropical cold fronts to oscillate back and forth as the daytime turbulent mixing waxes and wanes. However, Event 6 is the only documented example of which we are aware. As with Event 4, the passage of Event 6 through Alice Springs had a minimal effect on the surface energy fluxes, except for a temporary reduction of substrate heat flux associated with the wind surge.
29 and 30 September At 1100 UTC on 30 September, the parent surface low is south of Victoria and a very intense ridge extends across the centre of the continent (Fig. 15). Anticyclonic relative vorticity covers much of the central and southern parts of Australia (Fig. 16). A trough and associated band of cyclonic relative vorticity lies across the northern parts of the continent, extending to a heat low in the northwest. A concentrated band of equivalent potential temperature extends across northern Australia (Fig. 17).
(c)
(d)
Although the front greatly weakens while over central Australia on 28 September, it rapidly re-intensifies over the northeastern part of the continent. While the frontal signature shows little continuity in most fields, including temperature, the front can be traced continuously in the fields of vorticity and equivalent potential temperature. Severe convection and tornadoes were reported in New South Wales along the cold front on the afternoon of 29 September (Mills and Colquhoun 1998). The surface pressure pattern at 1100 UTC on 30 September implies very strong geostrophic deformation over central and northern Queensland with the dilation axis roughly along the trough axis. A sequence of four analyses of the frontogenesis function on the 900 hPa surface for Event 6 are shown in Fig. 19. The analyses begin at 2300 UTC on 28 September and are spaced at twelve-hourly intervals. At 2300 UTC on 28 September the frontogenesis function is essentially zero over most of the continent.
196 Fig. 17
(a)
Australian Meteorological Magazine 49:3 September 2000 Analyses of equivalent potential temperature on the 900 hPa surface for Event 6 at (a) 1100 UTC 27 September 1996, (b) 1100 UTC 28 September, (c) 1100 UTC 29 September, and (d) 1100 UTC 30 September. Contour interval is 4 K.
(b)
Had the diabatic contribution been included in the calculation the rate-of-change of temperature gradient would have been presumably frontolytic. As the ridge builds across the continent, the frontogenesis function increases. By 1100 UTC on 30 September there is strong localised frontogenesis over northeastern Australia. In each of the analyses, the maxima in the frontogenesis function are located midway between the trough and ridge axes. For example, compare Figs 15(c) and (d) with Figs 19(b) and (d). Time-series of temperature, dew-point temperature, wind direction, and wind speed at Urandangi are shown in Fig. 20. A strong easterly surge arrives at 0730 EST, accompanied by a sharp pressure rise. The temperature rises also, presumably due to the turbulent mixing of potentially warmer air downward. The satellite imagery at this time showed that the strong overnight frontogenesis produced a spectacular southerly morning glory over the Gulf of Carpentaria.
(c)
(d)
Event 3
Event 3 was typical of the subtropical cold fronts observed during pre-CAFE, CAFE91 and CAFE96. The front developed in the trough between two broad anticyclones and was linked to an extratropical cyclone centred off the southern coast of Australia. The front strengthened over the continent during the evening of 11 September, arriving at Alice Springs at 2330 EST (2300 CST) and crossing the remainder of the network overnight. Figure 21 shows synoptic analyses of MSLP, 900 hPa temperature gradient, 900 hPa relative vorticity, 900 hPa equivalent potential temperature, and 900 hPa frontogenesis function. The analyses come from LAPS and are valid at 1700 UTC on 11 September (0300 EST on 12 September). At this time the front (as defined by the 900 hPa relative vorticity maximum) lies roughly northwest-southeast across
Reeder et al.: Subtropical fronts observed in central Australia
197
Australia and links with the heat trough in the northwest corner of continent. The front is oriented more zonally in the subtropics with a strong subtropical ridge to the south. As expected, frontogenesis is a maximum in the early hours of the morning and is located along the front in the subtropics. Time-series of temperature, dew-point temperature, wind direction and wind speed from the AWS at Tarlton Downs are shown in Fig. 22. The front arrives at Tarlton Downs at about 0230 EST on 12 September which is close to the analysis time in Fig. 21. Prior to the arrival, the wind is light and predominantly northerly. As the front passes the AWS, the pressure rises very sharply, and the wind strengthens greatly and backs, becoming southerly. The frontal passage is marked also by a pronounced rise in the temperature and dew-point temperature. The freshening of the wind with the change suggests that these rises are caused by the downward mixing of potentially warmer and moister air from aloft. A second weaker change arrives about three hours later. This time the temperature and the dew-point temperature fall, and this fall is accompanied by a wind surge. Like the second change, the equivalent potential temperature at 900 hPa shows a cold, dry anomaly accompanying the frontal passage (see Fig. 21(c)).
Fig. 18
Santa Teresa automatic weather station timeseries. (a) Temperature and dew-point temperature, (b) wind speed, (c) wind direction, and (d) pressure. The time-series begins at 0000 EST on 28 September 1996. Time runs along the abscissa (EST).
Fig. 19
Analyses of the frontogenesis function on the 900 hPa surface for Event 6 at (a) 2300 UTC 28 September 1996, (b) 1100 UTC 29 September, (c) 2300 UTC 29 September, and (d) 1100 UTC 30 September. Contour interval is 10-10K m-1 s-1.
(a)
(b) (c) (d)
(a)
(b)
(c)
(d)
198 Fig. 20
Australian Meteorological Magazine 49:3 September 2000 Urandangi automatic weather station timeseries. (a) Temperature and dew-point temperature, (b) wind speed, (c) wind direction, and (d) pressure. The time-series begins at 0000 EST on 30 September 1996. Time runs along the abscissa (EST).
(a)
(b) (c) (d)
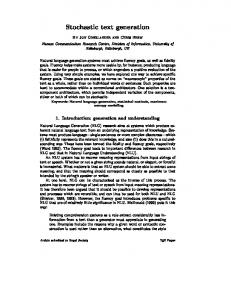
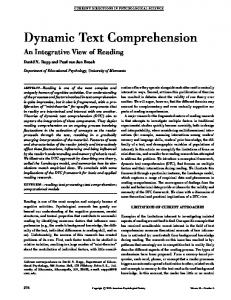
The warm moist strip of air behind the leading edge of the front can be seen in the GMS infrared satellite image at 1232 GMT (2232 EST) on 11 September (Fig. 23). This warming is detectable in the infrared satellite imagery by suitably re-tuning the signal to enhance low-level features. The infrared image also captures the leading edge of the Gulf of Carpentaria sea-breeze. Identifying these features in the satellite imagery provides a means of locating surface cold fronts and sea-breeze fronts.
Summary and conclusions
The Central Australian Fronts Experiment 1996 (CAFE96) was the third in a series of field experiments that form part of a longer-term project to understand the behaviour of subtropical continental cold fronts during the late dry season. The central aim of CAFE96 was to investigate the structure and dynamics of subtropical cold fronts that affect central Australia. Seven fronts were documented in detail during CAFE96 and, by and large, they confirmed the conclusions from CAFE91. The present paper focused principally on three frontal systems: Events 3, 4 and 6. Events 4 and 6 were emphasised because aspects of their structure and evolution were a little different from the previously reported paradigm. For example, of the 14 fronts documented in detail during CAFE96,
CAFE91 and pre-CAFE, only these events were detected during the late morning or afternoon. Moreover, Event 6 decayed over central Australia, only to re-intensify two days later over the northeastern part of the continent. Unlike most of the 14 fronts studied, Events 4 and 6 were accompanied by severe weather over eastern Australia. Event 4 re-intensified during late afternoon and subsequently crossed the eastern half of the network. The front continued to intensify overnight, generating a spectacular family of southerly bore waves (or southerly morning glories). By the end of the event, a zone of strong equivalent potential temperature gradient stretched across the whole of northern Australia. Event 6 developed in a broad, slow-moving, extratropical cyclone that advanced across southern Australia. The system had the structure of a classical mature extratropical cyclone and was accompanied by a cold front and strong warm front. Although rarely analysed as such, we believe that warm fronts are relatively common in the region. The cold front strengthened and moved northeastwards across central Australia in the early hours of 28 September 1996, arriving at Santa Teresa at 0800 EST (0730 CST) and at Alice Springs at 1010 EST (0940 CST). However, as the daytime turbulent mixing increased, the front stalled and retreated back through Alice Springs at 1155 EST (1125 CST), bringing with it northwesterlies and blowing dust. The front retreated through Santa Teresa about 1400 EST (1330 CST). It subsequently weakened and there is little clear evidence that it crossed the network again. While it is probably quite common for the position of subtropical cold fronts to oscillate back and forth in response to the daytime turbulent mixing, Event 6 is the only documented example of which we are aware. It must be emphasised that we do not consider the leading edge of the front to be a material surface being advected back and forth across the centre of the continent. Rather, the leading edge of the front is generally much shallower than the depth of the daytime mixed layer and we envisage that the nose of the front is eroded by turbulent mixing in the vertical. At night, once the (buoyantly generated) turbulent mixing subsides, the large-scale pattern of deformation acts to re-establish the cross-frontal temperature gradient. The dynamics of fronts like Event 6 are largely unknown and is a topic for further research. As the ridge built across the continent, strong frontogenesis developed over northeastern Australia on 30 September 1996. The surface pressure pattern implied very strong geostrophic deformation over central and northern Queensland with the dilation axis along the trough axis. Event 6 re-formed locally and crossed the northeastern part of the observational network during the late morning of 30 September.
Reeder et al.: Subtropical fronts observed in central Australia Fig. 21
(a)
199
Synoptic analyses for Event 3 at 1700 UTC 11 September. (a) Mean sea-level pressure. Contour interval is 2 hPa. Dashed lines enclose those regions where ∇900 hPa T ≥ 2 x 10⁻⁵ K m-1s-1. Axis of maximum relative vorticity marked by thick lines. (b) Relative vorticity on the 900 hPa surface. Dashed contours denote negative values and represent cyclonic vorticity in the southern hemisphere. Contour interval is 10-5s-1. (c) Equivalent potential temperature on the 900 hPa surface. Contour interval is 4 K. (d) Frontogenesis function on the 900 hPa surface. Contour interval is 10-10K m-1 s-1.
(b)
The structure and evolution of Event 3 was typical of those subtropical fronts reported previously. It strengthened and accelerated during the evening of 11 September 1996, and crossed the observational network during the night and early morning hours. Strong near-surface warming followed the passage of the front. This warming was detected in the enhanced satellite imagery and confirmed by surface measurements. The current study has emphasised the use of lowlevel cyclonic relative vorticity in analysing fronts over continental Australia. Although not commonly used in frontal analysis, low-level cyclonic relative vorticity has proved to be reliable indicator of frontal position even when the front is affected by strong spatial and temporal changes in sensible heating. While the fronts in the Australian subtropics often show lit-
(c)
(d)
tle continuity in most fields (such as temperature), they can be traced continuously in the fields of vorticity and equivalent potential temperature. In general, the results of CAFE96 have confirmed the conclusions drawn from the two previous experiments, but they raise a number of theoretical questions concerning the effect of turbulent mixing on the evolution and progression of subtropical cold fronts.
Acknowledgments
We would like to thank the Australian Bureau of Meteorology’s Northern Territory Regional Office for its support during CAFE96. We are particularly indebted to the Director Jim Arthur, and to Geoff Garden, Julian Romanyk and Phil Dutton. Special
200 Fig. 22
Australian Meteorological Magazine 49:3 September 2000 Tarlton Downs automatic weather station timeseries for Event 3. (a) Temperature and dew-point temperature, (b) wind speed, (c) wind direction, and (d) pressure. The timeseries begins at 0000 EST on 12 September 1996. Time runs along the abscissa (EST).
(a)
References
(b) (c) (d)
Fig. 23
those involved in CAFE96: Jason Beringer, Doug Christie, Lance Leslie, Heinz Loesslein, Anita Menhofer, Diane MinFa, Zsuzsanna Rácz and Hilbert Wendt. We wish to thank QANTAS Airlines for their generous assistance in transporting instruments from Germany to Australia. This work was supported by grants from the Australian Research Council and the German Research Council.
GMS infrared satellite image from Event 3 at 1232 UTC 11 September 1996 (2232 EST 11 September). The leading edge of the front and the sea-breeze boundary are marked as FR and SB respectively.
thanks are due also to Brian Riley and Peter Strickland from the Australian Bureau of Meteorology’s Alice Springs Office, and to all the observers at the Alice Springs and Giles Offices. We are very grateful to Bill Physick and Geoff Garden for their detailed reviews, and to Robert Goler for his comments on the manuscript. Many thanks to all
Beringer, J. and Tapper, N.J. 2000. The influence of subtropical cold fronts on the surface energy balance of a semi-arid site. Journal of Arid Environments, 44, 437-50. Christie, D.R. 1992. The morning glory of the Gulf of Carpentaria: a paradigm for nonlinear waves in the lower atmosphere. Aust. Met. Mag., 41, 21-60. Deslandes, R., Reeder, M.J. and Mills, G. 1999. Synoptic analyses of a subtropical cold front observed during the 1991 Central Australian Fronts Experiment. Aust. Met. Mag., 48, 87-110. Emanuel, K. A. 1994. Atmospheric Convection. Oxford U. Press. pp. 580. Griffiths, M., Reeder, M.J., Low, D.J. and Vincent, R.A. 1998. Observations of a cut-off low over Southern Australia. Q. Jl R. Met. Soc., 124, 1109-32. Leighton, R.M. and Deslandes, R. 1991. Monthly anticyclonicity and cyclonicity in the Australasian region: averages for January, April, July, and October. Aust. Met. Mag., 39, 149-154. Mills, G.A. and Colquhoun, J.R. 1998. Objective prediction of severe thunderstorm environments: preliminary results linking a decision tree with an operational regional NWP model. Weath. forecasting, 13, 1078-92. Puri, K., Dietachmayer, G.S., Mills, G.A., Davidson, N.E., Bowen, R.A. and Logan, L.W. 1998. The new BMRC Limited Area Prediction Scheme, LAPS. Aust. Met. Mag., 47, 203-23. Rácz, Zs. and Smith, R.K. 1999. The dynamics of heat lows. Q. Jl R. Met. Soc., 125, 225-52. Reeder, M.J. and Christie, D.R. 1998. Four large-amplitude wave disturbances observed simultaneously over northern Queensland, Australia. Weather, 53, 134-40. Reeder, M.J. and Smith, R.K. 1988. The horizontal resolution of fronts in numerical weather prediction models. Aust. Met. Mag., 36, 11-16. Reeder, M.J. and Smith, R.K. 1992. Australian spring and summer cold fronts. Aust. Met. Mag., 41, 101-24. Reeder, M.J. and Smith, R.K. 1998. Mesoscale Meteorology. Meteorology of the Southern Hemisphere. Eds. D. Vincent and D.J. Karoly. American Meteorological Society, 201-241. Reeder, M.J., Christie, D.R., Smith, R.K. and Grimshaw, R. 1995. Interacting morning glories over northern Australia. Bull. Am. Met. Soc., 76, 1165-71. Smith, R.K. 1988. Travelling waves and bores in the lower atmosphere: the ‘Morning Glory’ and related phenomena. Earth-Sci. Rev., 25, 267-90. Smith, R.K. and Noonan, J.A. 1998. On the generation of low-level mesoscale convergence lines over northeastern Australia. Mon. Weath. Rev., 126, 167-85. Smith, R.K. and Ridley, R. 1990. Subtropical continental cold fronts. Aust. Met. Mag., 38, 191-200. Smith, R.K., Coughlan, M.J. and Lopez, J.L. 1986. Southerly nocturnal wind surges and bores in northeastern Australia. Mon. Weath. Rev., 114, 1501-18. Smith, R.K., Reeder, M.J., Tapper, N.J. and Christie, D.R. 1995. Central Australian cold fronts. Mon. Weath. Rev., 123, 16-38.