Text Classification, Business Intelligence, and Interactivity: Automating C-Sat Analysis for Services Industry Shantanu Godbole
Shourya Roy
IBM Research India Research Lab, New Delhi
IBM Research India Research Lab, New Delhi
[email protected]
ABSTRACT Text classification has matured as a research discipline over the last decade. Independently, business intelligence over structured databases has long been a source of insights for enterprises. In this work, we bring the two together for Customer Satisfaction(C-Sat) analysis in the services industry. We present ITACS, a solution combining text classification and business intelligence integrated with a novel interactive text labeling interface. ITACS has been deployed in multiple client accounts in contact centers. It can be extended to any services industry setting to analyze unstructured text data and derive operational and business insights. We highlight importance of interactivity in real-life text classification settings. We bring out some unique research challenges about label-sets, measuring accuracy, and interpretability that need serious attention in both academic and industrial research. We recount invaluable experiences and lessons learned as data mining researchers working toward seeing research technology deployed in the services industry.
Categories and Subject Descriptors H.4.0 [Information Systems Applications]: General; I.7.0 [Document and Text Processing]: General
General Terms Design, Human Factors
Keywords csat analysis, services, text classification, business intelligence
1.
INTRODUCTION
Unstructured text is emerging to be the single largest source of unprocessed data growing rapidly in today’s customer-
Permission to make digital or hard copies of all or part of this work for personal or classroom use is granted without fee provided that copies are not made or distributed for profit or commercial advantage and that copies bear this notice and the full citation on the first page. To copy otherwise, to republish, to post on servers or to redistribute to lists, requires prior specific permission and/or a fee. KDD’08, August 24–27, 2008, Las Vegas, Nevada, USA. Copyright 2008 ACM 978-1-60558-193-4/08/08 ...$5.00.
[email protected]
centric enterprises. Gartner1 reports indicate that over 80% data in enterprises is unstructured, noisy, and doubles every three months. Processing such huge amount of data and deriving business insights from it has become very important in expanding customer-centric programs like customer relationship management (CRM) and customer experience management (CEM). With the growing eminence of the services industry, such programs are critical to competitive growth, and sometimes even survival. CRM practices, contact centers, and customer facing arms of companies are increasingly looking to text mining to help them understand and derive value and insights from text data. The customer, the end consumer of products and services, is receiving increased attention. Analytics and business intelligence (BI) applications revolving around the customer has led to emergence and increased attention on notions like customer service quality. Such customer focus is most evident in contact centers, and this paper describes our research engagement with leading contact centers handling outsourced helpdesks of telecom, e-commerce, and finance companies. Our engagement concerned conceptualizing, developing and deploying a unique text classification based solution which can be easily replicated across multiple client accounts, offers high accuracy, integrated reporting, and interactivity with the system.
1.1
VoC data and C-Sat analysis
An ever-growing amount of unstructured text data is collected in the customer-centric services industry such as contact centers. Various “Voice of Customer” (VoC) channels like e-mails, feedback surveys, text messages, service requests, agent logs, and conversation transcripts generate lots of unstructured data that needs to be stored and processed. The VoC process aims to listen to customers, understand what is being said, and proactively alter services to provide best in class service quality. It is suggested [19] that existence of a gap between expected and perceived services hints at poor service quality leading to dissatisfied customers. Customer Satisfaction (C-Sat) analysis is one of the most popular techniques of analyzing VoC data. Wikipedia defines C-Sat: Customer satisfaction, a business term, is a measure of how products and services supplied by a company meet or surpass customer expectation. It is seen as a key performance indicator within business and is part of the four perspectives of a Balanced Scorecard. C-Sat is very relevant to contact center business as it is unpardon1
http://www.gartner.com
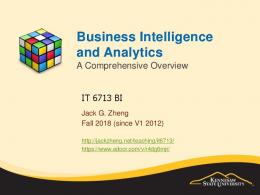
Figure 1: C-Sat analysis setting in contact centers and industrial CRM practices able to ignore what a customer is directly saying about a company’s products and services. In a typical outsourcing or contact center scenario shown in Figure 1, customers contact the service or product provider through phone or email and usually get routed to 3rd party contact centers. Agents, equipped with domain knowledge, online help, and a library of solutions, answer these queries. After this interaction is over, customer feedback is solicited over phone or web-based feedback forms are sent to get ratings on the service, as well as comments and suggestions. 10–20% of all customers are sent feedback requests and a fraction actually reply. For a large e-commerce client, this fraction amounted to about 40–50 thousand feedback comments a month. Typically Quality Analysts (QAs) examine a sample of CSat comments (verbatims) every few weeks, dig out the interactions between agents and customers (text or voice), and assign reason codes (reason for being dissatisfied) to cases. QAs understandably analyze cases of dissatisfied customers, determined by quantitative ratings, while largely ignoring satisfied customers. For illustration, some real comments from customers of a Telecom company are:
In operational settings for example, simple statistical models combined with carefully hand-tuned rule-based systems outperform sophisticated learners. The important requirement of human review of results of classification is never tackled in academic research. Even measuring accuracy is non-trivial and often orthogonal to declaring operational success. The kinds of noise encountered is also unique, and sadly regulations don’t let interesting datasets reach academia. We visit these and other unique challenges in detail in Section 2.
1.3
The ITACS solution We describe our experiences in building and deploying ITACS, an automated system for C-Sat analysis. The largest component of contact center or CRM practice costs is labor; hence, technologies and processes to reduce costs or make on-board labor more efficient are crucial. ITACS is a first of its kind solution integrating text classification, BI, and interactive document labeling for services industry deployments. We focus on contact centers because of relevance to their flood of noisy unstructured VoC text data and importance of C-Sat analysis for their prosperity and even survival. Our contributions. Our unique contributions are: 1. A UIMA2 based customizable text analytics engine uniquely combining statistical and rule-based classifiers. 2. An integrated architecture comprising commercial (for BI) as well as freely available (for text analytics) products. 3. A freely available interactive text labeling tool that helps create the classification system, and can be used for human review and validation of operational systems. 4. We recount some valuable lessons learned as data (text) mining researchers working toward fielding research technology in services industry settings. 5. We also highlight the new kinds of problems and data lying in abundance in services organizations and their value to data mining researchers.
• It was just a computer generated email, so that does not make it very personal • The person who answered my query did so after 4 days. I had already re-installed my router by then • She only tried selling me the new version of ***** instead of telling me how to remove my old paid pack • I did not understand ****’s accent and what he was saying at all! In the above, the first one is categorized with reason code Canned Response, indicating that the interaction should be more personalized. The second complaint is about Delayed Response, the third is categorized Sales Pitch, and the fourth is an Accent problem. Based on aggregate BI analysis, QAs aim to provide qualitative feedback to agents for operational improvements (personalize above response instead of copypasting replies) and sometimes for process improvements (like shift or queue management). Manual C-Sat analysis requires 60% of the time of 2–10 people per account for contact centers. Text classification can help automate this making it consistent and exhaustive.
1.2
Text classification in operational settings:
Text classification is the task of learning models on precategorized document sets and applying the models for class assignments to new documents. It has matured as an academic research field in the past decade with developments in many important areas. Discriminative learners like SVMs[9] and generative models like LDA[2] give state-of-the-art performance and understanding of document generation respectively. Other active research areas are ensemble learning[18], hierarchies [3], active learning [7], and exploiting unlabeled data [14]. While many challenges in real-world settings are usually assumed away in academia to isolate influence and drive research, we believe a lot can be learned from the unique challenges in fielding research applications in industrial settings.
Outline. We highlight some unique research challenges in text classification as well as handling research engagements in Section 2. We describe the architecture of ITACS in Section 3 and present experiments in Section 4. Section 5 discusses our experiences and some lessons learned. We conclude in Section 6 outlining the impact of this project and cover future directions of work.
2.
RESEARCH CHALLENGES
In this section we outline some unique challenges we faced in the text classification domain that are not often encountered in academic research or have to be viewed differently. We describe unique problems regarding label-sets and labeling, measuring accuracy, viewing and interpreting results, and interacting with deployed text analytics systems. 2 IBM Unstructured Information Management Architecture: http://www.research.ibm.com/UIMA/
2.1
Labels and Labeling
The life-cycle of a text classification system begins with the definition of a good set of classes or label-set on which the system is based. Label-sets refer to the collection of classes to which customers comments are categorized depending on the root cause3 . QAs usually provide a base label-set to build the system on. However, it is known that there is seldom a correspondence between a human proposed label-set and a clustering of documents in some geometrical vector space (TFIDF) representation. QAs expect the label-set to be actionable i.e. labels should be convertible into exact business actions. To illustrate, lack of knowledge is a typical class where customers complain that agents do not have the technical depth required to solve their problems; remedial action prescribed is imparting specific training to these agents. Similarly, agents with complaints on accent problems, need to be given appropriate voice training. Text classification experts on the other hand expect classes to be well-defined and separable, not confusing with others. For example, the improper accent, wrong English usage, and poor voice quality classes had to be merged under a accent problems class for a voice-based helpdesk account after discriminative analysis. Hence there is close interaction needed at the label set definition stage between machine learning experts and domain experts. A pre-requisite to training a model for text classification is the availability of a large number of documents categorized manually in accordance with the label-set. The larger and more accurate this training set, machine learning wisdom suggests better the accuracy of the future classification will be. In academic research, the training data set is assumed to be sacrosanct, and there is limited investigation about its quality and consistency. On the other hand, we observed serious calibration issues in labeling of documents causes significant detrimental effect on system accuracy through the quality of the training data. Calibration here refers to the repeatability (consistency of a labeler over time) and reproducibility (consistency between labelers) of labeling. Though 30% inter-human disagreement in labeling has been observed[11, 6], we present some new interesting experiments about human labeling consistency in Section 4.3.
2.2
Measuring accuracy
One observation about real life text classification problems is a highly skewed class distribution. For example one of our clients had 75% of the complaints falling in two classes called Comprehension problems and Incomplete resolution. Simply making near perfect classification predictions on these 2 classes will yield accuracy around 75% if classes contribute to overall accuracy in proportion to their population (microaverage accuracy). However since the label-set is carefully designed by domain experts and every class has relevance to business, it is important for small classes not to get lost. Hence macro-average accuracy has to be considered where each class’s contribution is uniform. In the above case, if there are 10 classes and only 2 classes are perfectly accurate, total accuracy is 20%. Important low population classes cannot be ignored and we discuss how rule-based systems can drive macro-average accuracy in Section 3.1. Various accuracy measures are summarized in [16] and cost-sensitive 3 We use labels, classes, categories, call drivers, root causes interchangably.
classification has been well researched[5] but lessons in operational text classification settings are unique. Another challenge is presented in measuring accuracy of systems. Ground truth is usually taken to be human labeled data and accuracy compares system predictions with this labeling. However in operational services settings, we found that comparing with human labeled truth is not too meaningful. We encountered very low intra-human and interhuman consistency in repeated labeling of the same set of instances. Statistically sound repetition of experiments is unfeasibly expensive due to human labor cost involved. Hence, wrong conclusions are easily drawn about very low (or very high) system accuracy. We hence decided to measure human satisfaction with system predictions instead of any accuracy numbers. We show a few hundred comments and predicted classes to an expert and ask her for yes/no decisions on satisfaction. This is feasible and correct though it is likely to positively (or negatively) bias the expert’s judgment since she sees the comment and the predicted label together. However we believe this is only as bad or misleading as accuracy figures in light of the low labeling consistency numbers. We present interesting experiments around this in Section 4.3.
2.3
Interpreting results
Our most important system development challenge was to output the results of the analysis (classification) in a manner understandable by various classes of business users. Reports at various granularity are expected, from detailed agent performance improvement clues for QAs and team leaders to birds eye views for senior management. Our solution included a full function BI product (IBM DB2 Alphablox) capable of generating a comprehensive set of graphical reports which could be canned or built-up by experts. BI reporting enables improving agent performance by pointing out areas of improvement and provide operational insights for better customer experience management. We provide details in Section 3.1.
2.4
Intervention and Interaction
A feedback loop assumes great importance in real-world industrial settings; automated analytics solutions need to build trust in and after deployment. A text classification system becomes significantly more useful and trustworthy if there is a mechanism to inspect class assignments to documents, as well as modify and correct them. Importance of trust and hence involvement of experts in text classification is unique to real world settings and absent in academic research. Interactivity and human review of text analysis system are not very well understood and limited research efforts [8] and [15] have addressed some bulk labeling and feature selection issues respectively. However these systems are research prototypes and we need to integrate interactivity and human review in all phases of a deployed text classification system. We felt the need for an interactive document labeling system to close the human-machine feedback loop. We proposed and built a tool called IBM TICL (Tool for Interactive text Classification and Labeling) that we present in Section 3.2. It is integrated in the architecture of our system shown in Figure 2. This labeling package acts throughout the system lifecycle: (1) it can be used to generate training data and (2) it can be used to inspect and correct system label assignments after deployment. The core functionality
Figure 2: System Architecture of ITACS in both cases remains that of a simple UI built on top of a learned model that predicts/assigns labels with some confidence to a set of unlabeled documents and presents them to the expert for validation. TICL also helps in updating statistical models based on user feedback. Next, we describe the system architecture in detail and address the challenges mentioned above. After fitting all pieces of the system together, we present some experiments in Section 4.
3.
SYSTEM DESCRIPTION
In this section we describe the architecture of ITACS in detail. We describe next the building blocks of the back-end classifier and its integration with the BI component. We describe the interactive labeling module in Section 3.2. In Section 3.3 we relate to some of the challenges highlighted above and show how ITACS overcomes them.
3.1
Architecture
ITACS is built of 3 independent but tightly coupled components; the classification engine, the database store, and the BI component. As shown in Figure 2 these are integrated with IBM TICL to address some of the issues from Section 2.1 and 2.4. We describe these components next.
3.1.1
Classification Engine
The heart of the system is a UIMA (Unstructured Information Management Architecture) based back-end that is a combination of statistical (Bayesian[13] and SVM[9]) and rule-based classifiers for text. UIMA is an open, industrialstrength, scalable and extensible platform for creating, integrating and deploying unstructured information management solutions. UIMA originated at IBM and is now open source4 . UIMA applications work as pipelines of annotators for text processing. Typical applications ingest plain text, identify named entities (persons, places, organizations) and relations (works-for or located-at), and do various other text mining annotations. Our novelty was development of the supervised classification engine as UIMA pipelines comprising loosely-coupled annotators. The engine has train and test capabilities and is executed as multiple pipelines shown in Figure 3.
arbitrary compositions of simple FEs in parallel or chained to each other. The first FEs on every parallel path work on the document text whereas subsequent FEs act as filters and work on extracted features. The second UIMA pipeline is used for feature selection. This is an optional corpus level operation to reduce data sparsity and try and increase separability among classes. We implemented standard feature selection methods like information gain and count/occurrence based methods. The list of selected features is stored on disk and the other features are removed from CAS objects. The third pipeline runs the actual classifier training algorithms and builds statistical models on stored CAS objects. We have implemented naive Bayes and have provided APIs that convert CAS objects to sparse vector representations that can be used in any 3rd -party classifier package. We have built hooks to popular Weka5 and SVM packages. The trained model is stored on disk and is used in the application phase to classify new documents. The single applier pipeline uses the stored selected features and models. Documents are again read using readers and passed through the same set of FEs to create CAS objects. The test CAS objects are now passed through specially tuned rule-based classifiers which are ordered collections[4] of regular expressions. These help overcome the challenge of accuracy for small classes mentioned in Section 2.2. An example of a sparsely populated class with business importance in contact centers is the ‘Sales Pitch’ class. Here customers complain about agents cross-selling or up-selling products/services and trying to meet time SLAs rather than solving problems. We could never garner enough training data to learn models for this class statistically. However QAs could easily define high precision rules such as presence of keywords and phrases like sell me, promote, upgrade my. Expectedly, such rule based classifiers have high precision and low recall; they could classify only a fraction (about 10%) of the documents. CAS objects which pass through the rule-set without getting classified are passed through the statistical models. They are updated with the assigned class labels. Finally, consumer components write CAS objects back to the databases or file system for future use. All configuration parameters like paths, feature selection method and size, annotator chains, and rule bases are managed through a set of plain XML-like text configuration files as per the UIMA architecture.
3.1.2
Database and BI reporting
In the first pipeline, text documents are read and features extracted with pre-packaged and custom written readers that read documents from databases (our implementation) or various file types. Documents are represented as Common Analysis System (CAS) objects and passed through Feature Extractors or annotators (FEs in Figure 3) such as tokenizers, stopword removers, n-gram extractors, namedentity annotators. Extracted features are added as annotations to the CAS objects. As shown, composite FEs can be
Post categorization, verbatims, label assignments and other relevant back-end interaction data is stored in a DB2 database. Such back-end data includes particulars of agents and teams interacting with the customer, date of interaction, target product or service, overall score assigned in feedback, agent training information, and other relevant enterprise information. BI tools are now used to produce interpretable graphical reports on the stored analyzed data. The database schema is a star or snowflake schema consisting of a fact table storing the actual comments and their categorization, and referencing a few dimensions. The idea is to store facts along different dimensions for cubing operations like slice and dice, rollup-down. To illustrate, the agent dimension has attributes like agent id, name, team lead id, team lead name
4
5
Figure 3: Integrated statistical and rule-based classification engine
http://incubator.apache.org/uima/
http://sourceforge.net/projects/weka/
with agent id as the primary key. This helps in analyzing agents across other dimensions like dates, labels, scores. The third component in ITACS is a BI tool which is used for visualization of data stored in the above star schema. Our customized reporting tool, IBM DB2 Alphablox, produces highly interactive graphs, charts, and reports showing correlations between various dimensions of analysis (agents, labels, scores, dates etc.) as shown in Figure 4. Using these reports users can see correlation between different data fields, drill-down and roll-up the cube views of data, and slice and dice to see different aspects of the analysis at varying granularity. A typical report could compare label distribution for under-performing agents of two teams over a few weeks, aggregated by satisfaction ratings. The agents can then be trained better depending on their assigned calldriver distribution to, say improve accent after undergoing training in voice-based helpdesks or be better at personalization while replying to emails. We believe a BI reporting goes a long way in providing interpretability of results in deployed text mining systems.
3.2
Interactive Classification and Labeling
We outlined two sets of challenges relating to interactivity in Section 2.1 and Section 2.4. The need was two fold; first, to assist domain experts in designing label-sets and building up training data sets for classification as in ITACS and second, to provide the trust factor required in manual review of the quality of label assignments at any stage in deployment. We developed an interactive document labeling interface called IBM Tool for Interactive text Classification and Labeling (TICL), freely available online6 . TICL is an interactive interface to train, validate, correct, and refine the classification process continuously. It aims to enable end users to start building text classification systems without knowing statistical or rule-based text classification. TICL attempts to bridge the gap between manual and automatic classification approaches combining the tunability of the former with the scalability of the latter. The TICL version available online can be used in stand-alone mode to create label-sets and training data using simple text configuration files. An expert can generate training data following active learning[7] principles to overcome some of the challenges mentioned in Section 2.1. A simple model built over a very small manually labeled training set can start off an expert in designing, tuning, and fixing a label-set prior to moving ahead with a deployment of ITACS. When integrated with ITACS according to the architecture shown in Figure 2, TICL addresses the issue of providing trust in deployed text classification scenarios by facilitating human review. The application part of ITACS comprises validation and inspection of classification results where a human expert can intervene and interact with the system. The expert can validate and even correct label assignments of comments. From any drill down operation (double-click) in any Alphablox grid or graph report, TICL is invoked as shown in Figure 4. When inspecting aggregate statistics and reports over batches of new (or old) comments, the expert can drill down and see the comments associated with any interesting portion of the graph seen. She can inspect comments and their labeling, even correct them and add re-labeled comments back for generating corrected reports. 6
http://www.alphaworks.ibm.com/tech/ticl
This interaction can even be used to feed revised perceptions of meanings of labels back into the system over time; since corrected document labels can be treated as new training data, the classifier can be re-trained with new evidence (labeled documents/verbatims). This feedback has been found to be especially useful in the training of good classifiers for minority classes over time. The user interface of TICL itself is very simple as shown and generates an HTML form listing sets of comments and their predicted labels. These can be accepted as they are or modified by experts and fed back, either just into the database for corrected reporting, or added as new training data to re-train classifiers. The interesting part of TICL is it’s flexibility since it is designed in a pluggable UIMA architecture. We would like to note here that TICL is packaged on the same classification engine described in Section 3.1. It is bundled with no rule-bases to start with but these can be quickly included in the classification flow as described.
3.3
Overcoming Challenges
We have described the architecture of the ITACS system and its sub-components. We now take a step back and see how they fit together in the light of the challenges described in Section 2. A text analytics solution based on classification in the services industry setting encounters problems at the outset with labels and labeling. We described our development and deployment efforts around TICL to tackle some of these problems. The next operational challenge is typically presented around accuracy and we described human satisfaction metrics (for measurement) and rule-based systems (for driving minority classes). Another operational business requirement is that of interpretable reporting; we presented the Alphablox BI component for reporting for consumption at various levels of the people hierarchy. We described other usage modes of TICL which enabled human review of data at any point in the lifetime of the system.
3.3.1
What’s new?
Our proposed system presents a first of its kind integrated C-Sat analysis tool comprising an end-to-end system based on text classification. The system can be adapted to other domains of unstructured data in service oriented and customer facing organizations with VoC data. It addresses all aspects of text classification systems starting from helping domain experts generate training data to human review of classification results via an interactive labeling interface. The proposed system offers a configurable combination of different classifiers with state-of-the-art performance. A BI reporting interface included in the system allows report generation that uses the result of the analysis along with structured data to draw valuable insights. We are not aware of similar existing solutions in the services industry setting.
4.
EXPERIMENTS
In this section we describe some of the experiments we conducted while designing and developing the ITACS system. We first describe the noisy text classification industrial datasets and give real examples of unstructured documents (in contact centers). Next, we describe feature noise, referring to our detailed study[1] and report some of the interesting results here. We then describe the problem of label noise arising out of human calibration issues, and describe experiments aimed at measuring this noise.
Figure 4: ITACS screenshots: BI reporting in Alphablox for deriving business insights; Integrated invocation of TICL for review and re-labeling of documents (optionally for re-training classifiers)
4.1
Datasets
for this jan only.
Table 1 summarizes the label-sets and documents made available to us over the span of a year. We would like to relate here to the stringent day to day operational pressures QAs work in. This is only evidence of how gathering real training data is laborious, slow, and tedious – a fact often discounted in the research community. Dataset CCFb1 CCFb2 CCFb3 CCSum1 CCSum2 CCMail
No. of classes 9 9 8 6 92 50 (600)
Total documents 2997 4597 3375 26264 26264 31746
Table 1: Contact center dataset summaries Our system was primarily designed for C-Sat analysis and our main data sources were C-Sat feedback forms. CCFb1, CCFb2, and CCFb3 are C-Sat analysis datasets comprising customer comments in feedback forms (examples in Section 1.1). They belong to contact center accounts of ecommerce, internet, and telecom companies respectively. Feedback to contact centers tends to be short, crisp, and often contains abusive remarks from customers. Many times the verbatims are very short in length, ambiguous, and noisy. CCSum1 and CCSum2 are call summary datasets in a Telecom company’s contact center. After every call, the agent summarizes the call in very short sentences; this is often very noisy with lots of spelling mistakes and abbreviations. The saving grace however from an informative features point of view is that abbreviations are usually common across agents. This two-level hierarchical dataset has 6 classes at the top level like Billing, Credit, Broadband - this is CCSum1. The second level dataset has more fine grained 92 classes and both these have the same 26264 summaries. Business applications necessitate considering the first level label-set as a different dataset for dashboard reporting. An example agent summaries with private data masked is (Agent1) /01/06/2005/ - SPK TO (CustName) BILL NOT RECD (PhoneNo) THE COMMUNICATED SLA TO SUBSCRIBER IS 02/06/2005 05:46:00 PM (Place1)COURIER (Place2) /2/6/2005 -D BILL DELVERD & RECIVED BY (Recepient) DATE 02/06/2005......(Agent2)
CCMail is a email classification dataset of a financial institution with over 600 categories. The process of handling email complaints in typical contact centers necessitates on the fly definitions of categories with obvious overlap and redundancy leading to a bad label-set from a classification perspective. We restricted our attention to only those 50 categories with over a 100 emails. An example email with masked private data is I am moving to (Place1) from (Place2) as i am going to join in FIG commodities division of (BankName) center office.Please send all my statements to the address which i shall confirm u before next week end.
If possible please send a statement dated 24th january by mail
to this mail id or to the following address where my parents resides
4.2
Feature noise
We carried out a detailed study[1] on feature noise on all the real life noisy datasets (table 1) we got access to as a part of the ITACS project. We wanted to see how much feature noise is in operational text classification settings in contact center/CRM settings and how much time we should invest in feature engineering and feature selection. Figure 5: Text classification results on contact center datasets
We report an important result of our study in Figure 5. For a host of real-life services industry datasets, we report text classification accuracies and discuss characteristics of these proprietary datasets described in Table 1. All accuracies we report are averaged over 10 random 70 : 30 train-test splits. We achieved 60.1% accuracy with multinomial naive Bayes (NBM with different feature set sizes) for CCMail and 65.6% with SVMs. For three different C-Sat datasets, we got accuracies of 58.3%, 47.9%, 47.6% for NB and 59.1%, 53%, 47.8% for SVMs respectively. Similarly SVMs(88.3%, 82%4) outperformed NB(85.9%, 80.4%) for the agent summary datasets CCSum1 and CCSum2 respectively. Text classification wisdom might find these accuracies low. However, we believe, it is more due to the challenges in measuring accuracy in real life classification setting (Section 2.2) and less about the classification techniques. We will describe some experiments next to reaffirm this. A unique kind of data we dealt with was speech transcript data. An abundance of voice calls is presently stored in contact center environments for regulatory requirements; but these are often left unprocessed. Automatic speech recognition (ASR) transcripts inspite of high recognition word error rates[1] is very useful in bringing this data into textual form. Text classification is a simple first step towards understanding and processing this data, usually followed by complex natural language processing and information extraction systems. The challenge in this data is that only valid English words are output by the ASR system and recognition rates of nouns is very low. For example, ‘the Heiwa Sogo Bank’ is a phrase in a Reuters-21578 article which is recognized by an ASR system as ‘high were so woman’. One of our contributions to the research community as part of our work with the services industry is a Reuters transcribed dataset. Available online7 , this dataset contains 20 documents each spoken and transcribed from the top 10 populous Reuters classes; these classes are often used to report text classification results. We hope availability of this small dataset is a first step in the direction of research towards handling this new kind of noise in real-world text mining applications. 7 http://kdd.ics.uci.edu/databases/reuters_ transcribed/reuters_transcribed.html
4.3
Label-sets, Labeling, and Label noise
We pointed out difficulties with the manual document labeling task in Section 2.1 and Section 2.4 stressed the need for interactivity between experts and a classification system throughout its lifecycle. We presented TICL as a first step toward alleviating some labeling issues faced by domain experts who did not know classification or data mining. Clearly more needs to be done before classification systems can automatically be built and adopted in real-world settings, but let us dwell upon some more labeling issues briefly.
Label-sets. In the C-Sat analysis setting, when QAs started interacting with us to deploy a text classification solution, their existing label-set was a starting point around which we decided to collect labeled training data. This label-set, practically, was a long list of classes intended to capture the sentiment of customer comments. The label-set was designed purely out of the QAs’ experience and often contained longunused, redundant, overlapping, and sometimes even irrelevant (over time) classes. Our first task was to force them to inspect each label and the label-set as a whole for inconsistencies, obvious repetitions, and possible merges. We forced them to write 2 line summaries of each label and this often cut out unused, irrelevant, and repetitive labels. This streamlining effort was greatly appreciated and we forced a simple process around human calibration described next.
Labeling. The next task was that of labeling documents and creating training data. One of the challenges here was deciding for or against a multi-labeled system. It was easy for QAs to label confusing instances as different classes at different points in time owing to different contexts and human factors. Allowing multi-labeled instances seemed the natural answer to this but we immediately saw pitfalls in terms of understanding results and BI reporting driven out of the proposed star-schema data store. It is not clear whether a comment pointing to, say, accent problems and rude behaviour of agents should be counted twice during reporting or stored only once in the database with a multi-valued label column. In the former case, overall dashboard reporting views go haywire and in the latter, there is a challenge working with existing BI products over such special multi-valued columns. In the light of this our clients almost always chose a uni-labeled system deployment though ITACS (and TICL) are implemented as multi-labeled systems with a label-set size of 1. Next, we present interesting results to bring out the problem of label noise arising out of inconsistency between human labelers.
Label noise. In a calibration exercise with a Telecom client’s contact center (not in Table 1), QAs had defined 31 classes for C-Sat analysis. Two experts independently labeled 200 comments with these classes. These experts repeated this exercise after a week (thinking they were labeling different comments). A statistical ANOVA Gauge Reproducibility and Repeatability (R&R)8 test was performed on these labellings. It turned out that repeatability (of an expert with herself) was only 65% and reproducibility (inter-expert consistency) stood at merely 53%. With such low calibration, the training data was deemed to be of poor quality, and 8
http://en.wikipedia.org/wiki/ANOVA_Gage_R&R
building a text classifier turned out to be demoralizing. Accuracy turned out to be unacceptably low, matching one human labeling 55–60% of the times. Inter-human disagreement has been studied before[6] though in the context of NLP tasks like word sense disambiguation but we believe our experience in text classification settings is unique and educating. We handled this issue, as mentioned earlier, by measuring human satisfaction on predicted labels. For another Telecom client account, we built a combination of naive Bayes and regex rule-based classifiers as described in Section 3.1. The classification engine was tuned with rule-sets for specific important low population classes. We carried out another consistency check similar to the R&R study above. In this account we had only one QA who managed all C-Sat analysis and human labeling. We trained our classification engine on about 5000 labeled comments. We had 1400 comments labeled by this expert as unseen test data. After more than a month, we asked the same expert to label the first 700 (out of 1400) comments again not revealing to her that these had already been labeled. In a uni-labeled setting, we found a consistency of only 74%. For the other 700 comments we let our tuned classification engine make predictions and we showed the user the comments and predictions together. The expert was asked to assign yes/no satisfaction ratings to these predictions, and she accepted over 85% of these. On inspecting the remaining comments with the expert, we concluded that the predictions made were appropriate (and acceptable for aggregate analysis) though not the best, and a better label existed in the label-set. This brings out again the multi-labeled nature of real-world data, and pegs acceptability of our system at about 85%. We had similar acceptance figures with other client accounts. The root problem in this domain is not feature noise, discussed before, as much as label noise. Multi-labeling clearly contributes to very low consistency rates, but there is a larger problem of bad label-set design and lack of a consistent labeling process. Such an observation is known to some extent to text classification practitioners and about 30% disagreement amongst expert human labelers is known[11]. In designing real-life systems, label noise emerges as a very important kind of noise to consider. We restrict further discussion on label noise here; it remains an important open avenue for future work. We would like to note here that domain specific efforts to improve operational text classification systems have been successful in dealing with feature as well as label noise to some extent[12]. This, however, requires significant care and cost not always possible.
5.
EXPERIENCES AND LESSONS
In this section, we share our experience of designing, building, and deploying a text mining based solution for the services industry, specifically our contact center clients. We have highlighted several unique challenges in Section 2 that we faced in taking text classification technology out into the field. Here we highlight a few other experiences and lessons learned in our client engagement; we hope these will help future research technology deployment efforts especially in the services industry context.
5.1
Goldmine of data and problems
Data (Text) mining researchers have started seeing services organizations like contact centers, as goldmines of new
types of data and problems. We too came across gigabytes of unstructured text data in call logs, transcripts, emails, feedback (all VoC channels) left unprocessed and unanalyzed. While structured data analysis, typically OLAP applications, helps process data and generate deep insights, text analytics is not very common. Text is often stored and left unprocessed either because of a lack of ‘trust’ of unstructured content or because of lack of in-house expertise required for text analytics. Most data is sensitive data about customers, hence it is never made public and doesn’t reach the general research community. However the unique research opportunities in dealing with services organizations and their data deserve to be bought out. In our research engagements in ITACS like projects, we were able to access this goldmine. For text classification in particular, C-Sat analysis data is very different from benchmark datasets like Reuters-21578 and 20-newsgroups. We encountered noisy, poorly formatted, wrongly labeled, multilingual datasets and blind application of state of the art techniques produced disastrous results. We had to get into issues of data cleansing and noise handling apart from getting down to all the issues related to labels highlighted in Section 4.3. We have been able to work extensively [10, 17, 1] in the area of Noisy Text Analytics primarily because of ITACS and other CRM and contact center projects.
5.2
C-Sat and beyond
Contact centers resemble manufacturing assembly lines; once processes are fixed, jobs and shifts are routine. They strive for operational efficiency to scale to large operations and cost efficiency to keep/move ahead of intensely growing competition while maintaining quality of service. These cost pressures narrow down forward looking windows of opportunity of moving up the value chain. ‘Short term’ benefits from tool deployments to make daily operations efficient are perceived to be more valuable than potential ‘longer term’ benefits that may or may not accrue from research engagements. Modeling and automating C-Sat analysis proved to be more than designing a text classification system as the concept and meaning of C-Sat varies across business scenarios. We had to be involved in understanding the domain, typical problems, common issues between customers and agents, separation of ownership of issues (between product/service seller and contact center), action-ability of issues etc. We interacted closely with QAs understanding operations, customer-agent interactions, and jointly designed experiments (of Section 4) to get our insights validated. When explaining text classification and benefits of C-Sat analysis automation, business users were very excited at possibilities of (1) hierarchical label-sets - for a wide spectrum of analysis, and (2) multi-labeled documents - they understood difficulty in assigning just one label to a customer comment. However, these were rarely implemented in client accounts because of challenges in defining label-sets and gathering training data. The most impacted business challenge was interpretable BI reporting; it was not clear how to handle the multi-labeled setting in reporting and this needs further investigation in implementation and tracking benefits. Business needs forced simple implementation of a flat single label setup. A non-technical challenge that stumped us was relating 85–90% accuracy (and satisfaction) levels to dollar bene-
fits and improved C-Sat ratings by customers. Impacting business outcomes is not directly in the hands of technical solutions. A system can only point out that an agent needs accent training, but actually imparting it to the agent and improving her customer handling requires some level of manual and process intervention. Transition management in such a project was more complex than that of software installation or upgrade. We also clearly learned that training programs were imperative to users of the system; if not used properly technical tools can never impact business, and success can not be declared by just technically achieving 85– 90% text classification accuracy.
6.
CONCLUSION
Impact. ITACS has been deployed for C-Sat analysis in e-commerce and telecom client accounts of large contact centers. QAs are using ITACS for analyzing operational data and identifying customer pain points, problematic products and agents’ shortcomings. Accuracy has been consistently measured around 85–95%. ITACS has also had other kinds of impact where systematic label-set design was greatly appreciated by business users and QAs and forced a process around label-set design. Quality operations also benefited greatly by forcing calibration exercises and our client is trying to establish a certification program around manual analysis for QAs. ITACS can be used not only for verbatim analysis but for analyzing any kind of textual data generated in contact centers and more generally customer facing services departments of organizations. We released IBM TICL as a first of its kind freely available interactive classification and labeling tool. We believe systems designed incorporating such technologies are necessary to provide intervention and interaction between systems and experts in an effective manner. We hope simple components like TICL drive awareness and adoption of smart classification systems in real-world settings.
Future Work. Among future directions, we are looking at automating the training process for ITACS for a new domain, at least partially. The vision is to develop a generic C-Sat mechanism, with standard class labels and a standard set of text features which can be tuned for a new deployment with a few button clicks. It will drastically reduce the time and cost of introducing automatic C-Sat analysis for an interested business. On the text classification side we plan to investigate label noise more systematically.
7.
REFERENCES
[1] S. Agarwal, S. Godbole, D. Punjani, and S. Roy. How much noise is too much: A study in automatic text classification. In Proc. of ICDM, 2007. [2] D. Blei, A. Ng, and M. Jordan. Latent dirichlet allocation. In Proc. of NIPS 14, 2002. [3] S. Chakrabarti, B. Dom, R. Agrawal, and P. Raghavan. Scalable feature selection, classification and signature generation for organizing large text databases into hierarchical topic taxonomies. In VLDB Journal, 7, pages 163–178, 1998. [4] V. Chakravarthy, G. Ramakrishnan, S. Joshi, S. Balakrishnan, and S. Godbole. Learning decision lists with known rules for text mining. In Proc. of IJCNLP, 2008. [5] P. Chan and S. Stolfo. Toward scalable learning with non-uniform class and cost distributions: A case study in credit card fraud detection. In Proc. of KDD, 1998.
[6] T. Chklovski and R. Mihalcea. Exploiting agreement and disagreement of human annotators for word sense disambiguation. In Proc. of RANLP, 2003. [7] D. Cohn, Z. Ghahramani, and M. I. Jordan. Active learning with statistical models. In Proc. of NIPS, 1995. [8] S. Godbole, A. Harpale, S. Sarawagi, and S. Chakrabarti. Document classification through interactive supervision of document and term labels. In Proc. of ECML/PKDD, 2004. [9] T. Joachims. Text categorization with support vector machines: learning with many relevant features. In Proc. of ECML, 1998. [10] C. Knoblock, D. Lopresti, S. Roy, and L. V. Subramaniam. Workshop on analytics for noisy unstructured text data. In conjunction with IJCAI-07. [11] D. Lewis, Y. Yang, T. Rose, and F. Li. Rcv1: A new benchmark collection for text categorization research. In JMLR, 361–397, 2004. [12] D. D. Lewis, R. Ghani, D. Mladenic, I. Moulinier, and M. Wasson. Workshop proceedings. In 3rd Workshop on Operational Text Classification (OTC), in conjunction with SIGKDD, 2003. [13] A. McCallum and K. Nigam. A comparison of event models for naive Bayes text classification. In AAAI/ICML-98 Workshop on Learning for Text Categorization, 1998. [14] K. Nigam, A. K. McCallum, S. Thrun, and T. M. Mitchell. Text classification from labeled and unlabeled documents using EM. Machine Learning, 39(2/3):103–134, 2000. [15] H. Raghavan, O. Madani, and R. Jones. Interactive feature selection. In Proc. of IJCAI, 2005. [16] C. J. V. Rijsbergen. Information Retrieval, 2nd ed. Dept. of Computer Science, Univ. of Glasgow, 1979. [17] S. Roy and L. V. Subramaniam. Automatic generation of domain models for call-centers from noisy transcriptions. In Proc. of ACL-COLING, 2007. [18] R. E. Schapire and Y. Singer. Boostexter: A boosting-based system for text categorization. In Machine Learning, 39(2/3):135–168, 2000. [19] V. A. Zeithaml, M. J. Bitner, and D. D. Gremler. The gaps model of service quality. In Services Marketing, pages 37–49. Prentice-Hall, 2002.