use of secondary sources, typical of data and text mining, is an opportunity not ...
We are working on original text mining procedures ..... Popping R. (2000).
Text Mining tools for extracting knowledge from Firms Annual Reports Simona Balbi, Agnieszka Stawinoga, Nicole Triunfo Dipartimento di Matematica e Statistica - Università “Federico II” di Napoli - Italy
Abstract This paper has been developed in the frame of the European project BLUE-ETS (Economic and Trade Statistics), in the work-package devoted to propose new tools for collecting and analysing data. In order to obtain business information by documentary repositories, here we refer to documents produced with non statistical aims. The use of secondary sources, typical of data and text mining, is an opportunity not sufficiently explored by National Statistical Institutes. NSIs aim at collecting and representing information in a usable and easy-readable way. The use of textual data has been still viewed as too problematic, because of the complexity and the expensiveness of the pre-processing procedures and often for the lack of suitable analytical tools. Our aim is to identify statistical linguistic sources by a deep analysis of one management commentary. From a methodological viewpoint, here we propose a tool for exploring relations between words at a micro-data level, derived from network data analysis, namely ego networks, applied together with lexical correspondence analysis.
Keywords : network analysis, BLUE-ETS project, lexical correspondence analysis
1. Introduction This paper has been developed in the frame of the European project BLUE-ETS, acronym for BLUE Enterprise and Trade Statistics, funded by the European Commission (7th Framework Programme). The project has three main objectives (www.blue-ets.istat.it): responding to a changing and growing demand for new and better data on business statistics; proposing costefficient improved ways to collect, disseminate, use and access data for both research and policy purposes; reducing the burden imposed by data collecting regulation on businesses. The use of secondary sources, typical of data and text mining, is an opportunity not sufficiently explored by National Statistical Institutes. NSIs aim at collecting and representing information in a usable and easy-readable way. The use of textual data has been still viewed as too problematic, because of the complexity and the expensiveness of the pre-processing procedures and often for the lack of suitable analytical tools. Our peculiar task in BLUE-ETS consists in proposing new methods for analyzing and collecting data. We are working on original text mining procedures for reducing response burden, making data collection cheaper and making possible to discover “non trivial” qualitative information, as outputs of our proposals. We apply this approach in analyzing documents produced by firms in their ordinary activities.
68
Simona Balbi, Agnieszka Stawinoga, Nicole Triunfo
In this paper we focus our attention on the possibility of identifying statistical linguistic sources by a deep analysis of the management commentary written by the world leader of eyewears, Luxottica. These statistical linguistic sources will be useful for a further analysis of management commentaries of listed companies on Italian market. In this paper we treat documental information in terms of relational data. We propose a strategy based on the joint use of Network Analysis and lexical Correspondence Analysis in order to identify relevant groups of words and explore their internal relations. By identifying the “concepts” we propose a tool for dealing with disambiguation, an important question in any Natural Language Processing task.
2. Correspondence Analysis and Network Analysis interactions: an open debate 2.1. Correspondence Analysis Correspondence analysis (CA) is a principal axes method usually applied for the analysis of contingency table. From a computational and mathematical viewpoint, CA is a simple technique and its success is mainly due to the attractiveness of its graphical representations. Greenacre (1984) gives the following definition: CA is “a technique for displaying the rows and columns of a data matrix (primarily, a two-way contingency table) as point in dual low-dimensional vector spaces”. According to Lebart et al (1998), CA is mainly characterized by: a symmetric processing of rows and columns; the use of a special weighted Euclidean distance, known as chi-square metrics; simple transition formulas allowing for a simultaneous representation of rows and columns (joint plot). Dealing with a lexical table T (I, J) which crosstabulates the I parts and the J terms of a corpus, CA is generally performed to identify the latent semantic structures in the corpus and to represent graphically the latent lexical relationships. 2.2. Network Analysis Network Analysis (NA) is the analysis of a set of relations among objects. Relations are not the properties of objects, but of systems of objects, in a larger relational system (Scott, 2000). Graphs are the tool for representing the relational system. In a graphical representation of a network, objects (vertices) are represented by points, and relations are drawn as lines connecting pairs of vertices. NA have found applications in many fields such as biology, economics, linguistics and, especially in the social sciences, where it is named Social Network Analysis, for the extraordinary increasing of attention in recent times, both from a methodological and applicative viewpoint. Popping (2000) defined Network Text Analysis as a method for encoding the relationships between words in a text and constructing a network of the linked words. The assumption is that language and knowledge can be modeled as networks of words and the relations between them. Several ways to derive networks from textual data and an overview of applications is presented in Batagelj et al. (2002).
Text Mining tools for extracting knowledge from Firms Annual Reports
69
2.3. CA vs. NA In literature, a wide debate has been carried out respect the use of CA analyzing relational data. Although, CA is included in the main packages for NA (see e.g. Ucinet, Pajek, …), many objections have arisen. Against the use of CA for representing the relational data, Borgatti&Everett (1997) claim that two-dimensional maps will almost always be severely inaccurate and misleading in visualizing links; moreover the distances are not Euclidean, yet human users of the technique find it very difficult to comprehend the maps in any other way. In our opinion, Borgatti&Everett’s first argument is related to the dimensionality reduction performed by CA and the common practice of referring only to the first factorial plane, when useful information can be obtained by factorial maps built on following axes. In addition, CA factors can not be only used for visualization. They can be helpful for interpreting and synthesizing the relational structure among objects. We have to consider a proper number of factors, which reconstruct the relational structure in a low dimensional space. Besides, CA gives a measure of the fitting of the data to the latent structure. Borgatti&Everett’s second point shows a misunderstanding. Chi-square distances between profiles can be observed in ordinary physical (or Euclidean) space, by transforming the profiles before plotting, or by stretching the plotting axes by different amounts, so that an unit on each axis has a physical length inversely proportional to the square root of the corresponding element of the average profile (Greenacre, 1993). One of the main supporters of CA for analyzing social relations is Bourdieu (1991). He states that NA reduces structure to interaction, while CA enables the extraction of latent relations, not directly visible. Therefore CA satisfies the requirements of relational thinking and the other class of relational methods should be rejected. Nevertheless, according to de Nooy (2003), CA cannot go in depth into the manifest relations, due to the dimensionality reduction and NA tools are indispensable, providing a way for representing actual relations. In this paper we want to enter the debate, showing that the effectiveness of the joint use of the two approaches can be helpful in textual data analysis. Our proposal is to investigate the neighborhood of terms, identified as “relevant” by CA, thanks to a peculiar tool of NA, the “ego networks”.
3. Our proposal 3.1. Lexical Correspondence Analysis The first step of our strategy consists in performing a Correspondence Analysis to identify the latent semantic structure in the lexical table. The data matrix we analyze is the lexical table T which is a contingency table crosstabulating the I parts and the J terms of a corpus. Its general element t(i,j) is equal to the number of times the term j is found in part i of the corpus. The interpretation of the results of CA comprises the understanding of both numerical and graphical results. CA decomposes an association measure, namely the F2, which represents the dispersion (variance) of the clouds of points (both in the space spanned by terms and in the space spanned by parts) around the common centroid defined by the independence hypothesis.
70
Simona Balbi, Agnieszka Stawinoga, Nicole Triunfo
The part of variance accounted for the a-th axis is given by the a-th eigenvalue, la, obtained by a generalized singular value decomposition of matrix T, with ortho-normalizing constraints. The singular value decomposition is given by: T=UΛVT and UTDI-1U=VTDJ-1V=I, where DI-1 is the marginal distribution of the parts of the corpus and DJ-1 is the marginal distribution of the terms. The proportion of variance ta accounted for by the a-th factor (ta=la/Sala) is a descriptive index of its importance. Note that the association measure F2 is equal to Sala . The number of factors to be retained is related to the sum of the inertia explained by the greater factors and in any case whose corresponding eigenvalues exceed the average. Other two measures are important in interpreting results of a CA: the absolute contribution and the relative contribution. Absolute contribution of an element to an axis indicates the proportion of variance explained by the element to the principal axis. It is given by the square of the coordinate multiplied by the frequency of the element. The relative contribution is a measure of the quality of the representation of a point on an axis, and it is given by the square cosine of the angle formed by the projection of the point on the principal axis and the vector joining the point to the center of gravity. We use these two different kinds of contributions to identify the relevant terms characterizing the latent semantic structure. 3.2. Network Analysis For the purpose of network analysis we need to dichotomize the lexical table T to obtain a binary matrix A (I×J) where the generic element a(i, j) (i = 1, …, I; j = 1,…, J) equals 1 if the term j occurred at least once in the document i and 0 otherwise. From the matrix A we derive the co-occurrence matrix W(J×J) by the product W=ATA. The element w(k,j) represents the value of co-occurrences of terms k and j; the w(j,j) is the total number of occurrences of term j. According to network analysis, the matrix W is an undirected weighted adjacency matrix which can be used to analyze the valued relations existing among terms. In order to normalize co-occurrences we introduce a well-known similarity index, namely the Jaccard index. According to this measure, the similarity between two terms k and j is defined as:
Sij =
wkj wkk + w jj − wkj
We obtain a symmetric matrix S(J×J) where the value of cell s(k,j) indicates the normalized measure of co-occurrences for terms k and j. Then to obtain a binary adjacency matrix X we dichotomized the matrix S as follows: for each s(k,j) with the value higher than a predefined
Text Mining tools for extracting knowledge from Firms Annual Reports
71
threshold we set the value of the element x(k,j) equal to 1 and 0 otherwise. The choice of the threshold value is based on the actual distribution of Jaccard index in the data. As we underlined above, we go to study relationships among terms which the corpus of management commentary consists of. For the purpose of the analysis we choose to investigate the ego networks which illustrate local areas of a whole network. An ego network arises by “extracting” from regular network data a network which consists of a focal node (“ego”), all actors connected to that node (“alters”), and all the connections among those other actors (Hanneman, Riddle 2005). Studying ego networks gives the possibility to understand the role that a node plays in a relational structure and provides some information about the network as a whole. 3.3. Joining CA and NA for textual data analysis To join CA with NA we choose the viewpoint of graphical representations, in order to represent both latent and manifest relations among words. Furthermore, we propose text mining tools for further analyses. In the CA phase we individuate the most relevant words as the intersection of two sets of terms CA and CR. CA consists of the terms with the highest absolute contributions on the first factorial plane, which are important in understanding the latent structure. CR consists of the terms with the highest relative contributions on the first factorial plane, which are the best represented. In the subsequent NA phase, we consider the intersection of CA and CR. The selected terms are chosen as the focal nodes for the further analysis. To visualize the relations existing among the focal nodes, we build a network. Using standard software for Network Analysis (e.g. Ucinet), we obtain a nice graphical representation by a spring embedding algorithm. Aiming to obtain a metric representation, consistent with the latent structure, we draw the network on the first factorial map. In addition, for each focal node its ego network is constructed to define concepts and terms linked to it, exploring the relations of each focal node with its alters (we do not analyze connections among the alters). This procedure can lead to different situations: if the textual base has been correctly preprocessed and manifest and latent relations are consistent, we obtain a metric representation of the network, and statistical linguistic sources can be built for further analyses. Inconsistencies can produce configurations difficult to be interpreted. For example, if the plot appears difficult to be read, problems such as disambiguation questions have to be investigated. In the following, we are showing examples of these situations.
4. Luxottica’s management commentary 4.1. Pre-processing Related to management commentaries, Italian law does not prescribe a defined structure. Differently, in the U.S. market, the law thoroughly explains all information that the management commentary must include. For this reason and for our aim, we choose a company listed on both markets: Luxottica group, the world leader of eyewears. Our reference year is 2009.
72
Simona Balbi, Agnieszka Stawinoga, Nicole Triunfo
The Luxottica’s management commentary is composed by 44 sections and 22,621 tokens. It is well-known that pre-processing has a crucial role and it influences the final results of any textual data analysis or text mining procedure. We perform the following strategy, using TalTac 2.10 software: STEP 1. The corpus is normalized, and cleaned by stop words, showing 4,315 types. STEP 2. The corpus is grammatically tagged, and the lexical-part-of-speech (nouns, verbs, adjectives) were selected. STEP 3. Graphical forms with attributes (VERB AND ADJECTIVE) and (NOUN AND ADJECTIVE), the words peculiar to economic language (using the linguistic resource included in TalTac) and the words with a high characterization in each one of the 44 sections (TF-IDF index (Salton and Buckley, 1988) higher than the average) are added. Note that STEP 3 is motivated by the high percentage (about 40%) of ambiguous forms (classic problem in text analysis). After these procedures, the corpus consists of 5,627 occurrences and 403 graphical forms. The lexical table used for further analysis is a rectangular matrix document-by-terms of dimension (44×403). 4.2. Results of Correspondence Analysis and Network Analysis We perform a CA on our lexical table, using the software SPAD. From a statistical viewpoint the scree plot shows that the first 10 axes represent the basic latent structure. They explain the 75% of the association in the table and each one with a percentage higher than the average. However, as our aim is not analyzing Luxottica management commentary from an economic point of view, but basically finding a map where to represent relations among words, we choose a more strict cutting point, focusing our attention on the first factorial plane (26%). In Figure 1, the first factor (14.5%) opposes the section related to economic performance (ANDAMENTO ECONOMICO) on the left, to the section devoted to the principal events happened during the year (PRINCIPALI EVENTI DEL 2009). The terms with higher absolute contributions show an opposition between the language used in describing the components of the annual report (vendita, periodo, milione, euro, utile, attività) on the left and terms describing economic events, (finanziaro, mercato, marchio, risultato) on the right hand.
Text Mining tools for extracting knowledge from Firms Annual Reports
73
Figure 1 – Correspondence Analysis First Factorial Plane
The second factor (11.4%) opposes the section related to the internal control, on the top (COMITATO PER IL CONTROLLO INTERNO) to the section describing the organizational aspects (ORGANIZZAZIONE DI LUXOTTICA GROUP e STATUTO, CODICI DI CONDOTTA, PROCEDURE), on the bottom. The terms individuating the control aspects are respectively controllo interno, comitato, esercizio, funzione. The organizational language is defined by sindaco, organizzazione, management. In this way we are able to define the semantic latent structures of the terms used in the management commentary. The next step of the procedure is to individuate the terms which will be treated as nodes in network analysis. For this aim we choose the terms with both the highest absolute contributes and the highest relative contributes. By the intersection of the 90th percentile of abolute contributions and the 90th percentile of the relative contributions we obtain 14 terms: area, attività, comitato, controllo_interno, esercizio, euro, funzione, milione, periodo, sezione, significativo, stati_uniti, utile, vendita.
74
Simona Balbi, Agnieszka Stawinoga, Nicole Triunfo
Figure 2 - Correspondence Analysis First Factorial Plane: the selected terms
The Figure 2 illustrates the best two-dimensional representation of the latent semantic structure in the corpus and the relative position of the selected terms, but it ignores the manifest links. To go in depth into the actual relations, we draw a network of relations among the terms (“focal nodes”) individuated by Correspondence Analysis. The network in Figure 3 shows three components: an isolate node (vendita), a component with 8 nodes and 14 links, a component with 5 nodes and 10 links (all the nodes are adjacent to each other).
Text Mining tools for extracting knowledge from Firms Annual Reports
Figure 3 The network of the selected terms
Figure 4 – The output of the proposed strategy
75
76
Simona Balbi, Agnieszka Stawinoga, Nicole Triunfo
The Figure 4 illustrates the effectiveness of our strategy of jointly using CA and NA.The 5-nodes component (comitato, controllo_interno, esercizio, funzione, sezione) has a good (readable) representation on the map and it can be used for building a lexical resource for further analysis of management commentaries, with respect to internal control activities. The 8-nodes component (area, attività, euro, milione, periodo, significativo, stati_uniti, utile) clearly shows linguistic problems: the terms attività, area and significativo are positioned far from the core of the network and needs to be explored. Let us consider the ego network built around the focal node area. In Figure 5 its “alters” are represented in the first CA factorial plane. Two different uses of the term “area” emerges. On the left side it is the alter “euro” which indicates a monetary meaning (“area euro”), while on the right side we find “area” as reference markets (Sud Africa, Europa, Australia). The interesting position of Stati Uniti and distribuzione opposed to wholesale. The reading of this component gives an other insight to the first factorial axis interpretation, in the sense of distribution channels.
Figure 5 –The alters of the focal node ”area” on the CA First Factorial Plane
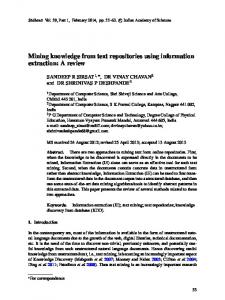
The isolated point vendita has the ego network illustrated in Figure 6. Here we can see that all the alters describe the firm activities (Luxottica, prodotto, marchio, mercato, finanziario, operativo, risultato, business, negozio, successo, vista, produzione, licenza, distribuzione).
Text Mining tools for extracting knowledge from Firms Annual Reports
77
Figure 6- The ego network of “vendita” – The numbers on the lines indicate the strength of the links in terms of co-occurrences
Figure 7 The alters of the focal node ”vendita” on the CA First Factorial Plane
78
Simona Balbi, Agnieszka Stawinoga, Nicole Triunfo
Exploring the ego network of the isolate node vendita with respect to the CA results (Figure 7), we can see some relevant meaningful words (Luxottica, marchio, mercato, finanziario, risultato, distribuzione) with a high absolute contribution on the first axes, but with a low relative contribution. At a first glance we see vendita opposite to its alters on the first axis. Although it is worth to further investigation, we suspect a repeated segment problem because of the high percentage of the collocation “punti vendita”. This meaning is emphasized by the manifest relations at basis of the ego network (Figure 6). The analysis of the CA results individuate the connection of the word vendita with the economical aspects of the firm activity.
5. Concluding remarks and further developments In this paper we show the effectiveness of the joint use of Correspondence Analysis and Network Analysis in textual data analysis, when we are interested to explore latent and manifest relations among terms in a corpus. The strategy we propose can be a tool for producing linguistic sources and identifying problems related to preprocessing and Natural Language Processing, namely disambiguation. Further developments of our research activity will be devoted to investigate the methodological links in terms of convergences and oppositions between the two main approaches for analyzing relational data. Another issue worth to be studied is the choice of metrics for textual data in building the similarity matrix and on the factorial planes (Balbi, 1995).
Acknowledgements This work is financially supported by the European Project BLUE-ETS. This paper derives by a strict and continuous collaboration among the authors. Anyway sections 1, 2.1, 2.3 and 3.1 may be mainly attributed to S. Balbi; sections 2.2, 3.2, 3.3 and 4.2 to A. Stawinoga; sections 4.1 and 5 to N. Triunfo.
References Balbi S. (1995). Non symmetrical correspondence analysis of textual data and confidence regions for graphical forms. In: Bolasco, S., et al. (eds.), Actes des 3es Journées internationales d’Analyse statistique des Données Textuelles. Vol. 2, CISU, Roma: 5–12 Batagelj V., Mrvar A. and Zaversnik M. (2002). Network analysis of texts. Paper online: http://nl.ijs.si/ isjt02/zbornik/sdjt02-24bbatagelj.pdf Bourdieu P. (1991) Introduction in Bourdieu P., Chamboredon J-C. and Passeron J-C. The Craft of Sociology. Walter de Guyter. Berlin. Borgatti S. and Everett M. (1997). Network analysis of 2-mode data. Social Networks, 19: 243-269. de Nooy W. (2003). Fields and networks : corresponding analysis and social network analysis in the framework of field theory. Poetics, 31: 305-327. Greenacre M. (1984). Theory and Application of Correspondence Analysis. Academic Press. London. Greenacre M. (1993). Correspondence analysis in practice. Academic Press. London. Hanneman R. and Riddle M. (2005). Introduction to social network methods. Riverside, CA: University of California, Riverside. http://faculty.ucr.edu/~hanneman/ Lebart L., Salem A. and Berry L. (1998). Exploring Textual Data. Kluwer Academic Publishers. The Netherlands.
Text Mining tools for extracting knowledge from Firms Annual Reports
79
Popping R. (2000). Computer-Assisted Text Analysis. Sage. London. Salton G. and Buckley, C. (1988). Term-weighting approaches in automatic text retrieval. Information Processing & Management, 24 (5): 513–523. Scott J. (2000). Social Network Analysis: A Handbook. Sage. London.