Text S1 - Additional Information. Sidhartha Goyala, Jie Yuanb, Thomas Chenc, Josh D. Rabinowitzb, and Ned S. Wingreend. aDepartment of Physics ...
Text S1 - Additional Information Sidhartha Goyala , Jie Yuanb , Thomas Chenc , Josh D. Rabinowitzb , and Ned S. Wingreend a
Department of Physics, b Department of Applied Mathematics, c Department of Chemistry, and d Department of Molecular Biology, Princeton University, Princeton, NJ 08544
I.
MODEL
We present here flux-balance analysis (FBA) for the four metabolic modules considered in the main text (MT). We also analytically calculate asymptotic expressions for growth rate and pool size for the linear-chain module including feedback. Furthermore, complete analysis of the feedback knock-out strain is also presented here. A.
Linear Chain
The flux-balance condition at steady state for the linear-chain module shown in Fig. 1 of the main text is given by g = V.
(1)
This along with the linear constraints on input flux and growth rate, V ≤ Vmax g ≤ gmax ,
(2)
yield the following for the FBA growth rate, � gFBA =
Vmax , gmax ,
Vmax ≤ gmax Vmax ≥ gmax
(3)
where gFBA is the maximum allowed growth rate consistent with all the constraints. Including feedback regulation, the kinetic equation for the metabolite-pool size p is dp Kh p = Vmax h − gmax , dt K + ph p + p?
(4)
where p is the metabolite-pool size, h is a Hill coefficient and K is an inhibition constant. The steady-state pool size therefore satisfies Vmax
h+1
=⇒ (p/K)
Kh p = gmax h +p p + p?
Kh
+ (p/K)(1 − V˜ ) − V˜ p? /K = 0
(5)
where V˜ = Vmax /gmax . It is straightforward to calculate the asymptotic behavior of p in the two asymptotic FBA regimes: flux-limited (V˜ � 1) and growth-limited (V˜ � 1). We assume a large feedback-inhibition constant K � p? , this yields V˜ � 1 p? V˜ , p≈ (6) ˜ 1/h KV , V˜ � 1 where p is the steady-state metabolite pool; we keep terms to leading order in K. In the Vmax -limited regime, i.e. where V˜ � 1, the growth rate is Kh K h + ph � � ph ≈ Vmax 1 − h K
g = Vmax
(7)
2 where we have used p � K. This yields for the growth-rate deficit g ∆g = 1 − gFBA ph ≈ Kh p?h = V˜ h h . K
(8) (9) (10)
In the gmax -limited regime, V˜ � 1, where p ∼ K, the growth rate is p g = gmax p + p? � � p? ≈ gmax 1 − , p
(11)
yielding for the growth-rate deficit ∆g ≈ =
B.
p? p p? . K V˜ 1/h
(12)
Bidirectional pathway
The flux-balance condition at steady state for the bidirectional module shown in Fig. 3 of the main text is given by c1 g = V1 − 2U12 + U21 c2 g = V2 − 2U21 + U12 ,
(13)
where c1 , c2 give the stoichiometry of utilization of the two intermediates. These along with the linear constraints on input fluxes, V1 ≤ V1max V2 ≤ V2max U12,21 ≤ Umax , are used to calculate maximum growth-rate gFBA , first for V1max /c1 ≤ V2max /c2 max h max � �i V1max V2 V1 +Umax 2 1 , ≤ − U + max c1 c1 c2 c1 c2 gFBA = h max � �i max max V2 V max 1 2 2V1 +V2 , ≤ 1c1 ≤ 2c1 +c2 c2 − Umax c1 + c2
(14)
(15) V2max c2 .
Due to symmetry, the FBA growth rate for V1max /c1 ≥ V2max /c2 can be found by exchanging the 1 ↔ 2 indices. The above calculation assumes growth is limited by nutrients; if the growth is limited by gmax , then gFBA = gmax . C.
Metabolic cycle
The flux-balance condition at steady state for the metabolic cycle shown in in Fig. 4 of the main text is given by cQ g = VN − U (cE − cQ )g = 2U − VN
(16)
where cQ , cE are the stoichiometry of utilization of glutamine and glutamate, respectively. The growth rate is maximized within the following linear constraints on fluxes, VN ≤ VNmax U ≤ Umax ,
(17)
3 which yields
gFBA =
VNmax cQ +cE ,
VNmax cQ +cE
≤
Umax cE
Umax cE ,
VNmax cQ +cE
≥
Umax cE .
The above calculation assumes growth is limited by nutrients; if the growth is limited by gmax , then gFBA = gmax . D.
Integration of two different nutrient inputs
The flux-balance condition at steady state for the carbon-nitrogen module shown in Fig. 1 of the main text is given by cC g = VC − VN1 , cN g = VN1 + VN2 ,
(18)
where we have included facors cC , cN giving the stoichiometry of utilization of the two intermediates. Assuming the following linear constraints on input fluxes, VC ≤ VCmax VN1 ≤ VNmax 1 VN2 ≤ VNmax , 2 yields the FBA optimal growth rate V max C cC , V max +V max C N2 , gFBA = cC +cN max max VN1 +VN2 , cN
VCmax cC
≤
VNmax 2 cN
VNmax 2 cN
≤
VCmax cC
VCmax cC
≥
�
1 cC
≤
+
(19)
�
1 cN
1 cC
�
+
1 cN
�
VNmax + 1
+ VNmax 1
VNmax 2 cN
(20)
VNmax 2 cN
The above expressions apply if growth in limited by nutrients, otherwise the growth rate is limited by gmax , i.e. gFBA = gmax . Model for feedback knock-out strain. In the feedback knock-out (KO) strain, the negative feedback from glutamine on its own biosynthetic enzyme glutamine synthetase is absent. The module describing the KO strain is the basic carbon and nitrogen combining module without the feedback on the carbon-dependent nitrogen input flux VN1 . Furthermore, we allow leakage out of the cell from the nitrogen intermediate pN . This yields the following kinetic equations for metabolite pools pC and pN , dpC KC −g = VCmax − VNmax 1 dt KC + pC dpN KN2 pN = VNmax + VNmax − VL − g, 1 2 dt KN2 + pN KL + pN
(21)
where h is a Hill coefficient (assumed for simplicity to be the same for all feedbacks), the Ki , with i = C, N1 , N2 , are feedback-inhibition constants, and the growth rate g is given by Eq. 2 in MT. The auto-regulatory negative feedback on carbon flux and the leakage of pN ensure a steady state, which is guaranteed to be stable by the 1:1 stoichiometry (Goyal and Wingreen, 2007). II. A.
EXPERIMENTS Nitrogen starvation
One prediction from our analysis is that large changes in metabolite pools will occur upon the onset of nutrient limitation. Such large changes in metabolite-pool sizes have recently been observed in nutrient switching experiments
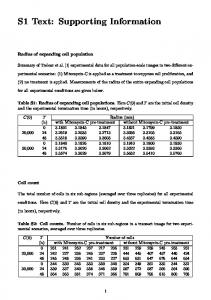
4 with Escherichia coli (Brauer et al, 2006). When cells growing on filters were moved from a minimal media (no nutrient limitation) agar plate to a no NH+ 4 (nitrogen limited) agar plate, the glutamine pool (a nitrogen intermediate) decreased by almost 64 fold, while the pool of α-ketoglutarate (a carbon intermediate) increased by almost 16 fold (Fig. 1). Furthermore, the changes in metabolite pools were monotonic over short times (. 1 hour). However, pools of other metabolites such as ATP and glutamate, which are known to fulfill other functions in cell, did not change much after the nutrient switch (ATP serves as the energy currency of the cell and glutamate is the dominant counter-ion for potassium). Despite the complexity of the real metabolic network, we find that our simple module for combination of carbon and nitrogen predicts pool size dynamics qualitatively similar to the measurements (see Fig. 1 inset). To make the analogy between our simple module and the real metabolic network, we identify our carbon intermediate pC with α-ketoglutarate and our nitrogen intermediate pN with glutamine. As a simulation of the experiment, we start the carbon-nitrogen module in steady state in the non-nutrient limited regime, and at time t = 0, reduce the input nitrogen availability by simultaneously reducing tenfold the two maximum input nitrogen fluxes VNmax and VNmax . The 1 2 metabolite pools then evolve dynamically as per Eq. 7 in MT. Consistent with the experimental data, the carbon intermediate pool pC increases monotonically while the nitrogen intermediate pool pN decreases monotonically before approaching new steady states. Note that the consistency between simulations and the experimental data degrades at long times (& 1 hour). In order to understand such long-time behavior of the metabolite pools one would have to include the effects of genetic regulation on the various enzyme concentrations.
B.
Nitrogen up-shift
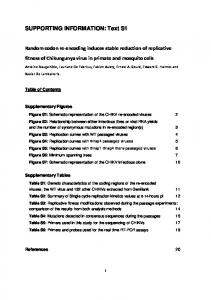
Interestingly, the leakage of key nitrogen intermediates, glutamine and glutamate, in the feedback-defective strain following nitrogen upshift depends on the nitrogen source used in the media. Particularly, both glutamate and glutamine leak for ammonia as nitrogen source while only glutamine leaks out for proline (also see Kustu et al., 1984) as nitrogen source (Fig. 3). In cells growing in proline media, synthesis of glutamate from glutamine is suppressed as proline directly substitutes for glutamate. Consequently, the metabolic cycle between glutamine and glutamate is broken in the proline media, i.e. the reaction from glutamate to glutamine is active and the reaction from glutamine to glutamate is inactive. Therefore, in the feedback-defective strain, following nitrogen upshift in proline media, additional glutamate (coming from proline) is readily converted into glutamine leading to large production of glutamine. However, in ammonia media, the full metabolic cycle is active and therefore both glutamine and glutamate are synthesized at high rates following the nitrogen upshift.
1
2
3
4 5
6
7
8
9
10
11
Bajad SU, Lu W, Kimball EH, Yuan J, Peterson C, et al. (2006) Separation and quantitation of water soluble cellular metabolites by hydrophilic interaction chromatography-tandem mass spectrometry. J Chromatogr A 1125: 76-88. Bennett BD, Kimball EH, Gao M, Osterhout R, Van Dien SJ, Rabinowitz JD (2009) Nature Chemical Biology Absolute metabolite concentrations and implied enzyme active site occupancy in Escherichia coli. Nat Chem Biol. 8: 593-599 Brauer MJ, Yuan J, Bennett BD, Lu W, Kimball EH, Botstein D, and Rabinowitz JD (2006) Conservation of the metabolomic response to starvation across two divergent microbes. PNAS 103: 19302-07 Goyal S and Wingreen NS (2007) Growth-induced instability in metabolic networks. Phy Rev Lett 98:138105 Gutnick D, Calvo JM, Klopotowski T, Ames BN (1969) Compounds which serve as the sole source of carbon or nitrogen for Salmonella typhimurium LT-2. J Bacteriol 100: 215-219 Kraml CM, Zhou D, Byrne N, McConnell O (2005) Enhanced chromatographic resolution of amine enantiomers as carbobenzyloxy derivatives in high-performance liquid chromatography and supercritical fluid chromatography. J Chromatogr A 1100: 108-115 Kustu S, Hirsehman J, Burton D, Jelesko J, and Meeks JC (1984) Covalent modification of bacterial glutamine synthetase: physiological significance Mol Gen Genet 197:309-317 Ikeda TP, Shauger AE, and Kustu S (1996) Salmonella typhimurium apparently perceives external nitrogen limitation as internal glutamine limitation. J Mol Biol. 259(4): 589-607 Lu W, Bennett BD, Rabinowitz JD (2008) Analytical strategies for LC-MS-based targeted metabolomics. J Chromatogr B Analyt Technol Biomed Life Sci Nogle LM, Mann CW, Watts WL, Jr., Zhang Y (2006) Preparative separation and identification of derivatized betamethylphenylalanine enantiomers by chiral SFC, HPLC and NMR for development of new peptide ligand mimetics in drug discovery. J Pharm Biomed Anal 40: 901-909 Soupene E, van Heeswijk WC, Plumbridge J, Stewart V, Bertenthal D, et al. (2003) Physiological studies of Escherichia coli strain MG1655: growth defects and apparent cross-regulation of gene expression. J Bacteriol 185: 5611-5626
5 12
13
14
Wohlhueter RM, Schutt H, and Holzer H (1973) Regulation of glutamine synthetasein vivo in E. coli. In The Enzymes of Glutamine Metabolism, Prusiner S and Stadtman ER. (eds) pp 45-64. Academic Press, New York, USA Yan D, Ikeda TP, Shauger AE, and Kustu S (1996) Glutamate is required to maintain the steady-state potassium pool in Salmonella typhimurium. PNAS 93(13): 6527- 6531 Yuan J, Bennett B, Rabinowitz J (2008) Kinetic flux profiling for quantitation of cellular metabolic fluxes. Nature Protocols 3: 1328 - 1340
III.
FIGURES
64
pC
256 4
Fold change
Fold change during nitrogen starvation
16
1
16 1
pN
1/16
0
1/4
4
8
16
12
Time (AU)
α−KG ATP Glutamate Glutamine
1/16
1/64
0
1
2
3
4
5
6
7
8
Time (hours)
FIG. 1: Changes in key metabolic pool concentrations in E. coli under nitrogen starvation. Upon nitrogen starvation, α-ketoglutarate (α-KG) (a carbon intermediate) increases monotonically, while free glutamine (a nitrogen intermediate) decreases monotonically, while ATP (derived from carbon metabolism) and free glutamate (a nitrogen intermediate) do not change more than twofold for times . 1 hour (Brauer et al, 2006). Inset: Fold changes in the carbon and nitrogen intermediates pC and pN after the maximum input nitrogen fluxes VNmax and VNmax are reduced tenfold in our carbon-nitrogen module (Eq. 7 in Main Text). The input 1 2 fluxes before nitrogen starvation are VCmax = 3, VNmax = VNmax = 1.5, the growth-saturating concentrations are 1 2 ? ? pC = pN = 1, and the feedback-inhibition constants are KC = KN1 = 100, KN2 = 1000.
6
NH3
glucose
cytoplasm
(A)
KG
extracellular cytoplasm
(B)
NH3
GDH
NH3
glucose
extracellular
NH3
GDH -GLN -GLU
-GLN -GLU
KG
GLU
GLU
2x
2x
GOGAT
+GLN, PII -KG
-ASP -GLN
-GLN +PII-UMP
GLN
GS
-ASP -GLN
GS
GS
UMP
GOGAT
AMP
GLN
+GLN
PII
PII -GLN
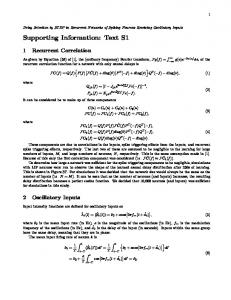
FIG. 2: Key elements of carbon-nitrogen metabolism for (A) WT and (B) feedback-knockout ∆glnE (FG 1114) stains of E. coli. Metabolites: KG - α-ketoglutarate, GLU - glutamate, and GLN - glutamine. Enzymes: GDH - glutamate dehydrogenase, GOGAT - glutamate synthase, and GS - glutamine synthetase. The regulation of reactions by metabolites is mentioned in red (green) representing negative (positive) regulation.
(A)
(B)
FIG. 3: Excreted nitrogen intermediates, glutamine and glutamate, in the ∆glnE (FG 1114) feedback knockout (KO) strain following a nitrogen upshift. The extracellular nitrogen intermediates are measured for two different nitrogen sources - ammonia (N) and proline (P) at t = 0 and t = 30 min after the nitrogen upshift is applied. (A) Glutamine found in media. (B) Glutamate found in media.
7
256
ΔglnE, glutamine ΔglnE, glutamate
64
ΔglnE, α−KG WT, glutamine WT, glutamate WT, α−KG
Fold change during nitrogen upshift
16 4 1 1/4 1/16 1/64 1/256 −30
−20
−10
0
10
Time (min)
20
30
40
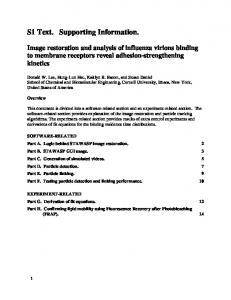
FIG. 4: Fold changes in key metabolite pools for feedback-knockout ∆glnE (FG 1114) and WT strains of E. coli under nitrogen upshift. Following the upshift, the trends in the pool size changes of the carbon-intermediate, α-ketoglutarate (α-KG) and the nitrogen intermediates, glutamine and glutamate, are qualitatively similar for the two strains. However, the changes in both α-KG and glutamine are strongly amplified in the feedbackknockout strain (black curves) compared to the WT strain (gray curves).
WT, low nitrogen WT, high nitrogen
Normalized OD
650
10
1 0
50
100
150
200
250
300
350
Time (mins)
FIG. 5: Normalized growth curves for WT strain of E. coli. At low ammonia concentration (2mM NH+ 4 ) in the media, the growth rate decreases after t = 190 min when the available nitrogen becomes limited (dashed curves). No such decrease is observed in high ammonia concentration (10mM NH+ 4 ) in the media (solid curve).