Sep 20, 2002 - correlation and is named the Disorientation Correlation Function (DCF). ..... along with the directionality of the surface topographic defects.
9/20/02, 4:41 PM
Submitted to Metallurgical & Materials Transactions A
Texture Clustering and Long-Range Disorientation Representation Methods: Application to 6022 Aluminum Sheet P. S. Lee, H.R. Piehler, A. D. Rollett and B. L. Adams Abstract Two new graphical methods are presented for microstructural analysis of crystalline material. These analyses are intended to aid an understanding of deformation behavior at scales larger than the grain size. The correlation of orientation over large distances has rarely been investigated since long-range correlation has been assumed to be negligible, if present at all. The first method reveals orientation clustering by calculating the variance of the orientation distribution function. The second addresses orientation ordering or orientation autocorrelation and is named the Disorientation Correlation Function (DCF). We show that both analyses can be derived from the two-point auto-correlation functions of the orientation field. Keywords: Disorientation Correlation Function, variance, strain inhomogeneity, and orientation distribution 1
Introduction
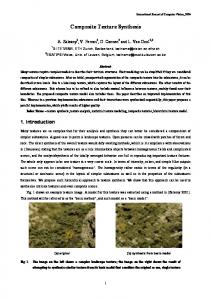
The materials science of polycrystalline materials begins with the premise that quantitative representations of microstructure determine material properties and performance. There exists a rich complexity of microstructure in these materials, and progress in relating microstructure to properties depends upon understanding those aspects of microstructure that are pertinent to the properties of interest. In the case of linear properties, such as elastic stiffness, thermal and electrical conductivity, thermal expansion, etc., rigorous bounds on properties are known to have first-order dependence upon phase and phase-orientation distribution, by volume fraction. Refined bounds on linear properties are known to depend upon higher-order details of microstructure, such as the spatial placement of phase and orientation, in addition to volume fractions [1]. Two-point phase and orientation correlation functions are known to carry first-order information about spatial placement. From 2-point correlation functions, substantially narrowed bounds on linear properties have been recovered [1,2]. Volume fraction distributions and the 2-point correlation functions are readily recovered from experimental characterization of crystallographic orientation (texture) by the new method known as Orientation Imaging Microscopy (OIM) [3,4] or automated electron back-scatter diffraction (EBSD). In an OIM system, the sample is tilted by 70 degrees with respect to the incident electron beam. For each pixel in an OIM map, the electron beam in spot mode generates an electron back-scattered Kikuchi pattern. By automatically analyzing the Kikuchi pattern obtained from all the pixels in the inspection window, a map with detailed local orientation information is generated. Only single-phase polycrystals are of interest in this paper, and thus we refer to the 2-point orientation correlation functions as "orientation correlation functions" or OCFs. In a broad context, OCFs have been studied since 1987 [5,6,7]. The motivation for this paper is a study of the development of surface roughness during plastic deformation of aluminum sheet, specifically age-hardenable alloys based on the AlMg-Si system that fall under the 6xxx series of commercial alloys [8]. In this study, an attempt was made to relate the spatial characteristics of the surface roughening to the microstructure (including texture) of the material. Spectral analysis of the surface height data
1
9/20/02, 4:41 PM
Submitted to Metallurgical & Materials Transactions A
consistently shows maxima at wavelengths that are several multiples of the grain size. This suggested that the spatial organization of the grain orientations might be an important factor in understanding this aspect of the complex phenomenon represented by surface roughening. Surface roughening at the grain size (length) scale is commonly referred to as “orange peel” and is ascribed to variations in the hardness of individual grains. There are, however, several observations in the literature of length scales associated with orange peel being multiples of the grain size. These observations thus motivated an interest in more analytical approaches to quantifying long range effects in texture beyond the conventional examination of misorientation distributions which, of course, quantify only the nearest neighbor relationships. This paper introduces new projections of the 2-point correlation representations of polycrystalline microstructure. One of these quantifies the tendency of grains of similar orientation to cluster together. The second quantifies the tendency of grains of similar orientation to be distributed in a regular fashion, i.e. on a lattice. Thus the first projection considers the relationship between the variance of the orientation distribution, Var(g,w), and the OCF. Here g refers to a specified subset of the complete fundamental zone of orientation types that occur in natural polycrystals, i.e. a particular texture component, and w specifies the geometry of the representative volume from which the variance is of interest, i.e. the size and shape of the volume within which a cluster is considered to exist. Thus, Var(g,w) denotes the variance of volume fraction for crystallographic orientations of type g when sampling randomly placed representative volumes of geometry w. The importance of Var(g,w) is that it can be used to quantify clustering of a given texture component in the material. A more precise definition is given later. The second new projection is called the disorientation correlation function (DCF). This function describes a normalized average disorientation of 2-point pairs separated by fixed distance and direction. By "disorientation" we mean the rotation angle of minimum magnitude taken from the set of rotations that convey one lattice into exact coincidence with another (misorientation), where the two lattices are separated by a specified vector. The usefulness of this projection of the OCF is in the description of orientation coherence, without reference to specified orientation, over distances large as compared to the grain size. This projection (DCF) was inspired by the calculation of auto-correlation maps of surface height data. The DCF can be extended by adding an orientation filter in order to assess the contribution of specific texture components to the (unfiltered) DCF. In section 2 we give more precise definitions for Var(g,w) and the DCF in terms of an ensemble of polycrystals. Exemplary calculations are shown in section 3 for 6022 T4 aluminum sheets which illustrate the presence of particular aspects of orientation clustering and spatial correlation as a function of the strain history of the material. 2
Definitions
2.1
Definition of Var(g,w)
The polycrystal is modeled as an aggregate of crystallites occupying a region, W, of the threedimensional space. At the mesoscale these crystallites have finite volume, containing identically oriented material. x indicates each material point corresponding to any particular crystallite. The local structure at x is represented at the mesoscale by a rotation g(x) of a
2
9/20/02, 4:41 PM
Submitted to Metallurgical & Materials Transactions A
specified reference crystal. The active rotation g may be represented as an orthogonal matrix, an axis-angle pair, or any other valid representation of rotation. Two indicator functions, Q(x) and cg(x) are defined with reference to Fig. 1. Ï 1 if x Œ w ( xc ) à W Q( x ) = Ì otherwise Ó 0 Ï 1 if x associates with g à SO(3)/ G cg ( x ) = Ì otherwise Ó 0
(1)
(2)
Thus, w(xc) is the subregion of the material sample volume, W, over which the orientation determination is performed and is centered on x c. SO(3)/G is the fundamental zone of physically distinctive lattice types; i.e., SO(3) is the group of proper rotations in 3D space and G is the point symmetry subgroup of the crystal lattice [9]. The g denotes that portion of the fundamental zone that is of interest; thus, Var(g,w ) refers to the variance of that mesostructural component whose orientations belong to g within the observation window defined by w. ‘fgw ’ is defined as the fraction of the observation window w that associates with g in any particular element of the ensemble. g is typically defined as a particular texture component together with those orientations lying within a specified orientation distance (disorientation) of that component. The normalized variance, Var(g,w), is defined as follows.
fgw 2 - fgw
Var(g , w ) =
2
(3)
fgw
Note that the first term in the numerator is known as the texture strength in the limit that all physically distinct orientations, and the entire volume of the polycrystal is included in the average. The line, area or volume fraction, fgw, can be defined using the two indicator functions given in Eqs. 1 and 2.
fgw =
1 Q( x )c g ( x )dx vol(w ) ÚÚÚ W
(4)
By taking the ensemble average of both sides,
fgw =
1 Q( x ) c g ( x ) dx vol(w ) ÚÚÚ W
(5)
Provided that the ensemble exhibits statistical homogeneity, then
fgw = c g ( x ) = ÚÚÚ f1 (g)dg
(6)
g
where f1(g) is the ODF and dg is the appropriate volume element (invariant measure) in orientation space. In a similar calculation, the quadratic term in Eq. 3 becomes
3
9/20/02, 4:41 PM
Submitted to Metallurgical & Materials Transactions A
fgw
2
=
1 vol(w )2
ÚÚÚ ÚÚÚ Q( x )Q( x ¢ ) c W
g
( x ) cg ( x ¢) dxdx ¢
(7)
W
With the assumption of statistical homogeneity, the above equation becomes
fgw 2 =
1 vol(w )2
ÚÚÚ F (g ,g r) ÚÚÚ Q( x )Q(x + r)dxdr 2
R
(8)
W
where R is the set of all vectors r that are contained within the probe region w. The two-point function in the integrand is related to the two-point orientation coherence function previously defined by Adams et al. [5], f 2(g,g’|r), by double integration over the range of orientations considered:
F2 (g ,g r) = ÚÚÚ ÚÚÚ f2 (g, g¢ r)dgdg ¢ g
2.2
(9)
g
Definition of Disorientation Correlation Function (DCF)
Among all the symmetrically equivalent misorientations, the one with smallest magnitude, i.e. the smallest angle in an axis-angle representation, is called the disorientation (Dg). It is the disorientation that is generally taken to be physically meaningful. The minimum angle of rotation, qdis, is given by -1 1 q dis = Dg AB = min ÏÌcos -1 trace gB ( gA ⋅ Scrystal ) - 1 ¸˝ Ó ˛ 2
[ (
) ]
(10)
Scrystal is a member of the set of linear operators, G, representing crystal symmetry. (In this paper the set G comprises the 24 proper rotations of the cubic point group 432.) g A is the lattice orientation in matrix form associated with the point A at position (x,y), and g B is the lattice orientation associated with the point B at (x+a, y+b). The disorientation correlation function describes the general (disorientation) dependence between the orientation of one position with the orientation at another position. It provides information about the spatial relation and dependence of the orientation data, hence it is similar to the Auto-Correlation Function (ACF) or Areal Auto-Correlation Function (AACF) described for analyzing surface topographic data [10]. The average disorientation with a fixed relocatable vector corresponds to a modified version of the orientation coherence function (OCF) introduced by Adams et al. [5] in the following manner. The two-point OCF, f2(g,g’|r), in Eq. 9, is defined as the probability density function of outcomes of the following procedure. Randomly locate point p inside the polycrystalline specimen, and point p’ at p+r. Point p falls in a crystallite of orientation g and p’ falls in a crystallite of orientation g’. The following relation holds for f2(g,g’|r):
f (g, g¢ r) = f (g,g ⋅ Dg r),
g¢ = g ⋅ Dg
(11)
The joint probability density of misorientation Dg at the ends of the vector r is defined with 4
9/20/02, 4:41 PM
Submitted to Metallurgical & Materials Transactions A
(
)
the function, G Dg r .
Ú f ( g,g ⋅ Dg r )dg
G (Dg r) =
(12)
SO(3) / G
(
)
The function, G Dg r is the probability density that the relocatable vector r will intersect
(
)
orientations at its endpoints with misorientation D g. When G Dg r is integrated over the complete fundamental zone of misorientations, G\SO(3)/G, the result is equal to one. A disorientation distribution with positional information is defined by the function, , that computes the average disorientation angle, qdis, for a given choice of a relocatable vector, r, where the range of integration is over the fundamental zone of physically-distinctive misorientation types, G\SO(3)/G as before:
fr =
Ú
q
gŒG\ SO( 3) / G dis
⋅G (Dg r)dDg
(13)
where the magnitude of the disorientation angle is given above, Eq 10. When the magnitude of r is smaller than the average grain size, this function mostly indicates the intra-grain disorientation distribution, or intra-grain orientation dispersion. When the magnitude of r is on the order of the average grain size, the function yields a correlated disorientation distribution function, and when the magnitude of r becomes much larger than the average grain size, it becomes the uncorrelated disorientation distribution function. These features are readily illustrated in 2-D space when r can be varied over this range. In order to visualize as a map of intensity in r space, discretization and simplification of the input data file was followed by calculation and normalization of . The integrals for average disorientation correlation are replaced by sums over the pixelized OIM data. Intensity in the DCF map, , is the average minimum disorientation of two-point pairs separated by a given vector r, which can be represented as (a,b). When an average disorientation is calculated with a small separation vector most of the pairs of points at the ends of the vector fall in the same grain resulting in a deep well centered on the origin. Figure 2 shows the average disorientation as a line profile where the origin of the x-axis corresponds to the origin for the separation vector (a,b). The well structure at the center of the DCF is detrimental for visualizing the profiles in the high misorientation region. Therefore the result, f(), is truncated as defined below, where P is the maximum value of a, and Q is the maximum value of b whose choice is discussed below. N -P -1 M -Q-1
  ( Dg ) AB
fr
†
=
a
(14)
b
(N - P -1) ¥ (M - Q -1)
Ïp f(fr )=Ì Ófr
5
if f r if f r