Since 2007, the Silvretta Archaeological Project in the high Alps on the Swiss-Austrian border has ... Due to legal regulations, af- ter pansharpening all channels ...
TEXTURE SEGMENTATION AS A FIRST STEP TOWARDS ARCHAEOLOGICAL OBJECT DETECTION IN HIGH-RESOLUTION SATELLITE IMAGES OF THE SILVRETTA ALPS K. Lambers, I. Zingman
1. PROJECT BACKGROUND AND GOALS Since 2007, the Silvretta Archaeological Project in the high Alps on the Swiss-Austrian border has been investigating the prehistoric origins of alpine pasture economy. In an area of about 540 km2 more than 20 well-preserved archaeological sites associated with alpine pastoralism have been recorded, the earliest of them dating to the Iron Age (Reitmaier (ed.), 2012; Walser and Lambers, 2012). All of the ruined huts, cellars and livestock enclosures at these sites are visible on the surface and show a limited range of shapes and proportions. According to their function, all of them are located in open grassland. Based on this sample, we are currently developing methods to detect archaeological objects of the kind described above in high-resolution satellite images of our study area (Lambers and Zingman, in press). These methods are intended to assist archaeological survey in vast and/or difficult to access areas by screening large amounts of remotely sensed images in order to detect possible archaeological sites prior to fieldwork (Cowley, 2012). Our general approach aims at assessing the probability of the presence of objects of our interest based on geometric cues that can be automatically detected in the satellite and aerial images that we use. We here describe our general methodology and the first integral step constituting a new approach to texture segmentation. 2. IMAGE DATA We use GeoEye-1 satellite images of our study area captured on September 6, 2011. These images feature a panchromatic channel and four colour channels (RGB + NIR) with a spatial resolution of 0.41 m (pan) and 1.64 m (VNIR), respectively. The bundle product that we ordered comprises the panchromatic channel and pansharpened colour channels. Due to legal regulations, after pansharpening all channels were downsampled to a spatial resolution of 0.5 m pixel size. This is also the spatial resolution of our second image data set, a Swisstopo orthophoto of our study area based on aerial images taken between 2005 and 2008. While lower than that of most aerial images, a spatial resolution of 0.5 m still allows for the detection of structures pertaining to our target objects. Their characteristic size varies roughly between 10 to 100 pixels. Their walls are generally two pixels wide or more. Reliable detection of structures of a few pixels in width is very limited, and in some cases it might not be achievable at all. However, in our case the second dimension of walls, whose length is usually above 10 pixels, makes this task still possible. 3. GENERAL METHODOLOGY Our method is designed to assess the probability of the presence of archaeological objects of the type described above in a given area based on their geometric properties. Such structures can be modelled as linear features that meet at approxi-
mately right angles. In our approach, image features of growing size and complexity are extracted in several stages. In the first stage, local features such as black and white blobs stemming from the background are extracted from the image. This stage can be implemented by means of white or black top-hat transforms (Soille, 2003) or their combinations. Chains of blob features with possible gaps in between may form linear features. During the second stage, we group extracted blobs into larger, approximately linear features that may correspond to the walls of ruins of huts and enclosures. Nearright-angle intersections of linear features that may be defined by corner points are then searched in the next stage. Evidence of structures of interest can then be inferred from extracted linear features and other contextual keys, if available, for instance surrounding texture. The output of the last stage is a probability map indicating the presence of objects of interest. Such a map will have zero values at most regions, and a continuous range of probability values at other regions. This map can be further thresholded at the level corresponding to an acceptable rate of false detections. For our general approach to succeed, it is essential to discriminate between smooth and high contrast texture regions in our images. This is the first step of our approach that is already implemented and that we describe in the following. 4. MORPHOLOGICAL TEXTURE CONTRAST (MTC) TRANSFORMATION Texture is generally associated with repeated changes in image grey level. In remotely sensed images such as the ones we use in the Silvretta region, high contrast textures are, for example, forests or urban areas (Figure 1). Large amounts of local features are usually extracted in texture areas in the first stage of the described methodology. This is because the local operator does not distinguish isolated features, like blobs or lines, from features that belong to a texture. Grouping at the following stages does not suppress these features since they are easily grouped with other surrounding texture features, resulting in unexpected false detections. To overcome this problem in areas such as forests, urban areas or rocky mountains, we developed a new texture detector that filters out high contrast textured regions irrespective of texture type. Since the objects of our interest are located in open grassland, i.e. outside the above-mentioned areas, this procedure reduces the number of false detections without affecting sensitivity to true examples. The approach that we introduced recently (Zingman et al., 2012) is called Morphological Texture Contrast (MTC) transformation since it is based on mathematical morphology, which has proven to be very efficient in the processing of remotely sensed images (Soille and Pesaresi, 2002). In comparison to many other texture detection approaches developed to discriminate different types of texture, the MTC transformation is insensitive to texture
Texture segmentation as a first step towards archaeo. object detection in high-res. satellite images (Silvretta Alps)
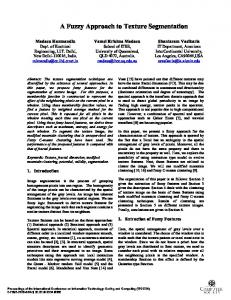
Figure 1: Pan-chromatic image of 4000 × 3500 pixel size and 0.5 m pixel resolution captured by the GeoEye-1 satellite c ( GeoEye 2011, distributed by e-GEOS).
Figure 2: Top: A 1D signal composed of two textured regions and two isolated features on the right side. Middle: the green signal is an upper texture envelope, the red dashed-line signal is a lower texture envelope. Bottom: The MTC transformation. It is proportional to texture contrast and yields suppressed response at isolated features. Note that the salient feature on the top of the left texture (in the middle) is also suppressed.
properties except of texture contrast. It is intended to discriminate smooth regions corresponding to our regions of interest from regions with high contrast texture, such as forests, urban or rocky areas in remotely sensed images. An essential property of our detector is the ability to provide a low response at isolated or individual features, even if they are of a high contrast, a result that is currently not achieved by other techniques. The MTC transformation is based on morphological alternating filters, namely morphological closing followed by opening and opening followed by closing (Serra 1988, Soille 2003). These operators are usually used for the suppression of noise in images. We use these operators to build a transformation proportional to texture contrast. The MTC transformation is obtained by taking non-negative values of the difference between mor-
Figure 3: The MTC descriptor applied to the GeoEye image shown in Fig. 1.
Figure 4: The segmentation result as obtained by automatic thresholding of the MTC descriptor superimposed on the GeoEye image shown in Fig. 1. Brownish areas correspond to high contrast textured regions, greenish areas to low contrast textured regions.
phological closing followed by opening and opening followed by closing. Negative values of the difference are substituted by zero values at the output of the MTC. This transformation results in high response at textured areas and low response at isolated features and in smooth regions. While in our project the MTC transformation is applied to 2D images, the underlying idea is more easily explained by using an artificial 1D signal as shown in Figure 2. The MTC transformation measures the difference between the upper and lower envelopes of texture providing a response proportional to texture strength. These envelopes, obtained using alternating morphological filters, coincide at isolated features, resulting in a suppressed response at such features. This capability of the MTC
K. Lambers, I. Zingman
transformation is not available in other approaches. Figure 3 illustrates the MTC transformation applied to the 2D satellite image of 0.5 m resolution shown in Figure 1. High response, corresponding to bright grey values, is generated in texture areas, while low response is produced in smooth areas and at isolated features. The distribution of grey levels in the transformed images is highly bi-modal, with one mode corresponding to texture regions (high grey tone values) and the other to smooth regions (low grey tone values). These two modes can easily be separated by finding an appropriate threshold. This provides us with a segmentation that defines two disjoint masks for texture and smooth areas. We used the Otsu thresholding method (Otsu 1979) to find an appropriate threshold automatically. This approach corresponds to an unsupervised classification scheme since input data does not need to be labelled. The segmentation result in Figure 4 is superimposed on the initial image to emphasize the alignment of the results with the original data. As can be seen, the segmentation is quite accurate at the borders of texture regions. So far, our tests show the MTC transformation to be relatively fast. An image of 6100×5000 pixels is processed in about 21 seconds by our code written in Matlab installed on a standard PC equipped with an Intel Core2 Quad 2.83 GHz processor. This processing time corresponds to a square analysis window of 40×40 pixels. Our technique does not require parameter tuning except for a single scale parameter that defines the size of the analysis window. This parameter should just be roughly adjusted to the characteristic size of texture. For remotely sensed images, it is related to their spatial resolution and the distances between objects on the ground. The technique is robust to illumination changes within the image and also works well with images from different sources. Though our technique was developed to analyse remotely sensed images, its application is not limited to this type of data. 5. SUMMARY AND OUTLOOK We have identified more than 20 sites in the Silvretta region with ruins associated with alpine pastoralism. These sites are currently serving as examples for the development of automated methods to detect similar sites in high-resolution satellite images. Using a texture segmentation technique that we recently
developed, we segment the images into regions of interest and other regions based on texture contrast. This step is a prerequisite for object detection, for which further steps have yet to be developed. By filtering out textured regions where no archaeological objects are to be expected, our approach will greatly reduce false detections.
REFERENCES C OWLEY DC. 2012. In with the new, out with the old? Autoextraction for remote sensing archaeology. In Proceedings of SPIE 8532, Remote Sensing of the Ocean, Sea Ice, Coastal Waters, and Large Water Regions, doi:10.1117/12.981758. L AMBERS K, Z INGMAN I. in press. Towards detection of archaeological objects in high-resolution remotely sensed images: the Silvretta case study. Accepted for publication in Proceedings of the 40th Conference on Computer Applications and Quantitative Methods in Archaeology (CAA), Southampton, UK, 26-30 March 2012. OTSU N. 1979. A threshold selection method from graylevel histograms. IEEE Transactions on Systems, Man and Cybernetics 9: 62–66. R EITMAIER T. (ed.). 2012. Letzte Jäger, erste Hirten: Hochalpine Archäologie in der Silvretta. Chur: Archäologischer Dienst Graubünden. S ERRA J. 1988. Image analysis and mathematical morphology: theoretical advances. Academic Press: London. S OILLE P. 2003. Morphological image analysis: principles and applications. Springer: Berlin. S OILLE P, P ESARESI M. 2002. Advances in mathematical morphology applied to geoscience and remote sensing. IEEE Transactions on Geoscience and Remote Sensing 40: 2042–2055. WALSER C, L AMBERS K. 2012. Human activity in the Silvretta massif and climatic developments throughout the Holocene. eTopoi – Journal for Ancient Studies, special volume 3: 55-62. Z INGMAN I, S AUPE D, L AMBERS K. 2012. Morphological operators for segmentation of high contrast textured regions in remotely sensed imagery. In Proceedings of the IEEE International Geoscience and Remote Sensing Symposium, Munich, 22-27 July 2012: 3451-3454. IEEE. DOI:10.1109/IGARSS.2012.6350678.