*Magma Design Automation, Santa Clara, CA 95054. Abstract - This paper describes an efficient threshold-based filtering algorithm (TFA) for calculating the ...
TFA: A Threshold-Based Filtering Algorithm for Propagation Delay and Output Slew Calculation of High-Speed VLSI Interconnects S. Abbaspour, A.H. Ajami*, M. Pedram, and E. Tuncer* Dept. of EE Systems, University of Southern California, Los Angeles, CA 90089 * Magma Design Automation, Santa Clara, CA 95054
Abstract -
This paper describes an efficient threshold-based filtering algorithm (TFA) for calculating the interconnect delay and slew (transition time) in high-speed VLSI circuits. The key idea is to divide the circuit nets into three groups of low, medium and high complexity nets, whereby for low and medium complexity nets either the first moment of the impulse response or the first and second moments are used. For the high-complexity nets, which are encountered infrequently, TFA resorts to the AWE method. The key contribution of the paper is to come up with very effective and efficient way of classifying the nets into these three groups. Experimental results show that on a large industrial circuit using a state-of-the-art commercial timing analysis that incorporates TFA, we were able to achieve delay and slew estimation accuracies that are quite comparable with the full-blown AWE-based calculators at runtimes that were only 14% higher than those of a simple Elmore-delay calculator.
1
Introduction
As the CMOS process technologies scale down towards nanometer regions, the accuracy and efficiency of gate propagation delay and interconnect delay calculation become more critical to the successful timing closure of the integrated circuit design flow. This is mainly due to the rapidly increasing circuit speeds, the rising chip temperatures, and the growing weight of the various parasitic effects in the modern designs. Circuit delay in VLSI circuits consists of two components: the delays of electrical signals through the wires (known as the interconnect propagation delay) and the 50% propagation delay of the driving gates (known as the gate propagation delay). Consider the circuit in Figure 1. The overall delay from output pin A of gate G1 to the output pin C of the gate G2 (which will be referred to as the stage delay) is written as the sum of the interconnect delay from output pin A to the input pin B of gate G2 and gate propagation delay from input pin B to the output pin C of the gate G2: Delay AC = Delay AB + DelayBC
(1)
This stage delay definition is used due to the fact that the error in estimating the input slew of a gate does not reflect as a dramatic error in the output slew of that gate. Therefore, according to this definition, the stages can be considered independent from each other [1]. The most efficient method to calculate the interconnect delays in VLSI circuits is by using the first moment of the impulse response, also known as the Elmore delay, which is an upper-bound on the 50% propagation delay in RC trees [2]. To improve the accuracy of the Elmore delay, higher order moment matching techniques and model-order reduction methods have been employed [3], [4], [5]. Indeed, the higher-
order moment matching methods can result in a very high accuracy for RC trees while being much faster than the SPICE [6] simulation. However, state-of-the-art EDA tools should be able to calculate the path delay and propagated slew very efficiently [7], [8], i.e., in nearly linear time in the size of the RC tree. This is mainly because of the scale of such calculations both in terms of the number of RC tree configurations that must be processed in a large complex design in order to complete its timing calculation and the number of times such calculations must be repeated during the circuit optimization flow in order to achieve a high quality design solution. Even the fastest higher-order moment matching techniques is quite inefficient to be employed in the static timing analysis engines of high-capacity EDA tools. Therefore, despite its inherent, yet well-known and welldocumented, shortcomings of the Elmore delay (cf. [10]), the runtime efficiency of the Elmore delay calculator makes it the top choice of delay calculation schemes in many of the commercial tools both during the front-end and back-end optimizations.
A
C
B G2
G1
Figure 1: General delay model of an RC tree driven by a CMOS gate and driving other gates.
The gate propagation delay can be divided into two terms: the intrinsic gate delay and the (extrinsic) gate load delay. The intrinsic gate delay arises from the native characteristics of the CMOS transistors as switching devices in the gates whereas the gate load delay accounts for the timing effect of the load of a logic cell on its input-to-output switching speed. Clearly, the intrinsic gate delay is equal to the gate propagation delay under zero load conditions. Figure 2(a) depicts a CMOS gate, which drives a purely capacitive load (CL), where one of its inputs switches with a signal transition time of Tin causing a change in the output of the gate. The gate propagation delay is a function of the input transition time and the output load. In commercial ASIC cell libraries, it is usual to characterize different output transition times (e.g. 10%, 50%, and 90%) as a function of the input transition time and output capacitance by:
tθ = fθ (Tin , CL )
(2)
In VDSM technologies, the effect of interconnect resistances on the gate load delay should not be ignored. Using the sum of all gate and interconnect capacitances (known as the total-capacitance method) as the capacitive load of a logic cell tends to yield very pessimistic gate load delay estimates [8]. A better approximation for an nth order RC load (i.e., one with n distributed capacitances to ground) as seen at the output node of a logic cell is to use a second order RC-π model [11], [12]. From the RC-π load, the timing analysis engine can calculate an appropriate capacitance (known as the effective-capacitance method) as the load for gate delay calculation and input-tooutput slew propagation [13], [15]. Among the various sources of error that affect the accuracy of a path delay calculator, the most important factor is the error in slews. The reason is that if the input slew of some gate or interconnect segment on the path is miscalculated, this error will potentially not only propagate to the path of the output, but is also exacerbated along the path because of the strong dependency of the output slew and delay of the gate or interconnect on the input slew. Thus, it is important to have a delay calculator that is capable of accurately calculating slew rates along a path. 90%
CL
10%
t10% t50% (a)
160 140 120 100 80 60
40 20 0
-20 -40 -60 0
200 400
600 1000 1200 1400 1600 1800 Stage800 Delay (ps)
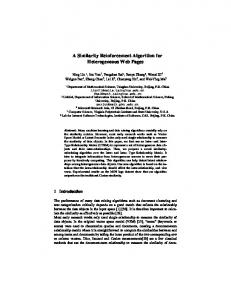
Figure 3: Percentage of stage delay error versus stage delay.
50%
Gate/Cell
The amount of stage delay error is very dependent on the methods used for calculating the gate and interconnect delays. A comparison between the Elmore and the AWE methods for interconnect delay and slew calculation for a commercial highperformance 90nm design (with 120,000 gates for all of its 1,674,342 delay stages) is depicted in Figure 3. For the gate delay calculation, we used the total-capacitance method to determine the output load value.
Stage Delay (ps)
V(v) Tin
Regardless of all this, the fact remains that the early interconnect load estimates can be quite coarse. Therefore, using an elaborate timing analyzer that provides highly accurate delay estimates, albeit at a high computational cost, is in fact overkill.
Stage Delay Error (%) Stage Delay Error (%)
where θ denotes the percentage of the output transition time, tθ is the output delay with respect to the 50% point of the input signal, and fθ is the corresponding delay function.
t(s)
t90% (b)
Figure 2: (a) A gate driving a capacitive load, (b) explanation of tθ.
Most EDA tools use a progressive refinement approach combined with local optimizations to complete physical design of a target circuit. Local design iteration loops comprising of a number of optimization steps are commonplace. Global design iteration loops are possible but undesirable due to the cost of such iterations and the dangers of design closure failure [7]. Many of the design decisions made during these local optimization steps closely rely on the results of a static timing analysis engine to determine the circuit delay in general and the timing-critical paths in particular. Early in the physical design process, there is a lot of uncertainty about the exact locations of logic cells, the routing, and the I/O assignments. As a result, the interconnect capacitance values that are used at this early stage tend to exhibit a high degree of inaccuracy. That is in fact why statistical wire load delay models were proposed in the first place and were heavily used until a few years ago, when it became clear that the only way to get timing closure on a highperformance circuit design is to adopt a progressive refinement approach whereby the early design planning (including netlist partitioning, macro-cell placement, top-level routing, etc.) and detailed netlist optimizations (including cell selection, buffering, gate and wire sizing, etc.) go hand in hand.
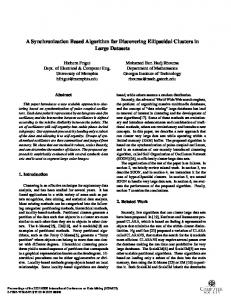
In Figure 4, we report the gate delay calculation error versus the interconnect delay calculation error of the same stages for this industrial design. Although, for the two scenarios that we compare here, we use the same gate delay calculation method and the same output load calculation method as described above (total-capacitive-load based gate delay), there is a noteworthy difference in gate delay results of the scenarios, which is due to the error in propagated slew rates in the circuit as a result of differences in the interconnect slew calculation of previous logic stages in the circuit. We therefore conclude that the timing analysis engine should accurately calculate not only the interconnect delays, but also the propagated slew in the interconnect lines. This paper presents TFA, a threshold-based filtering algorithm for propagation delay and output slew calculation of high-speed VLSI interconnects. The TF algorithm partitions the circuit nets into three net groups based on their top-level characteristics: one group of nets – called low complexity nets - lend themselves to accurate delay calculation with the Elmore delay whereas the second and third groups of nets – called medium and high complexity nets – demand more sophisticated and time-consuming delay calculations based on the first two or three moments of the impulse response, respectively. The idea of dividing the circuit nets into different classes for the purpose of minimizing the computational workload of a delay calculation engine while providing an accuracy guarantee for the computed delays is quite intuitive and straight-forward. The key challenge, however, is in being able to do the examination and classification of the nets accurately. This is precisely what we accomplish in this paper by our signature-based sifting algorithm as will be shown later.
The remainder of this paper is organized as follows. In section 2, by using the circuit theory, a new analytical equation for calculating the delay and output slew of an interconnect line under step and ramp inputs is presented. Section 3 uses this analytical equation as a signature function to sort the nets into simple and complex ones. Experimental results are reported by implementing the filtering algorithm as part of a high-capacity, state-of-the-art static timing analyzer and running it on a high performance and large VLSI circuit design. Detailed results are provided in Section 4, followed by conclusions in Section 5.
2
Analysis of the Threshold-Based Filtering Algorithm
As stated previously, to correctly calculate the stage delays, both the interconnect delay and the input slew should be taken into consideration. Recall that the ratio of the output voltage, Vo(s), to the input voltage, Vi(s), for a linear time-invariant (LTI) system is called the voltage transfer function, H(s). For an RC tree, this ratio can be written as: V (s) 1 H ( s) = o = Vi ( s ) 1 + a1s + a2 s 2 + a3 s 3 + ...
(3)
= 1 + m1s + m2 s 2 + m3 s 3 + ...
where mi is called the ith moment of the voltage transfer function. The negative of the first moment, -m1, is also called the Elmore delay [1]. In lower frequencies, the effect of m2 and m3 are negligible and it is thus safe to disregard them. However, in VDSM technologies, because of the high frequencies, the effect of the higher order moments cannot be neglected. For a one-segment RC interconnect line, the voltage transfer function may be written as:
t RC − t (e RC + − 1) Tr RC Vo (t ) = t −Tr t RC − − T (e RC − e RC + r ) RC Tr
Gate Delay Error ( ps)
(T
T far (α % − β %) =
t > Tr
near (α % − β %)
)
2
100 − α + Elmore × ln( ) 100 − β
2
(7)
where Tfar and Tnear denote the transition times at the far and near ends of the RC segment and Elmore denotes the Elmore delay of the corresponding node. Note that Tnear(0%-50%)=Tr/2. For example, the 10% to 90% output slew is: T far (10% −90%) =
(T
) + ( 2.197 × Elmore ) 2
near (10% −90%)
2
(8)
The 50% propagation delay is: delay = T far (0%−50%) − Tnear (0%−50%)
(9)
2
T 2 T = r + ( Elmore × ln(2) ) − r 2 2
Vo
Vi
60 40
(6)
Equation (6) shows that if two distinct one-segment RC circuits, with different input transition times have the same Tr/RC, then their t/RC values will also be equal. This fact indicates that the Tr/RC value is a key characteristic of the delay calculation, and interestingly, one of the most important factors in determining the degree of accuracy of an Elmore delay calculator. It has also been shown that for an RC tree, the output slew can be computed as [16]:
80
Y=X
20 0 -20
Figure 5: An RC tree where an input voltage Vi is applied and Vo is the output pin.
Y= -X
-40 -60
0 < t ≤ Tr
-15 -10
-5
0
5
10
15
20
As shown below, for an RC tree, considering only the first order moment in delay calculation implies that the second order moment is the square of the first moment, which is not always true because of the shielding effect of the wires.
25
Wire Delay Error(ps)
Figure 4: Gate delay error of stage delay versus wire delay error of the same stage.
V (s) 1 = H (s) = o Vi ( s ) 1 + RCs
~
H (s) =
(4)
= 1 − sRC + s 2 ( RC )2 − s 3 ( RC )3 + ...
where the second moment is equal to the square of the first moment. The output slew from the α% transition point to the β% transition point for a unit step input can be written as [16]: 100 − α Output _ slewα %− β % = RC ln (5) 100 − β If a unit ramp input with rise time of Tr is applied to such an RC segment, then the output voltage can be written as:
1 2 3 = 1 + m1s + m1 s 2 + m1 s 3 + ... 1 − m1s
(10)
For a typical circuit, Figure 6 shows that m2/m12 for an RC ladder is usually smaller than one. However, in general, this ratio varies from a number smaller than 1 to almost 50 (cf. Figure 7). Therefore, by considering the first two moments, equation (10) changes as follows: ~
H (s) =
1 2 1 − m1s + (m1 − m2 ) s
(11) 3 1
2
3
= 1 + m1s + m2 s + (2m1m2 − m ) s + ...
As a result, the output slew may be approximated as:
T far (α % − β %) =
(T
near (α % − β %)
) + ( Elmore × γ 2
α %− β %
)
2
(12)
where γ is a function of m2/m12. For a general second order system, when applying a step input to the system, γ is a linear function of m2/m12, which is accurately estimated as follows:
γ α %− β % = λα % − β % ( where:
m2 m12
) + κα % − β %
(13)
λα % − β % = λβ % − λα % γ α %− β % = γ β % − γ α %
much as 43% whereas the 70% output transition time changes only slightly. Based on (11), considering only the first two moments is equivalent to assuming that the third moment is equal to 2m1m2-m13. Interestingly, the output transition times are not sensitive to m3/(2m1m2-m13) as much as they are sensitive to the m2/m12. When m3/(2m1m2-m13) becomes larger than a critical value, the AWE method should be used to find the delay and slew.
(14) m /m 2 2 1
κα % − β % = κ β % − κ α % 1.10 1.05
m2/m 2 1
1.00 0.95
0.90
55 50 45 40 35 30 25 20 15 10 5 0
0
50
100 150 200 250
300 350 400 450
Elmore Delay (ps)
0.85
Figure 7: The distribution of m2/m12 for RC trees and ladders in the 90nm design testcase.
0.80 0.75 0
50
100
150
200
250
Elmore Delay (ps)
Figure 6: The distribution of m2/m12 for RC ladder interconnects in the 90nm design testcase.
The advantage of this method is that it only depends on m2/m12. For a general second order system, the values of γ and κ are calculated and shown in Table 1. For instance, to find the value of γ for 10% to 90% of the output transition, one can use: m γ 10%−90% = (1.4571 − (−0.6936))( 22 ) + (0.8455 − 0.7990) m1 (15) m = 2.1507( 22 ) + 0.0465 m1 Table 1: λ and κ values for the output transition points
Output transition point
λ
κ
Elmore
10% 20% 30% 40% 50% 60% 70% 80% 90%
-0.6936 -0.7755 -0.7813 -0.7131 -0.5739 -0.3569 -0.0232 0.4939 1.4571
0.7990 0.9986 1.1380 1.2239 1.2670 1.2732 1.2272 1.1155 0.8455
Ln(10/9) Ln(10/8) Ln(10/7) Ln(10/6) Ln(10/5) Ln(10/4) Ln(10/3) Ln(10/2) Ln(10/1)
From Table 1, it is obvious that the 30% to 90% transition time is very sensitive to the m2/m12 fluctuations. The interesting point in this table is the 70% output transition time. It can be seen from Table 1 that the 70% point in not sensitive to m2/m12. This shows that, for example, in order to calculate the 70% point delay, there is no need to compute the second moment, m2. As a result the Elmore-based timing analysis is very accurate for this special case. Figure 8 shows this scenario for different values of m2/m12. The output waveform confirms that the 70% point is insensitive to m2/m12. More precisely, if m2/m12 changes by 20%, the 10% to 90% slew changes by as
According to Figure 9, the advantage of this methodology is that the latter scenario occurs rarely in today’s high frequency digital circuits. Indeed, the m3/(2m1m2-m13) behavior is the same as the m2/m12 behavior as shown in Figure 10. Therefore, whenever m2/m12 value exceeds a critical limit (i.e., 1/ln(10/5)=1.44, because it is well-known that at this point, the 50% propagation delay reaches the Elmore delay which is the upper bound on delay), the effect of third moment should also be taken into account by using the AWE method. This critical limit can change according to the degree of precision needed during the path timing analysis.
3
The Filtering Algorithm
As observed earlier, the Tr/RC is an extremely important factor in determining the propagation delay and slew. As depicted in Figure 11, when the value of Tr/RC becomes greater than a critical limit, then there is one dominant pole in the voltage transfer function, and therefore, the first moment would be sufficiently accurate for calculating the output delay and transition time. According to Figures 11 and 12, it has been observed that the Elmore delay and slew errors are functions of the Tr/RC. If the Tr/RC is greater than a critical threshold, the Elmore delay error is quite small. However, when Tr/RC is less than this threshold, the Elmore delay may result in a large error. The proposed filtering algorithm makes use of this behavior to determine the stage delays based on the critical value of Tr/RC. The parameters used in the filtering algorithm are defined as follows: φ is defined as the Elmore threshold value. When the first moment of the voltage transfer function is less than this threshold, then the estimation errors of the slew and stage delay (which are calculated based on Elmore delay) are small because the critical path delays are not sensitive to these estimation errors. µ is defined as the dominant-pole cut off ratio. When the value of the input slew over Elmore delay is
η is defined as the second moment filtering-threshold value. If the value of m2/m12 is less than this threshold, equation (13) becomes the basis of the timing analysis. For an interconnect line with m2/m12 greater than this threshold, the AWE method should be used to calculate the first three moments. As η goes towards 1, the delay and slew calculations become more accurate but the runtime increases.
increase the accuracy, at the cost of higher runtime. In fact, the filtering algorithm with φ→0, µ→∞, and η→0 simply resort to the AWE-based timing analysis. Similarly, with µ→0, the proposed filtering algorithm reduces to the Elmore-based for delay and slew calculation. 1
Given the input slew Tr, the TF algorithm for calculating the stage delay is as follows:
m2/m12=1.1
0.9 0.8
Step Response
greater than µ, then the Elmore-based timing analysis is accurate enough (according to (7)).
0.7 0.6
m2/m12=1
0.5 0.4
m2/m12=0.75
0.3 0.2 0.1 0 0
Threshold-based Filtering Algorithm 1. Calculate the first moment m1 ;
4.
5. 6. 7.
4
3
300000
2
if (m2/m1 ≤ η) { Use equation (12) to calculate delay and slew; return; } Calculate m3 ; Use AWE to calculate the delay and slew; return
250000 200000
Less than 0.1% of the nets
150000 100000 50000 0 0
2
1
3
42
53
6
7
m3/(2m1m2-m13)
Figure 9: The distribution of m3/(2m1m2-m13) for the 90nm design testcase.
Experimental Results
To verify the accuracy of the proposed filtering technique, the algorithm was applied to a commercial high-performance design in 90nm technology node. The operating frequency of the design was 800MHz, and the number of primitive gates was more than 120,000. There are about 1,674,342 delay stages in the design. The algorithm was also applied to other designs with lower frequencies and less count of delay stages, but due to the fact that the error between the Elmore delay and the AWE method was not that significant, the results for this design are discussed in more detail. All the experimental runs of the proposed algorithm were done on a 1.2GHz X86-based PC with 2GB of RAM. The errors obtained by using only the Elmore approach are shown in Figures 11 and 12. According to Figure 11, there could be a slew error range of -50ps to 50ps as a result of the Elmore-based timing analysis. In addition, based on Figure 12, there is a delay error range of –70ps to 70ps. The AWE-based delay calculator obviously provided more accurate results. However it resulted in an increase in the runtime by as much as 300% compared to the Elmore-based timing analysis engine. The Elmore-based full chip timing analysis took about 20 minutes to complete. Figures 13 and 14 show the results based on the proposed filtering algorithm. In this experiment, the values of φ, µ and η were taken as 7ps, 7, and 2, respectively. The proposed filtering algorithm required only 14% more runtime than the Elmorebased analysis and runs about 62% faster than AWE-based analysis. In addition, TFA resulted in less than 6ps error in both slew rate and stage delays comparing to AWE-based delay calculator results. Decreasing φ and η and increasing µ tends to
2.5
2
Figure 8: The step response of a second order system for three values of m2/m12.
if (m1 ≤ φ || Tr/m1 ≥ µ) { Calculate Elmore-based delay and slew from equations (7) and (9); return; } Calculate m2 ;
Number of stages
3.
1.5
1
Time ( s)
7 6
m 3/(2m 1m 2-m 13)
2.
0.5
5 4 3 2 1 0
0
2
η
4
6
m 2 /m 1 2
8
10
Figure 10: m3/(2m1m2-m13) versus m2/m12 for the 90nm design testcase.
5
Conclusion
In this paper, a threshold-based filtering algorithm for estimating the interconnect delay and slew for minimizing error in path delay and slew computation was presented. It was observed that the timing analysis error in VDSM technologies is mainly due to the gate delay error, which is in turn due to the error in estimating the input slew of the gate. The filtering algorithm relies on the input slew of the interconnect line and the voltage transfer function, to decide when to use the Elmorebased delay and slew calculation. Furthermore, a closed-form expression for calculating the delay and slew was provided for those interconnect lines with m2/m12 less than a certain critical threshold. It was shown that the 70% point of the output transition time is not that sensitive to the variation of m2/m12. Experimental results on an industrial high-performance 90nm
design testcase with 120,000 gates, demonstrates the accuracy and efficiency of the proposed filtering algorithm. 50 40
Tr ↓ ⇒ Error ↑ Elmore
Slew Error (ps)
30 20 10 0 -10 -20 -30 -40 -50 0
µ
20
40
60
80
100
120
140
Slew/Elmore
Interconnect Delay Error (ps)
Figure 11: Slew error versus slew over Elmore delay for the 90nm design testcase.
Slew/Elmore
Figure 12: Interconnect delay error versus slew over Elmore delay for the 90nm design testcase.
Slew Error (ps)
40 20 0 -20 -40 0
20
40
60
80
100
120
140
Slew /E lm ore
Interconnect Delay Error (ps)
Figure 13: The calculated slew of the 90nm design testcase based on filtering algorithm with φ=7ps , µ=7, and η=2.
Slew/Elmore
Figure 14: The calculated delay of the 90nm design testcase based on filtering algorithm with φ=7ps , µ=7, and η=2.
6
References
[1] C.W. Kang, S. Abbaspour, M. Pedram, “Buffer sizing for minimum energy-delay product by using an approximating polynomial,” Proc. of Great Lakes Symposium on VLSI, pp. 112115, 2003. [2] W. C. Elmore, “The transient response of damped linear networks with particular regard to wideband amplifiers,” Journal of Applied Physics, 19, Jan. 1948, pp. 55-63. [3] L. T. Pillage and R. A. Rohrer, “Asymptotic Waveform Evaluation for timing analysis,” IEEE Trans. on Computer Aided Design, vol. 9, 1990, pp. 352-366. [4] R. Kay and L. Pileggi, “PRIMO: probability interpretation of moments for delay calculation,” Proc. of Design Automation Conference, 1998. pp. 463-468. [5] C. Alpert, A. Devgan, and C. Kashyap, “A two moment RC delay metric for performance optimization,” Proc. of International Symposium on Physical Design, 2000. [6] http://bwrc.eecs.berkeley.edu/Classes/IcBook/SPICE/ [7] C.V. Kashyap, C.J. Alpert, and A. Devgan, “An effective capacitance based delay metric for RC interconnect,” Proc. of International Conference on Computer Aided Design, pp. 229 – 234, 2000. [8] C. Alpert, A. Devgan, and C. Kashyap, “RC delay metrics for performance optimization,” IEEE Trans. on Computer Aided Design, vol. 20, May 2001, pp. 571-582. [9] C. L. Ratzlaff, N. Gopal, and L. T. Pillage, “RICE: rapid interconnect circuit evaluator,” Proc. of 28th ACM/IEEE Design Automation Conference, pp. 555-560, 1991. [10] R. Gupta, B. Tutuianu, L. Pileggi, “The Elmore delay as a bound for RC trees with generalized input signals, “IEEE Trans. on Computer Aided Design, vol. 16, 1997, pp. 95-104. [11] P. R. O’Brien and T. L. Savarino, “Modeling the driving-point characteristic of resistive interconnect for accurate delay estimation,” Proc. of International Conference on Computer Aided Design, pp. 512-515, 1989. [12] A. B. Kahng and S. Muddu, “Accurate analytical delay models for VLSI interconnects,” Proc. of International Symposium on Circuits and Systems, pp. 147-151, 1996. [13] A. B. Kahng and S. Muddu, “Improved Effective Capacitance Computations for Use in Logic and Layout Optimization,” Proc. of International Conference on VLSI Design, pp. 578-582, 1999. [14] J. Qian, S. Pullela, and L. Pillage, “Modeling the “Effective Capacitance” for the RC interconnect of CMOS gates,” IEEE Trans. on Computer Aided Design, vol. 13, 1994, pp. 1526-1535. [15] R. Macys and S. McCormick, “A new algorithm for computing the “Effective Capacitance” in deep sub-micron circuits,” Proc. of Custom Integrated Circuits Conference, pp. 313-316, 1998. [16] H. L. Trentelman, A. A. Stoorvogel, and M. Hautus, Control Theory of Linear Systems, Springer, NY, 2001.