This article was downloaded by: [University of Nevada Las Vegas] On: 15 January 2014, At: 17:46 Publisher: Routledge Informa Ltd Registered in England and Wales Registered Number: 1072954 Registered office: Mortimer House, 37-41 Mortimer Street, London W1T 3JH, UK
Journal of Foodservice Business Research Publication details, including instructions for authors and subscription information: http://www.tandfonline.com/loi/wfbr20
The Application of ActivityBased Costing in a Quick Service Restaurant Katerina Annaraud , Carola Raab & Jay R. Schrock Published online: 08 Sep 2008.
To cite this article: Katerina Annaraud , Carola Raab & Jay R. Schrock (2008) The Application of Activity-Based Costing in a Quick Service Restaurant, Journal of Foodservice Business Research, 11:1, 23-44, DOI: 10.1080/15378020801926627 To link to this article: http://dx.doi.org/10.1080/15378020801926627
PLEASE SCROLL DOWN FOR ARTICLE Taylor & Francis makes every effort to ensure the accuracy of all the information (the “Content”) contained in the publications on our platform. However, Taylor & Francis, our agents, and our licensors make no representations or warranties whatsoever as to the accuracy, completeness, or suitability for any purpose of the Content. Any opinions and views expressed in this publication are the opinions and views of the authors, and are not the views of or endorsed by Taylor & Francis. The accuracy of the Content should not be relied upon and should be independently verified with primary sources of information. Taylor and Francis shall not be liable for any losses, actions, claims, proceedings, demands, costs, expenses, damages, and other liabilities whatsoever or howsoever caused arising directly or indirectly in connection with, in relation to or arising out of the use of the Content.
Downloaded by [University of Nevada Las Vegas] at 17:46 15 January 2014
This article may be used for research, teaching, and private study purposes. Any substantial or systematic reproduction, redistribution, reselling, loan, sub-licensing, systematic supply, or distribution in any form to anyone is expressly forbidden. Terms & Conditions of access and use can be found at http://www.tandfonline.com/page/terms-and-conditions
The Application of Activity-Based Costing in a Quick Service Restaurant
1537-8039 1537-8020 WFBR Journal of Foodservice Business Research, Research Vol. 11, No. 1, February 2007: pp. 1–22
Downloaded by [University of Nevada Las Vegas] at 17:46 15 January 2014
JOURNAL OF FOODSERVICE BUSINESS RESEARCH Refereed
Katerina Annaraud Carola Raab Jay R. Schrock
ABSTRACT. Traditional cost accounting systems in the manufacturing sector have been replaced in recent years by Activity Based Costing (ABC) systems. This study demonstrates the incorporation of ABC data into traditional Contribution Margin (CM) methods and provides food service managers with an improved tool for cost and profitability analysis. The study uses ABC data collected from a Quick Service restaurant (QSR) in the Southeastern United States. ABC methodologies, using qualitative methods, adapted from an established model for full-service restaurants, allowed for the tracing of overhead costs to individual menu items. Results reveal that ABC is a superior method for establishing overall menu profitability, and that a restaurant manager’s menu management decisions will change dramatically if he or she is confronted with differing results from a contribution margin analysis and an ABC approach. KEYWORDS. Restaurants, profitability, activity-based costing, cost accounting, menu engineering, quick service restaurant
Katerina Annaraud, University of South Florida (Sarasota Campus) (E-mail:
[email protected]). Carola Raab, PhD, William F. Harrah College of Hotel Administration, University of Nevada, Las Vegas (E-mail:
[email protected]). Jay R. Schrock, PhD, University of South Florida (Sarasota Campus) (E-mail:
[email protected]). Journal of Foodservice Business Research, Vol. 11(1) 2008 Available online at http://jfbr.haworthpress.com © 2008 by The Haworth Press, Inc. All rights reserved. doi:10.1080/15378020801926627
23
24
JOURNAL OF FOODSERVICE BUSINESS RESEARCH
Downloaded by [University of Nevada Las Vegas] at 17:46 15 January 2014
INTRODUCTION One major challenge for restaurant managers is to find a balance between appropriate product pricing and providing value to customers (Parsa, Njite & King, 2005). According to a study conducted by Raab and Mayer (2003), most restaurant managers are able to monitor customers’ needs and have a good knowledge of their variable costs (food and beverage costs), but they lack specific facts as to whether they will maximize overall profits by meeting their guests’ needs. This is in part because restaurant managers often do not know the true profitability of the various items on their menus. The restaurant industry generally establishes menu prices by using contribution margin analysis, a process by which a desired food cost percentage is marked up with the expectation that the difference between a menu item’s food costs and the menu item’s price will cover all undistributed operating costs as well as taxes and profits (Bell, 2002; Raab & Mayer, 2003). However, traditional contribution margin analysis cannot reveal the true profitability of a menu item if menu prices are set without incorporating all of a restaurant’s undistributed operating costs. Kaplan and Cooper (1992) demonstrated that the domain of traditional contribution margin analysis could be greatly enhanced by using Activity-Based Costing (ABC). ABC provides major advantages over other costing methods by tracing overhead costs to individual product units, which allows for more accurate unit costing and pricing. In addition, ABC has been shown to be superior to CM methods for the manufacturing and service industries by extensive prior research (Cooper, 1989 & 1990a; Cooper and Kaplan, 1991; Cooper, 1991a; Turney, 1991; Cokins, 2001). ABC may also be a superior approach for restaurants, because the same basic conditions that made ABC appropriate for the manufacturing industry apply to restaurants. These conditions include high overhead costs, a highly competitive environment, and diversity of resource consumption for individual items. In this kind of environment, using only food costs to mark up menu items is a questionable practice, since it assumes that the resulting price will cover not only food cost, but also overhead and profits. A study by Raab and Mayer (2003) interviewed controllers of a sample of the top 100 US restaurant firms. Their study found that restaurant managers are increasingly aware of the need to trace some of their overhead costs, such as salaries and wages, to individual menu item prices. The results of this study demonstrate the potential for the use of ABC in the restaurant industry.
Downloaded by [University of Nevada Las Vegas] at 17:46 15 January 2014
Refereed
25
Several preceding studies have demonstrated that ABC can be successfully applied to the restaurant industry (Raab, 2003; Raab, Mayer, Ramdeen and Ng, 2004, Raab, Shoemaker and Mayer). Raab (2003) adapted an established manufacturing model (Cooper, 1998; Cooper and Kaplan, 1992) to a fine dining restaurant and established the model’s feasibility by testing twelve hypotheses. The study revealed a significant difference between traditional methods (CM approaches) and ABC techniques. Raab, Mayer, Ramdeen and Ng (2004) modified the model and tested it successfully in a Hong Kong buffet restaurant. Both studies were able successfully to trace a major part of undistributed operating costs (labor) to individual menu items. These studies make ABC-derived cost data available to establish an extension of Menu Engineering (ME) that goes beyond the traditional Contribution Margin (CM) approach. Raab, Hertzman, Mayer and Bell (2006) incorporated ABC data into a Menu Engineering analysis and discussed the major differences between the results of ABC ME and traditional CM ME. The results of the study further demonstrated the advantages of using an ABC approach. This paper seeks to demonstrate whether the ABC model established for full-service restaurants and buffets can be applied to Quick Service Restaurants (QSR). The subsequent sections of this paper will explain the basic concepts of Activity-Based Costing and the application of ABC to the restaurant industry. Furthermore, we will demonstrate how to incorporate ABC cost data into a traditional CM/ME model. The use of CM approaches and ABC methods will then be compared and contrasted by using menu data collected from one unit of the top ten QSR chains in a Southeast urban area of the United States.
THE APPLICATION OF ACTIVITY-BASED COSTING TO THE QUICK SERVICE RESTAURANT INDUSTRY In recent years, the manufacturing sector replaced traditional cost accounting systems with ABC systems. ABC is superior to other costing methods because the system has the ability to trace overhead costs to individual products (Cooper, 1989; Cooper and Kaplan, 1992; Garrison and Noreen, 1997; Cokins, 2001). Raab (2003) developed an ABC model for the restaurant industry by modifying Cooper’s (1989) ABC model for the manufacturing industry. The model was successfully tested in a fullservice restaurant in a Western urban area of the US, as well as in a Hong Kong buffet restaurant (Raab, 2003; Raab and Mayer, 2003; Raab,
Downloaded by [University of Nevada Las Vegas] at 17:46 15 January 2014
26
JOURNAL OF FOODSERVICE BUSINESS RESEARCH
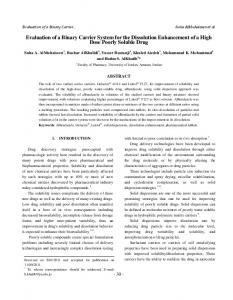
Mayer, Ramdeen and Ng, 2004, Raab, Hertzman, Mayer and Bell, 2006). The next section of this paper describes how these previously tested ABC models can be applied to the QSR business. In order to proceed, ABC models that were developed and tested in previous ABC research (Raab, 2003; Raab and Mayer, 2003; Raab, Mayer, Ramdeen and Ng, 2004, Raab, Hertzman, Mayer and Bell, 2006, Raab, Shoemaker and Mayer, 2006) were changed according to the observed characteristics of a quick-service restaurant (Figure 1). Next, we will explain the ABC analyses displayed in Figure 1.
Stage One of the ABC Process Before the ABC analysis was conducted, management was asked to select major menu items from their menu as the items to be analyzed in this study. Additionally, management provided access to all general ledger accounts of the restaurant in order to be able to retrieve all overhead cost information. Finally, all information needed for conducting a menu engineering analysis was obtained and CM based menu engineering was conducted. Next, an ABC analysis was conducted and its individual steps are explained (Tables 1 and 4). Identification of activities comprised the first component of the first stage in the ABC analysis. All tasks in the restaurants were observed and/ or obtained by interviewing employees and management. In addition, all tasks were combined into major activities by combining activities that have a common purpose. Major activities for the quick-service restaurant FIGURE 1. ABC model for quick service restaurants. General Ledger Labor First Stage
Utility Activity Center Unit-Level Batch-Level Product-Sustaining
Second Stage
Menu Items Unit-Level Batch-Level Product-Sustaining Facility-Sustaining Food Cost
Facility-Sustaining
Refereed
27
Downloaded by [University of Nevada Las Vegas] at 17:46 15 January 2014
TABLE 1. The ABC process (Genetic Steps–Stage One) 1. Identifying activities; a. Observe tasks in the entire restaurant; b. Document tasks; c. Aggregate tasks into activities; d. Prepare for interviews with department heads to determine activities conducted. e. Establish activities; and, f. Label activities. 2. Establish activity centers by combining segments of the production process, for which management wants to report costs separately, The following rules have to be observed: a. Put activities into departmental activity centers first; b. Activity centers must be processes which have their resources directly consumed by products; c. Activities with homogenous processes should be combined; and, d. Activity centers should be created with accountability in mind. 3. Establish total overhead cost for the time period to be analyzed. 4. Reconstruct the general ledger by conducting tasks as follows: a. Combine related accounts by considering which accounts share a common purpose and are assigned to activities the same way (using a single cost driver). 5. Establish first stage cost drivers for each cost pool and calculate cost pool rates by dividing the total cost pool cost with the total number of cost pool drivers.
were identified as: (1) serving customers; (2) cleaning; (3) preparing; (4) cooking; and, (5) administrating. These activities were used in a bill of activities as displayed in Table 5. The next step was to establish activity centers across departments and accountability structures by combining similar processes and by consolidating segments of the production process, for which management wants to report costs separately. For the purpose of this study, the entire restaurant was considered to be one activity center. This was in contrast to ABC models previously established, which had clearly defined FOHand-BOH activity centers. In previous studies that applied ABC to restaurants, two activity centers were created: the Front-of-the-House (FOH); and the Back-of-the-House (BOH). Since the restaurant analyzed generates most of its revenues as a drive-through operation, only a few tables are available for customers to sit down at and eat in the establishment. Thus, no divisions between the FOH and the BOH exist, contrary to the case in restaurants previously analyzed. Consequently, overhead costs could not be divided between FOH and BOH. Following Kaplan and Cooper’s (1992) original ABC research, which suggests that
Downloaded by [University of Nevada Las Vegas] at 17:46 15 January 2014
28
JOURNAL OF FOODSERVICE BUSINESS RESEARCH
ABC models should be flexible and be adaptable to the nature of analyzed businesses, it was found to be appropriate to treat the restaurant as one activity center. After that, cost pools emanating from the restaurant’s general ledger were established. Based on Cooper’s (1989) two stage model adapted for Figure 1, the next step involves assigning overhead costs to activity centers, where they accumulate while waiting to be assigned to products (Garrison and Noreen, 1997). The cost can be assigned either directly to activity centers in this first stage or can be assigned with the use of a first-stage cost driver (Garrison and Noreen, 1997). The first stage should produce two outcomes: overhead cost pools and a pool rate (Shim and Siegel, 1992). According to the authors of the manufacturing ABC literature (Cooper, 1989; Cooper 1991a; Shim and Siegel, 1992), the first stage involves separating overhead costs into homogeneous cost pools. Homogeneous cost pools are a collection of overhead costs for which cost variations can be explained by one cost driver (i.e., an estimated effort expended on each activity) and that share a common purpose. According to the Uniform System of Accounts for Restaurants (USAR), overhead costs include the following items: Salaries and Wages; Employee Benefits; Direct Operating Expenses; Music and Entertainment; Marketing; Utility Service; General and Administrative Expenses; and, Repair and Maintenance Expenses (Schmidgall, 1997). The ABC literature (O’Guin, 1991; Turkey, 1991; Cokins, 2001) suggests that related accounts that share a common purpose should be combined. For example, wages and employee benefits can be combined in an account called “costs of labor” which will be assigned to activities using a single cost driver (an estimated effort expended on each activity). Basically, the general ledger is rearranged into cost pools and can be maintained in that manner for ABC purposes, next to the original general ledger, which serves financial reporting purposes. The cost driver “numbers of hours spent”, which incorporates all labor hours consumed on all phases of the restaurant, is used as a single cost driver to establish cost pool rates for the “cost of labor” cost pool. Labor cost pool rates then are calculated by dividing the “cost of labor” cost pool into the number of hours worked for the time period analyzed. This pool rate is later applied in the second stage of the costing process to determine how much of the overhead cost “cost of labor” is used by each individual product (menu item). Next, we explain stage one of the ABC process as it was conducted for a Quick Service Restaurant.
Downloaded by [University of Nevada Las Vegas] at 17:46 15 January 2014
Refereed
29
For the purpose of this study the following three overhead costs were recognized as a major source of concern by management: (1) Labor and Related Costs; (2) Utilities; and, (3) Facility-Sustaining Costs (other overhead costs such as marketing, direct operating costs etc.). Thus, three cost pools were established along these lines: first, a “Labor” cost pool, which included all salaries, over-time pay, and wages for temporary help, all employer taxes, worker compensation expenses, employer insurance, and employee meal accounts; second, a “Utility” cost pool containing gas and power expenses; and third, a “Facility Sustaining” cost pool, including direct operating costs, repair and maintenance, accounting, general and administrative expenses, insurance, security, telephone, marketing, depreciation expenses, and miscellaneous expenses. In contrast to previously established ABC models, this model eliminated the “Direct Operating Expenses” cost pool and replaced it with a Utility cost pool, because management was interested in tracing utility costs to individual menu items instead of “Direct Operating Costs”. Next, cost pool rates were calculated. Table 2 displays the cost pools that were established from overhead accounts in the general ledger and their cost pool rates. The assignment of overhead costs to three cost pools resulted in several findings. First, the total overhead cost as applied to all menu items was $45,145.56, which was an average amount of the overhead consumed for the two months of restaurant operation analyzed. The menu items that were analyzed in this study, as identified by management as the most crucial items, represented about 40 percent of all items sold in the establishment. Therefore, the total overhead used for ABC calculations for these items was $18,058.23 ($45,145.56 × 40%). All of the following data discussed is based on 40 percent calculations. The total Labor cost pool was established to be $7,990.16, the Utility cost pool amount was $1,281.16, and the “Facility Sustaining” costs were $8,786.90, which represented 44.25 percent, 48.65 percent and 7.09 percent of the analyzed overhead costs ($18,058.23) respectively (Table 2). The amount of average labor hours for the two time periods investigated were estimated to be 263 hours, comprised of direct labor hours and TABLE 2. General ledger cost pools Labor ($)
Utilties ($)
Facility-sustaining ($)
7,990.164
1,281.16
8,786.9
30
JOURNAL OF FOODSERVICE BUSINESS RESEARCH
Downloaded by [University of Nevada Las Vegas] at 17:46 15 January 2014
TABLE 3. Cost pool rates
Cost Pool Rate calculations
Labor
Utilities
$30.38 ($7,990.16/263 hours)
Electricity $0.13/kwh (761.64/5859kwh) (Electricity) Gas ($518.40/494 therms) $1.05/therm (Gas) Total cost ($) power and gas/kilowatt hours/therms used
Total labor cost/hours worked
management time. The cost pool rate for the Labor cost pool was calculated to be $30.38/hour ($7,990/263 hours). Since the tracing of overhead costs to each menu item required cost pool rates per minutes and seconds, the hourly cost pool rate of $30.38 was divided by 60 minutes, establishing a cost pool rate of 50 cents per minute ($30.38/60 = $0.50/minute) and 0.008 cents per second (.50/60 = $0.008/second). Next, gas and power costs were included in the Utility cost pool. The total average utility costs for the two months were $1,281.16, of which 41 percent were gas expenses, and electricity expenses were 59 percent of the total utility costs. The utility cost pool rates were established as follows: the cost pool rate for electricity was determined to be $0.13 per kilowatt hour ($761.64/5859 kwh), and the cost pool rate for the gas consumption was calculated to be $1.00 per therm ($518.40)/1296.79/494 therms). In addition, utility costs per menu items for major equipment used in the production of menu items can be determined. The combined utility cost for the hot food storage, refrigerators, deep fryers and the griddle per menu item was calculated to be $0.11. In order to assign utility costs to each menu item as accurately as possible, it was decided to utilize a combination of the per menu item cost ($0.11) and each menu item’s popularity index as established by the menu engineering analysis. For example, the utility cost for the “Double Decker” item was established by multiplying the popularity index for the item by the per menu item utility cost (25.18% × 0.11 = 0.02 cents). Finally, an allocation value derived from the “Facility Sustaining” cost pool was calculated. The cost in this cost pool represents the sum of the remaining overhead accounts costs, including Security, Repair and Maintenance, Marketing, Insurance, Depreciation, Administrative and General, and Direct Operating Supplies. The total amount for the Facility Sustaining cost pool was $8,786.90. Even though the goal is to trace overhead
Downloaded by [University of Nevada Las Vegas] at 17:46 15 January 2014
Refereed
31
costs in so far as possible by using cost pool drivers applied to each unit, and to avoid allocating as much as possible, in any ABC approach, it is true that some of the overhead costs, such as fixed costs, cannot be traced, and have finally to be allocated. However, Kaplan and Cooper (1992) have established that an ABC model is superior to a CM approach despite the fact that some allocations are always needed in the process. The allocation value for this cost pool was established by dividing the cost pool by the average number of menu items sold over the two month period, resulting in $0.76 ($8,786/11,570 = $0.76). This amount ($0.76) will be added later to the bill of activities for each menu item.
Stage Two of the ABC Process Next, the second stage of the ABC analyzes was conducted as summarized in Table 4. The second stage of the ABC process establishes second stage cost drivers by dividing each activity center into activity cost driver pools. As explained above, this restaurant has only one activity center, which was divided into different levels of activities. According to ABC theory, all activities have a hierarchy, and cost drivers enable the activities to be grouped into different levels, such as unit-based, batch-related, productrelated, or facility sustaining (Cooper, 1990; Turney, 1991; O’Guin, 1991; Garrison and Noreen, 1997). Cost drivers can be thought of as the activities that trigger the consumption of resources from each level of activity when a menu item is ordered. Thus, there are four categories of second TABLE 4. The ABC process (Genetic Steps–Stage Two) 1. Establish activity center cost pool by decomposing activity centers into activity levels (batch, product sustaining and unit-level), 2. Identify second stage cost drivers one for each activity cost pool by identifying what triggers the consumption of resources from each activity cost pool when a certain menu item is ordered. 3. Establish per unit costs for each activity level in all activity centers and measure how many units of each activity cost pools are consumed by each menu item, through the use of observation and interview methods, 4. Trace costs from activity cost pools to menu items by multiplying the unit cost established for each activity cost pool by the number of units consumed by each entrée, 5. Create a bill of activities for each entrée (Appendix D), 6. Add food costs to the total cost derived from the bill of activities, establishing total menu item costs. 7. Conduct menu engineering with variable and overhead menu item costs (ABC/ME),
Downloaded by [University of Nevada Las Vegas] at 17:46 15 January 2014
32
JOURNAL OF FOODSERVICE BUSINESS RESEARCH
stage cost drivers applicable to the restaurant industry. The first is unit cost drivers, which occur anytime a unit is produced and are directly related to the number of units produced. The number of employee hours and units of utilities used are unit-based cost drivers applicable to the restaurant industry. The second category, batch cost drivers, incorporate everything that is produced in batches, such as setting up the kitchen line or purchasing inventory. The third category, product level drivers, signify resources used by product-level activities that are performed to sustain products in the company’s product line. In a restaurant, some examples of product-level activities include: establishing and maintaining specifications, recipe testing, and expediting food production. Finally, the facility sustaining cost driver category contains costs that sustain a company’s general processes, such as accounting, marketing, property taxes, security and landscaping. According to ABC theory, each of the activity cost driver pools has its cost assigned to products using a second-stage cost driver that is unique to each cost pool. Observation and interview methods were employed in this study to identify second stage cost drivers. Basic second stage cost drivers for unit-level activities were identified as time spent on activities conducted each time a customer is served and a menu item is produced. General cost drivers for batch-level activities are the number of batches required, such as number of set-ups per day, or the number of times purchasing and receiving is needed during the month. Major product-sustaining cost drivers were identified as the number of new menu items created each month and the number of new employees hired per month. A cost driver pool is distributed to products based on the number of cost driver units it consumes. The overhead cost applied to the product is calculated by multiplying the number of cost driver units with the cost pool rates established during the first stage of an ABC process. Each of the activity cost driver pools has its cost assigned to products using a second-stage cost driver that is unique to each cost pool. In this study, ABC costs were calculated for each menu item, and were condensed as bills of activity that combined all costs involved in producing one menu item (except taxes). At that point, operating profits were calculated for each menu item). A completed bill of activity becomes a powerful tool for analysis and subsequent action by restaurant management. Because of space limitations in this paper, the bill of activities for the “Big Bufford” menu item (Table 5) is used to illustrate how the calculated ABC cost is presented for all menu items.
Refereed
33
TABLE 5. Bill of activity: big bufford
Downloaded by [University of Nevada Las Vegas] at 17:46 15 January 2014
Activities
Unit-Level Activities Serving Customers Cooking Total Total Unit-Level Activities Batch-Level Activities Preparation Cleaning Total Total Batch-Level Activities Product-Sustaining Activities Administrating Total ProductSustaining Activities
Resources used (in seconds)
12 25.4 27.4
Cost pool rates ($/seconds)
0.008 0.008 0.008
27.40 seconds 33 29.3 62.30
9
0.096 0.2032 0.2192 29.92 cents
0.008 0.008 0.008
15.6 seconds 9
Total cost (cents)
0.2640 0.2344 0.4984 49.84 cents
0.008
0.4984 49.84 cents
Facility-Sustaining Activities
1 unit
0.76
Utilities
1.95 percent $0.11
0.002
Food Costs Total Cost
1 unit
0.73 2.29
A cost pool rate of $0.008/second, as established for the “Personnel” cost pool, was used to calculate ABC costs involving labor. The unit-level activity “Serving Customers” took an average of 12 seconds per menu item, resulting in a cost of $0.096 ($0.008 × 12 seconds). For the “Big Bufford” item, the “Cooking” activities were measured to be 25.4 seconds, resulting in a cost of 20.32 cents ($0.008 × 25.40 seconds). Next, the cost for the batch-level activities was calculated. The cost applied for “Preparation” activities is $0.26 cents (33 seconds × $0.008 = $0.26), and for the “Cleaning” activities is $0.23 (29.8 seconds × $0.008). The costs of product-sustaining activities summarized as “Administrating” activities is $0.07 (9 seconds × 0.008). The total FOH costs for the “Big Bufford” menu item produced by unit-level, batch-level, and product-sustaining activities were $0.29, $0.49, and $0.07, respectively. In addition, $0.76 of facility-sustaining costs was allocated to each menu item. The assigned utility cost for the “Big Bufford” menu item was only $0.002 because of the low popularity of the item. Finally, the food cost for the item was added ($0.73) and a
34
JOURNAL OF FOODSERVICE BUSINESS RESEARCH
Downloaded by [University of Nevada Las Vegas] at 17:46 15 January 2014
summary of all costs revealed that the total cost for a “Big Bufford” item was $2.29. Finally, an ABC Menu Engineering (ABC/ME) analysis was conducted, and the results are compared with the traditional menu engineering (CM/ME) results established before the ABC analyzes presented next.
APPLICATION OF MENU ENGINEERING In order to reveal the differences between CM methods and ABC analysis, the authors applied both a Contribution Margin based Menu Engineering (CM/ME) approach, and an ABC based Menu Engineering (ABC/ ME) approach, to analyze the main menu items chosen by management. First, the popularity of the menu items was analyzed. The average menu mix (MM) for the ten selected menu items was 7 percent. This value indicates that each menu item providing less than 7 percent of total sales should be ranked as having lower than average popularity. The results displayed in Table 6 show that six menu items had less than average popularity. These items were: (1) “Big Bufford”; (2) “Bacon Cheese Champ”; (3) “Premium Chicken Sandwich”; (4) “Chili Cheese Burger”; (5) “Bacon Cheddar Burger”; and, (6) “Double Decker”. This popularity information applies as well to the ABC/ME analysis. Next, the profitability for the CM/ME methods was analyzed by applying traditional ME calculations (Table 6). The average menu CM was $0.80 ($9,261.06/11,570 = $0.80). Each item that displayed a value below this average was considered to be unprofitable. The following five menu items showed below average profitability: (1) Checker Burger; (2) Chili Cheese Burger; (3) Bacon Cheddar Burger; (4) Chili Dog; and, (5) Fish Sandwich. Classification of menu items based on the MM and CM revealed that the menu had two items that were Dogs (items ranking below average profitability and popularity), which were the Chili Cheese Burger and the Bacon Cheddar Burger. The analysis classified the following items as a Puzzle: Big Bufford, Bacon Cheese Champ, the Premium Chicken Sandwich, and Double Decker, which means that these items were not popular but were profitable. Three menu items were classified as Plow Horses (Checker Burger, Chili Dog and Fish Sandwich), which characterized them as popular but not profitable items. Finally, the analysis revealed only one item as a Star (Spicy Chicken Sandwich). This item was categorized as both popular and profitable.
35
2.12 4.85 5.46 27.92 4.04 2.03 18.86 25.18 8.57 0.98 100%
Big Bufford Bacon Cheese Champ Premium Chicken Sandwich Checker Burger Chili Cheese Burger Bacon Cheddar Burger Spicy Chicken Sandwich Chili Dog Fish Sandwich Double Decker Column Totals
1.76 1.64 2.00 0.58 0.56 0.79 0.90 0.59 0.55 0.86
Item CM*
CMS $0.80
178.85 409.53 499.28 1,324.30 200.81 115.15 850.98 1,165.20 436.48 71.19 $5,251.77
Menu costs
Food Cost% 36.19%
610.05 1,329.57 1,763.28 3,197.70 462.33 300.80 2,814.78 2,883.87 982.08 168.37 $14,512.83
Menu revenues L L L H L L H H H L
MM% rank**
Number of Menu Items = 10
431.20 920.04 1,264.00 1,873.40 261.52 185.65 1,963.80 1,718.67 545.60 97.18 $9,261.06
Menu CM
0.47 0.99 1.36 2.02 0.28 0.20 2.12 1.86 0.59 0.10
PF****
Average Total CM per Menu Item = $926.10
H H H L L L H L L H
CMS rank***
PUZZLES PUZZLES PUZZLES PLOW DOG DOG STAR PLOW PLOW PUZZLES
Menu item classification
Note: *= Menu item contribution margin; ** = Categorized by menu mix percentage; *** = Categorized by menu item contribution margin; ****= Profit Factors; PLOW = Plow Horse.
MM% 7.00%
Menu mix %
Menu item name
TABLE 6. CM menu engineering
Downloaded by [University of Nevada Las Vegas] at 17:46 15 January 2014
Downloaded by [University of Nevada Las Vegas] at 17:46 15 January 2014
36
JOURNAL OF FOODSERVICE BUSINESS RESEARCH
When analyzed according to the Contribution Margin Profit Factor (PF), four items contributed quite well to the overall profitability of the menu, as indicated by their PFs of close to or exceeding 1.0. These items were: “Bacon Cheese Champ”, “Premium Chicken Sandwich”; “Checker Burger”, “Spicy Chicken Sandwich”; and, “Chili Dog”. On the other hand, all of the items except for the Bacon Cheese Champ, have PFs that are much larger than 1.0 (1.36, 1.86, 2.02, and 2.12). These items captured a disproportionate share of the overall profitability of the dinner menu. In other words, 40 percent of the menu items produced 73 percent of the profit. The “Big Bufford” and the “Double Decker” item that were classified as Puzzles in this CM/ME analysis had low PFs (0.47 and 0.10, respectively), indicating that these items only produced a very small proportion of the average profit, thus they were not truly profitable. They actually portray more of the characteristics of a Dog than a Puzzle. Finally, menu items identified as Dogs generally have very low PFs, which was also the case in this study. The two Dogs had profit factors ranging from 0.20 to 0.28. In summary, the CM PFs indicated that five items (Big Bufford, Chili Cheese Burger, Bacon Cheddar Burger, Fish Sandwich, and Double Decker) were unprofitable, and should be considered for removal from the menu.
ACTIVITY-BASED COSTING MENU ENGINEERING Next, an ABC/ME technique was implemented in order to reveal the differences between Contribution Margin methods and the ABC approach. The ABC/ME approach replaces the Contribution Margin analysis with an Operating Profit (OP) method, in which OPs are calculated based on ABC-derived costs, rather than relying only on food costs. This approach applies the same calculations to determine an item’s popularity classification. However, each menu item’s profitability classification is obtained by comparing each menu item’s profit margin before interest and taxes to a total menu average profit margin before interest and taxes. The Profit Factor for each menu item can be calculated in two steps. First, the average profit margin before interest and taxes is determined by dividing the total menu operating profit margin by the number of menu items. The profit margin before interest and taxes of each item on the menu is then divided by the menu average profit margin. The ABC/ME approach revealed the results shown in Table 7. The popularity analysis revealed the same results (i.e., an average menu mix
37
0.99 0.99 1.28 1.29 0.99 0.99 1.49
2.49 2.37 2.79
Menu price
H L L H H H L
Average Total OP per Menu Item = ($)
Number of Menu Item = 10
L L L
MM% cat.*
(3,423.80) (448.32) (185.65) (1,440.12) (2,913) (982.08) (74.57)
36.75 (5.61) 214.88
Total menu operating profit
L L H H L L H
H H H
OP cat.**
3.713 0.486 0.201 1.562 3.159 1.065 0.081
(0.04) 0.006 (0.233)
PF
PLOW DOG PUZZLES STAR PLOW PLOW PUZZLES
PUZZLES PUZZLES PUZZLES
Menu item classification
Note: * = Categorized by menu mix percentage; ** = Categorized by menu item operating profit (menu item operating profit/menu item price); *** PF = Profit Factors; PF of −1.0 = average profitability; PLOW = Plow Horse.
OP$ -$0.80 -$163.54
2.05 1.95 2.07 1.95 1.99 1.98 2.15
27.92 4.04 2.03 18.86 25.18 8.57 0.98 100%
MM% 7.00%
2.34 2.38 2.45
2.12 4.85 5.46
Big Bufford Bacon Cheese Champ Premium Chicken Sandwich Checker Burger Chili Cheese Burger Bacon Cheddar Burger Spicy Chicken Sandwich Chili Dog Fish Sandwich Double Decker Column Totals
Item ABC costs
Menu mix%
Menu item name
TABLE 7. ABC menu engineering
Downloaded by [University of Nevada Las Vegas] at 17:46 15 January 2014
Downloaded by [University of Nevada Las Vegas] at 17:46 15 January 2014
38
JOURNAL OF FOODSERVICE BUSINESS RESEARCH
of seven percent) as the CM/ME approach, which determined that six menu items had less than average popularity. However, the profitability analysis generated much different results using ABC/ME. The analysis was conducted as follows: first, individual operating profits were calculated by subtracting total menu item costs, excluding interest and taxes from menu item prices; in addition, a total OP was established by adding all individual operating profits for each menu item. Finally, an average OP value for the menu was calculated by dividing the total menu OP by the total number of menu items sold. This resulted in an average menu OP of $–0.80 ($–9,221.53/ 11,570 = $–0.80). Traditional CM/ME suggests that each item that generates a value equal to or above this average is considered to be profitable. However, because the average OP value was negative, the traditional approach had to be adjusted. Thus, in ABC/ME, the only menu items that were considered as profitable were those that showed a positive OP. Under this criterion, only two menu items showed profitability (Big Bufford and Premium Chicken Sandwich). Under ABC/ME, the menu items were classified into the four traditional matrix categories, which revealed that only the “Bacon Cheddar Burger” item (identified as a Dog by CM/ME and as a Puzzle by ABC/ ME) was classified differently from the CM/ME approach. This result was mainly attributed to the fact that the CM/ME popularity index is also applied for the ABC/ME analysis, and that menu items were compared to an average negative OP value (0.80), which resulted in the ranking of unprofitable items as “H” as long their Ops were larger than the average OP of (0.80). Finally, after menu items were classified according to their profitability and popularity, each menu item’s share of the total menu profit was revealed through the calculation of Profit Factors, using ABC-derived costs. The average relative profitability of a menu item in both CM/ME and ABC/ME analysis is indicated by a PF of 1.0. However, if the overall operating profit is negative, an average profitability is indicated by a PF of −1.0 (Pavesic, 1985). As discussed earlier, the ABC/ME analysis only found two items to be profitable (Big Bufford; and, Premium Chicken Sandwich) and one item (Bacon Cheese Champ) that was close to the break-even point. However, the profit factors of these three items displayed very low relative profitability (Big Bufford PF = −0.040; Bacon Cheese Champ PF = 0.006; and, Premium Chicken Sandwich PF = −0.233). These three items were classified as Puzzles.
Downloaded by [University of Nevada Las Vegas] at 17:46 15 January 2014
Refereed
39
In addition, two other menu items were identified as Puzzles (Bacon Cheddar Burger, PF = 0.201; and Double Decker, PF = 0.081), both of them showing negative OP margins, which made their classification as Puzzles very doubtful. Furthermore, the Spicy Chicken Sandwich (identified as a Star) has a PF of 1.56, contributing to the overall negative OP approximately 1.5 times more than the other menu items, which made its classification as a Star very questionable. None of the items classified as Plow Horses under ABC/ME (i.e., Checker Burger, PF = 3.71; Chili Dog, PF = 3.15; and, Fish Sandwich, PF = 1.06) displayed a PF that could identify them as profitable items. The Checker Burger and the Chili Dog items showed the menu’s lowest profitability with PFs of 3.71 and 3.15, respectively, which indicates that these items contributed over three times more to the menu’s operating loss than any other menu item. This result contrasts dramatically with the CM/ME analysis, in which these items showed above average relative profitability with PFs of 2.02 and 1.86, respectively. Finally, the Chili Cheese Burger, identified as Dog, had a Profit Factor of 0.48, indicating that it contributed less to the overall negative operating profit than all of the items classified as Plow Horses. The next section discusses the managerial implications that arise from this study.
MANAGERIAL IMPLICATIONS The results of this study reveal several managerial implications. First, the study showed that an ABC approach works in a Quick Service restaurant by estimating a fully loaded ABC cost per menu item. This approach allows restaurant managers further to analyze their menu profitability with a level of insight that was not previously possible under traditional CM methods. In addition, in this study, conducting CM/ME and ABC/ME analyses for the same menu in a QSR revealed some remarkably differing results, which have important implications for the restaurant’s management. First, the CM analysis revealed that a contribution margin of $9,261.06 was available to cover all operating expenses, taxes and profits (Table 4). On the other hand, the ABC approach showed a negative operating profit of ($9,221.53), which did not allow for the realization of any profits from the entire selection of menu items (Table 5). Second, the CM/ME method determined that all menu items were profitable, based on their $ Contribution Margins. However, the ABC/ME approach demonstrated that only
Downloaded by [University of Nevada Las Vegas] at 17:46 15 January 2014
40
JOURNAL OF FOODSERVICE BUSINESS RESEARCH
two of the menu items were actually profitable (Big Bufford; and, Premium Chicken Sandwich), and both of them were only marginally profitable, with very low PFs (Table 4). In this study, the results demonstrated that an ABC/ME approach produced different results than a traditional CM/ME analysis. Thus, the ABC approach should provide restaurant management with better information about the menu’s cost structure, since other costs beyond merely food cost can now be identified on an item-by-item basis. Furthermore, an ABC/ME approach allows managers better to classify their menu items based on Profitability and Popularity, versus a traditional ME approach. Thus, they can feel more assured that an item that they classified as a Star, for example, really is a Star, and not a misclassified item that is actually losing money, as was the case with the Spicy Chicken Sandwich item in this study. However, in contrast to the CM/ME analysis, which showed a high relative profitability for all Stars, ABC/ME analysis in this study did not reveal an item as a Star that was truly profitable. The results of this study add a new perspective on the interpretation of menu items that have been classified according to a traditional ME matrix. For example, this study revealed that, in an unprofitable restaurant, Stars and Plow Horses are actually worse for profitability than Dogs, which is a new interpretation of traditional ME concepts. While Dogs have typically been thought of as the worst items on a menu, the ABC/ ME approach revealed that items classified as Plow Horses may be even worse than Dogs for a restaurant that is already losing money. ABCderived PFs and the total item operating profits showed that Plow Horses produced a larger share of the total negative operating profit, while Dogs as a whole contributed less to the total loss of the dinner menu. This important finding could not have been discovered without the application of ABC methods. Therefore, the classic approaches that are suggested under a traditional CM/ME method would not be feasible in this case. Instead, all Plow Horses, like the Dogs, probably need to be eliminated from this restaurant’s menu. This finding is generally applicable to any unprofitable situation, not just to a QSR. The study also revealed that the more simple and standardized nature of a QSR changed traditional ABC concepts. While ABC applied to manufacturing reveals many activity centers, ABC models previously established for restaurants (Fine Dining and Buffets), divided the whole organization into two activity centers (front and back of the house). On the other hand, the most feasible ABC model for a QSR viewed the whole
Downloaded by [University of Nevada Las Vegas] at 17:46 15 January 2014
Refereed
41
operation as one activity center. Furthermore, an extra cost pool was added in order to account for utility costs. Despite some differences to previously established ABC models, the findings of this study are directly applicable to a Quick Service restaurant. Using ABC methods, a manager of virtually any type of restaurant can now analyze the true underlying profitability of a menu, taking into consideration the entire restaurant’s cost structure. Armed with this knowledge, managers can take the necessary steps to alter their operations and reconfigure their menus to improve their bottom line profitability, instead of merely guessing (based solely on food costs), that the changes they make will actually lead to improved profitability. Furthermore, an ABC analysis has many secondary advantages from which an operation can profit. Because of the observational methods that are applied to determine the nature and timing of activities, suggestions can be made that can assist indirectly in reducing costs and increasing profits. For example, ABC can assist in the choice of an appropriate item that may become the focus of an advertising campaign. Since the goal is to increase the sale of this item, ABC can assist in selecting a truly profitable item. In addition, in order to design special promotions, management’s need for knowledge of total menu item costs (ABC cost) is magnified, since management cannot afford to discount prices for menu items that are not profitable at regular prices. In conclusion, while the CM/ME analysis shows that the menu items generated a gross profit, the ABC/ME approach reveals that, in reality, these items actually contributed to a negative operating profit for the restaurant in this study. This reflects the restaurant’s relatively high overhead costs in general and its high labor costs in particular. In this case, most of the menu items’ actual costs were higher than their menu prices, if analyzed using ABC methods. Therefore, every time such an item was sold, with the exception of the two items that showed some profitability, the restaurant suffered an operating loss. For this restaurant, it will be necessary to improve the extraordinarily high labor and food costs before changing the menu. However, without conducting ABC and ABC/ME analyses, the impact of the high labor costs would not be visible on a per menu item basis. The results of this study further suggest that applications of menu profitability analyses that go beyond the simple analysis of food costs are very appropriate for the restaurant industry. Restaurant managers cannot make reliable decisions without complete cost information, which emphasizes the need for ABC menu analyses. Thus, it is likely that a restaurant
Downloaded by [University of Nevada Las Vegas] at 17:46 15 January 2014
42
JOURNAL OF FOODSERVICE BUSINESS RESEARCH
manager’s menu management decisions will differ dramatically if he or she is confronted with differing results from a CM/ME analysis versus an ABC/ME approach. In summary, the study revealed marked differences between traditional contribution margin-based approaches and ABC methods for determining menu profitability, which suggests that the application of ABC to this restaurant is, in fact, a feasible method. Furthermore, since ABC was established as a superior approach to product costing in the ABC literature (Cooper, 1989; Cooper & Kaplan, 1992), results displaying a difference from traditional CM methods may indicate that ABC applications to restaurants can be considered to be a desirable costing approach. The results also support concerns raised in the manufacturing ABC literature, suggesting that traditional methods yield misguided management views with regard to product costs, and thus to prices and marketing strategies (O’Guin, 1991; Turney, 1991). Although the results of this study were encouraging, several limitations must be noted. First, the study is an exploratory one, and used a convenience sample of only one single restaurant in the US. Thus, it cannot be widely generalized for all quick service restaurants. Second, the overhead cost tracing in this study was limited to the Personnel and Utilities; other overhead costs were allocated, rather than traced, to menu items. Finally, the researched restaurant operated at a negative profit margin, and, therefore, more drastic changes to the menu were needed than would be the case in a profitable establishment. However, in spite of these limitations, this study was able to demonstrate that ABC methods can be successfully combined with a traditional ME approach to help restaurant managers understand the true cost structure and profitability of their menus. It further suggests that a likely next step for restaurant management would be to conduct a price sensitivity analysis in order to learn about possible price elasticity patterns for the menu. That information could then be combined with ABC data to result in an Activity-Based Pricing model that could develop a clearer relationship between true product costs and market demand for this restaurant.
REFERENCES Bell, D. (2002). Food & Beverage Cost Control – Course Packet. Las Vegas: University of Nevada, Las Vegas – Department of Reprographic Services.
Downloaded by [University of Nevada Las Vegas] at 17:46 15 January 2014
Refereed
43
Cokins, G. (2001). Activity-based cost management: An executive guide. NY: John Wiley & Sons, Inc. Cooper, R. (1989). The rise of activity-based costing – part 4: what do activity-based cost systems look like?, Journal of Cost Management, (Spring), 38–49. Cooper, R. (1990). Cost classification in unit based and activity-based manufacturing costs systems. Journal of Cost Management, 4, 2–14. Cooper, R., & Kaplan, R. (1992). Activity-based systems: measuring the costs of resource usage. Accounting Horizons, 6, 1–11. DeFranco, A., & Noriego N. (2000). Cost Control in the Hospitality Industry. Upper Saddle River, New Jersey: Prentice Hall. Dittmer, P. (2003). Principles of Food, Beverage, and Labor Cost Controls, 7th ed. New York: John Wiley and Sons, Inc. Garrison, R., & Noreen, E. (1997). Managerial accounting (8th ed.). NY: Irwin McGraw-Hill. Hayes, D.K., & Huffman, L.M. (1985). Menu analysis: A better way. Cornell Hotel and Restaurant Administration Quarterly, 26, 64–70. Kaplan, R., & Cooper, R. (1992). Measure costs right: no longer. Journal of Management Accounting Research, 1, 2–15. Kasavana, M., & Smith, D. (1990). Menu Engineering-A Practical Guide to Menu Analysis (revised edition), Okemos, MI: Hospitality Publications, Inc. Kasavana, M., & Smith, D. (1982). Menu Engineering-A Practical Guide to Menu Analysis. Okemos, MI: Hospitality Publications, Inc. LeBrutto, S., Ashley, R., & Quain, W. (1995). Menu engineering: a model including labor, FIU Hospitality Review, 13, 41–50. LeBrutto, S., Ashley, R., & Quain, W. (1997). Using the contribution margin aspect of menu engineering to enhance financial results. International Journal of Contemporary Hospitality Management, 9, 161–167. Miller, J. (1980). Menu Pricing and Strategy. Boston, MA: CBI. Parsa, H., Njite, D., & King, T. (2005). Why Restaurants Fail. Cornell Hotel and Restaurant Quarterly, 46, 304–322. Pavesic, D. (1985). Prime numbers: finding your menu’s strengths, Cornell Hotel and Restaurant Quarterly, 26, 70–77. Raab, C. (2003). The feasibility of activity-based costing in the restaurant industry. (Doctoral Dissertation, University of Nevada, Las Vegas, 2003). Raab, C., & Mayer, K. (2003). Exploring the use of activity-based costing in the restaurant industry,” International Journal of Hospitality and Tourism Administration, 4, 25–48. Raab, C., Mayer, K., Ramdeen, C., & Ng, S. (2004). The application of activity-based costing in a Hong Kong buffet restaurant. Conference Proceedings, CHRIE Annual Convention. Raab, C., Hertzman, J., Mayer, K., & Bell, D. (2006). Activity-Based Costing Menu Engineering: A New and More Accurate Way to Maximize Profits from your Restaurant Menu. Journal of Foodservice Business Research. 9. Raab, C., Shoemaker, S., & Mayer, K. (2006). The Feasibility of Activity-Based Costing in the Restaurant Industry: An Innovative Way to Analyze your Menu. International Journal of Hospitality and Tourism Administration. 9.
44
JOURNAL OF FOODSERVICE BUSINESS RESEARCH
Downloaded by [University of Nevada Las Vegas] at 17:46 15 January 2014
Schmidgall, R. (1997). Hospitality industry managerial accounting, (4th ed.), Lansing, MI: Educational Institute – American Hotel & Motel Association. Turney, P. (1991). Common cents. The ABC performance breakthrough. Boston: Cost Technology.