Available online at www.sciencedirect.com
Procedia - Social and Behavioral Sciences 65 (2012) 94 – 99
International Congress on Interdisciplinary Business and Social Sciences 2012
The Application of Neural Network and Logistics Regression Models on Predicting Customer Satisfaction in a Student-Operated Restaurant Aisyah Larasatia*, Camille DeYongb, Lisa Slevitchc *
b
a Department of Industrial Technology, Universitas Negeri Malang, Malang 65145, Indonesia School of Industrial Engineering and Management, Oklahoma State University, Stillwater 74074, United States c School of Hotel and Restaurant Administration, Oklahoma State University, Stillwater 74074, United States
Abstract A student-operated restaurant has to balance the achievement of its objectives as a profit generator and as a learning centre. This unique characteristic distinguishes a student-operated restaurant from other types of restaurant. This study aims to build a model to predict overall customer satisfaction in a student-operated restaurant. The input variables consist of 32 dining service attributes, which are derived from DINESERV factors. Data was collected using a close-ended questionnaire and was distributed using a convenience random sampling approach. A neural network model and a logistic regression model were built to predict overall customer satisfaction. The result shows that the best neural network model built in this study was the MLP neural network model with two hidden layers. The correct classification rate of this model was 80.65% and 69.81% for the training and testing data set. The top three important attributes that influence overall customer satisfaction are customer satisfaction toward service, responsive service and excellent service. In addition, the best logistic regression built in this study was a stepwise approach. This model had a correct classification rate at 73.39% and 69.17% for training and testing data set. The result of logistic regression shows that two significant dining attributes that influence overall customer satisfaction are customer satisfaction with service quality and food quality. Based on the correct classification rate, this study concludes that a neural network model has a better performance to predict overall customer satisfaction than a logistic regression model. However, a neural network model may not be the best model to determine the most significant input variable toward an output variable since it cannot be proven using a statistic method.
© 2012The Published Elsevierby Ltd. Selection © 2012 Authors.byPublished Elsevier Ltd. and/or peer-review under responsibility of JIBES University Jakarta Indonesia. Selection and peer-review under responsibility of JIBES University, Jakarta Keywords: customer satisfaction, neural network; logistics regression; student-operated restaurant
*
* Corresponding author: Aisyah Tel.: +62-341-7790567;. E-mail address:
[email protected].
1877-0428 © 2012 The Authors. Published by Elsevier Ltd.
Selection and peer-review under responsibility of JIBES University, Jakarta doi:10.1016/j.sbspro.2012.11.097
Aisyah Larasati et al. / Procedia - Social and Behavioral Sciences 65 (2012) 94 – 99
1. Introduction In the current economic decreasing, the restaurant industry sales are expected to exceed $1.5 trillion in 2009 - a 2.5 percent increase over 2008. This number represents 4% of the U.S. gross domestic product and employing 9% of the U.S. workforce (National Restaurant Association, 2009). In restaurant industries, customers are not only consuming tangible goods, such as food and drink, but also intangible services. Thus, establishing a good relationship between customer and frontline employee of a food service organization is a key factor to create a positive experience (Jaksa, Robert, & John, 1999). As other food and beverage outlets, a student-operated restaurant has to generate profit in order to cover its expenses. However, a student-operated restaurant has different characteristics from other types of restaurants. Other than as a profit generator, a student-operated restaurant also functions as a learning centre. To optimize the learning function, students experience job rotations regularly in order to make each student be an expert on various skills. Moreover, a student-operated restaurant is also operated by different students in each semester. The unique characteristics of this restaurant make it have a higher complexity to be analyzed than other types of restaurants. This study aims to predict customer satisfaction, which is represented by the overall customer satisfaction level. Overall customer satisfaction is driven by customer perception toward the performance of dining satisfaction factors. These factors are derived from the DINESERV factors (Jaksa, Robert, & John, 1999; Stevens, Knutson, & Patton, 1995). Since the previous studies by Anderson & Sullivan (1993) and Kamakura, Mittal, De Rosa, & Mazzon, (2002) posit that an overall satisfaction shows a diminishing sensitivity toward dining attribute performance, this study applies a neural network model to classify customer satisfaction based on their perceived value toward the performance of the DINESERV factors. The remainder of this paper is organized as follows. Section 2 reviews the literature on measuring customer satisfaction and neural network application. Section 3 explains the methodology used in this study including data collection and experiment processes, neural network models, and the performance metric used in this study. The following part explains the experimental results. Finally, the Section 5 of this paper describes the conclusion of this study. 2. Literature Review Literatures that discuss studying the relationship between the performance levels of attributes and overall customer satisfaction can be classified into two groups. First group explains that the relationship between attribute level and overall satisfaction is linear and symmetric (Mittal, Ross, & Baldasare, 1998; Oliver, 1997). Linear relationship means that an increase in attribute level at a certain level leads to an increase of overall satisfaction at the same level and the decreasing of attribute level on a certain degree will lead decreasing overall satisfaction proportionately. The other group states that the relationship between attribute level and overall satisfaction is nonlinear and asymmetric (Anderson & Sullivan, 1993; Kamakura, et al., 2002; Mittal & Kamakura, 2001). That is, the impact of a certain increase is not equal to the impact of the same amount of decrease. That difference is not only in the term of level (size) but also in the term of direction (Anderson & Mittal, 2000). Statistical methods and neural network are two main methods used to predict customer satisfaction. Some research applied statistical method, such as Eskildsen & Nussler (2000) who predicts customer satisfaction in several companies in Denmark by using partial least square, and Gustafsson & Johnson (2004) conducted customer research in pharmacy industry and employed multiple regressions and partial least square. In addition, Lariviere (2008) conducted a study of customer satisfaction in a financial service company and used structural equation model to analyze data. On the other hand, other studies employed neural network to predict customer satisfaction. These studies argued that the relationship between attribute level and overall satisfaction is nonlinear and asymmetric. Thus, statistical method, which depends on assumptions of linearity and non-collinearity between input variable, is not capable to perform well. Therefore, neural network has better capability to model customer satisfaction since neural network has the ability to deal with any non-linear functions, multi-collinearity within the input variable and capable to analyze data with any distribution (Lin, 2007). Two main areas of the application of neural networks in customer research studies are to determine the most critical attribute that influence customer satisfaction (W. Deng, 2007; W. J. Deng, Chen, & Pei, 2008; W. J. Deng, Kuo, & Chen, 2008) and to predict overall customer satisfaction (Behara, Fisher, & Lemmink, 2002; Lin, 2007). Furthermore, research that compare statistical method and neural
95
96
Aisyah Larasati et al. / Procedia - Social and Behavioral Sciences 65 (2012) 94 – 99
network to predict customer satisfaction have shown that neural networks perform better than statistical methods (Gronholdt & Martensen, 2005; West, Brockett, & Golden, 1997). Neural network model is one of data mining technique. Garver (2002) indicated that data-mining techniques has capability to perform better than traditional statistical techniques since data mining techniques are able to mitigate several assumption of statistical techniques, such linearity, multi-collinearity, and normal distributed data. Garver (2002) proposed the use of decision tree and neural network models to investigate customer behavior. In addition, Bounsaythip & Runsala (2001) described many data mining techniques to model customer behavior. This study illustrated the application of K-Nearest neighbors, SOM, neural network, and decision tree to model customer behavior. It also pointed out advantages and limitations of each data mining technique. Although many studies have applied data mining techniques to model customer behavior, none of these studies takes place in a teaching restaurant. A teaching restaurant is a unique business since students operate the restaurant. This type of restaurant also has to gain profit and maximize the learning rate of students. This study uses neural network models to forecast customer satisfaction in a teaching restaurant. The reason is that a neural network model is a supervised learning model and suitable for classification purposes. The models use customer perceived value toward attribute performance of DINESERV as input variable and use overall customer satisfaction as output variable. This study compares some neural network architecture available on PASW Modeler 13, such as multilayer perceptrons (MLP), radial basis function (RBF), quick, dynamic, prune and exhaustive prune method in order to find out the best neural network architecture for this study. Finally, since many study pointed out that the limitation of the neural network is its inability to explain the relationship between input and output variable, this study conducted sensitivity analysis to explore the causal relationship between input and output as proposed by Sharda & Delen (2006). This study determined the most important attribute to be improved based on both variable (attribute) importance resulted from the model and the sensitivity of this attribute. 3. Method 3.1. Data Collection This study used data that were collected through a sampling survey in Fajar Teaching Restaurant at Universitas Negeri Malang by distributing a closed-ended questionnaire to customer. The questionnaire consists of 6 parts: 1) questions of customer dining pattern, 2) customer perceived value toward dining attribute, 3) customer perception on their overall customer satisfaction, 4) customer retention and word-of-mouth, 5) customer perceived value on the student performance, and 6) customer demographic data. This study used the second and the third part of the questionnaire only. Both of these parts used seven-points the Likert type scale. On the customer perceived value toward dining attributes, 1 refers to strongly disagree to the statement and 7 refers to strongly agree to the statement. On the customer perception of the overall satisfaction, 1 refers to strongly dissatisfied and 7 refers to strongly satisfied. There were 257 valid responses used in this study out of 308 responses received from the survey. Invalid responses are caused by missing values on more than 25% of questions. Among 257 valid responses is not found any missing value. Thus, there is no treatment on replacing missing value on the data. 3.2. Data and Variable Definitions The independent variables used in this study were derived from DINESERV factors, which cover food quality, service quality, price, convenience, and ambience. Based on frequency distribution of the data, the customer perceived value on scale 1 -3 has a small percentage compared to other point of scale. In average, the cumulative percentage on scale 1 to 3 is only 8.38%, which is ranged from 3.1% (friendly greeting) and 24.9% (music entertainment). Furthermore, the customer perception of overall satisfaction is ranged from 3 to 7. Thus, this study needs to transform the independent and dependent variable. Customer perceived value, which is ranged from 1 to 3, is transformed to 3. Thus, in the neural network model, there was only 5 point of scale: 3 to 7 point. This model contained 32 input variables and 1 output variable. The input and output variable names are shown in Table 1.
Aisyah Larasati et al. / Procedia - Social and Behavioral Sciences 65 (2012) 94 – 99
97
3.3. Neural Network Model The first step to build the model is to divide collected data into three parts: training, validation, and testing data. Training data comprised of 50% of data, while validation and testing comprised of 30% and 20% of data. Random seed was used to generate each type of data. The neural network model was built in IBM SPSS Modeler. Based on the misclassification rate on testing data, this study found that MLP architecture showed the best performance. Since, this study had found that the best architecture was MLP, then the next phase was to find the best topologies of MLP. After several trials, for this study’s problem domain, two hidden layers MLP architectures consistently generated better prediction than a single hidden layer. This study assigned 32 processing elements (PE’s) in the input layer and assigned 20 and 10 PE’s to the first and second layers respectively. Table 1. Input and Output Variables Name Variable Description Food Quality 3a Menu Variation 3b Taste 3c Food Appeal 3d Food Temperature 3e Freshness 3h Food Quality Price 3f Portion 3g Price
Variable Description Service Quality 3i Greeting 3j Helpful Waiter 3k Responsiveness Waiter 3l Friendly service 3m Respectful Waiter 3n Excellent Service 3o Knowledge about food 3p Self Cleanness 3q Follow standard food 3r Skillful 3s Direct respond to 3t Fast service 3u Food service
Variable Description Convenience 3x Aisle in service area 3z Menu card Comfortable 3v Clean Environment 3w Comfortable Layout 3y Clean facility Satisfaction 4a Satisfaction to food 4b Satisfaction to service 4c Overall satisfaction
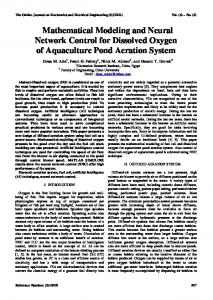
3.4. Performance metrics This study used a success rate to measure the predictive performance of the neural networks. The percent of a success rate is the aggregate ratio of total correct classifications for all classes to the total number of samples in a particular classification problem. A higher success rate indicates a better classification performance. 4. Result 4.1 Neural Network Results Since the aims of this study is to build the best performance of a neural network model in order to find out the relationship between DINESERV attributes and overall customer satisfaction, this study chooses a neural network model with the highest percent success rate in both training and testing data as the model reference to get the DINESERVE attribute importance. The confusion matrix of the best model used in this study is shown at Figure 1. This matrix shows the percent of the success rate in training, testing and validating data. The confusion matrix shows that the neural network model built in this study fails to predict the overall customer satisfaction when customer feel dissatisfy (level3). The possible reason for this result is that the relatively small percentage of customer who feel dissatisfy. Total number of dissatisfy feeling is only 3.1% of total respondents.
Figure 1. Confusion Matrix and Percent Success Rate of the Best Neural Network Model
98
Aisyah Larasati et al. / Procedia - Social and Behavioral Sciences 65 (2012) 94 – 99
The neural network model also provides the input variable importance, which implies the effect of each attribute to overall customer satisfaction level. Based on the variable importance, this study concludes that the top three important variables are customer satisfaction with the service quality (4b), responsive service (3t) and excellent service (3u). 4.2 Comparison with Logistic Regression One of the common statistic methods for estimating classification problem is the logistics regression. Since this problem has a five-level of output variable, thus a multinomial logistic regression was chosen. After several trials, this study found that the stepwise method resulted in the best correct classification rate compared to other methods such as backward, backward stepwise, and enter. The backward and enter method resulted in 100% correct classification for training data set, but had a lower correct classification for testing data set (