In many remote sensing studies of geophysical fields such as clouds, land cover, or sea ice characteristics, the fractional area coverage of the field in an image ...
REMOTE SENS. ENVIRON. 48:339-346 (1994)
The Area Coverage of Geophysical Fields as a Function of Sensor Field-of-View Jeffrey R. Key* I n many remote sensing studies of geophysical fields such as clouds, land cover, or sea ice characteristics, the fractional area coverage of the field in an image is estimated as the proportion of pixels that have the characteristic of interest (i.e., are part of the field) as determined by some thresholding operation. The effect of sensor fieldof-view on this estimate is examined by modeling the unknown distribution of subpixel area fraction with the beta distribution, whose two parameters depend upon the true fractional area coverage, the pixel size, and the spatial structure of the geophysical field. Since it is often not possible to relate digital number, reflectance, or temperature to subpixel area fraction, the statistical models described are used to determine the effect of pixel size and thresholding operations on the estimate of area fraction for hypothetical geophysical fields. Examples are given for simulated cumuliform clouds and linear openings in sea ice, whose spatial structures are described by an exponential autocovariance function. It is shown that the rate and direction of change in total area fraction with changing pixel size depends on the true area fraction, the spatial structure, and the thresholding operation used.
INTRODUCTION An analytical description of the relationship between the satellite-derived fractional area coverage of a geophysical field and sensor resolution is needed in order to assess the potential error in many satellite-derived products and to understand in a more quantitative man-
*Cooperative Institute for Research in EnvironmentalSciences, Division of Cryosphericand Polar Processes, Universityof Colorado, Boulder Address correspondence to Jeffrey R. Key, CIRES, Univ. of Colorado, Campus Box 449, Boulder, CO 80309-0449. Received 30 September 1992; revised 8 January 1994.
0034-4257 / 94 / $ 7.oo @Elsevier Science Inc., 1994 655 Avenue of the Americas, New York, NY 10010
ner the benefits of different sensor systems. While there have been studies of the effect of sensor resolution on parameter retrieval, the approaches have been empirical and specific to a single geophysical variable. In the analysis of land cover classes, for example, the variance within satellite images has been examined as a function of measurement scale for the purpose of determining the optimal resolution for change monitoring (e.g., Woodcock and Strahler, 1987; Townshend and Justice, 1988). In studies of cloud fraction, real and synthetic data containing cloud fields were degraded in resolution, and the fractional coverage was observed as a function of scale (e.g., Wielicki and Parker, 1992; Wielicki and Welch, 1986; Shenk and Salomonson, 1972). Even though these studies are useful, no concise statement of the relationship between fractional coverage and sensor resolution has been given, so that the results are difficult to generalize to other geophysical fields. A complete analytical description of the problem is difficult at best, involving geometrical (viewing geometry), spectral (band location and width), radiometric (signal-to-noise ratio, quantization levels), and spatial (sensor resolution or pixel size) properties. In this article, a first attempt at an analytical approach to the problem is described. We are concerned only with the fraction of the image area covered by some geophysical parameter, for example, cloud or open water fraction. We take an approach similar to that of Shenk and Salomonson (1972), where cloud fields were simulated and the relationship between pixel size, cloud size, estimated area fraction, and true area fraction were expressed for different thresholding operations. That work is extended, however, by generalizing the problem to any geophysical variable whose spatial structure can be described by its autocovariance function. Additionally, a specific probability density function is used as a model of the subpixel area fraction so that the results do not depend upon a given simulation. In this manner the results are applicable to a wide variety of geophysical
339
340
Key
fields including clouds, sea ice fractures ("leads"), and land cover classes. In the next section the anaytical approach is described. The models are then applied to simulated fields of clouds and sea ice leads in a satellite image context. ANALYTICAL APPROACH Our goal is to determine the proportion of pixels in an image that have the characteristic of interest; for example, the fraction that are cloudy or that are sea ice leads, etc., given some thresholding operation. This depends on the distribution of the subpixel area fraction, which is specified by its shape, mean, and variance. The variance depends on the pixel size and the spatial structure of the geophysical parameter, described by its autocovariance function. The formalization that follows can be applied to virtually any geophysical parameter whose spatial distribution can be described in this manner. Indicator Function Let q(x) be a measurable property (e.g., temperature or reflectance) at a point whose position is represented by the location vector x, and define ( to be any condition on q. For example, ( might be the condition q(x) < T~- g, where Ts is the surface temperature and g is some threshold amount. The indicator function I(x) in a square region R is equal to 1 if q(x) satisfies ( and 0 otherwise. The fractional coverage for which q satifies ( is given by
p=A~ 2 I, I(x) dx,
(1)
where A~ is the side length of R and is a normalizing factor. For the rest of the discussion R is a satellite image. The probability density function (pdf) of I is f(1) = P and f(O) = 1 - P. Now let q~(y) be a measurable property of a pixel Z within R centered at location y (again, a vector). As measured by the sensor, q~ would be an average over a pixel:
q~(y)=A;2 f
q(x)dx, z(y)
where A~ is the side length of the pixel. An argument could be made for using the sensor point spread (transfer) function, but for simplicity a rectangular spatial response is assumed. The fractional area of R for which qz satisfies (is an estimate of the true fractional coverage and is iv' = N-~ Z Ix(y),
(2)
R
To determine P' analytically, the probability density of I~ must be known. It is not trivial, and depends on P, (, pixel size, and the way in which objects satisfying are distributed in space. Since I~ is a function of q~, which in turn depends on the fractional coverage within a pixel p~, then (under certain conditions) I~ can be expressed in terms of pz. For example, consider a cloud pattern where the cloud top temperature Tc is everywhere the same and is less than the surface temperature Z~. Let ( be a thresholding operation such that Iz =
l0 ifq~ < L - d i , otherwise,
where g is some threshold amount. This is equivalent to I~ =
0 i f pz t> p, otherwise.
(3)
The expression pz >/p states that the fractional coverage within the pixel is greater than some quantity p, which in this example has a value such that (1 -p)Ts+pT~< T~-g. In reality there may be a distribution of Tc, although we do not address this issue here. So, based on Eq. (3), the probability density of I~ is 3~(1) = Prob(e~ >I p), fi~(0) = Prob(Pz < p) = 1 -fiz(1), where Pz represents the random variable subpixel fractional coverage (with specific realization p~), and Prob(P~/> p) represents the probability that the fractional coverage within the pixel is greater than some quantity p. Now, how is Prob(P~/> p) determined? Distribution of Subpixel Area Coverage For a single pixel the fractional coverage of the geophysical parameter is pz(Y) = A ; 2 SZ(ylI(x)dx, which can be used as an estimate of the true area fraction in the image P. After Stoyan et al. (1989, p. 184), the expected value and variance of Pz are
g = E(Pz) = P, (re = Var(Pz) = E[P~ - E(Pz)]z
=
(4)
[a;21 t(x) dx,) Z
x [A; 2 I I(x3 d x ' - P] ,) Z
where N is the number of pixels in R and Iz is the indicator function for the pixel based on q~, defined in the same way as is I (for a point) based on q. Our goal is to relate P' to P over a range of Az.
where k, is the autoeovarianee function for the indicator
Area Coverage of Geophysical Fields
function. The effect of pixel size on the autocovariance function has been studied by Jupp et al. (1988; 1989), although the autocovariance function in (5) does not depend on pixel size; that is, it refers to the true underlying (point) autocovariance. The expression (5) for the variance of the subpixel area fraction can be expanded as a 2 = Az
4
i?
k,(r)rlA2[2n
-
341
Beta Distributions of Subpixel Area Coverage Mean=0.2 5~i ~': ~, ~1~
~3
-. - -
Vor=O.01, S=0.25 Vor=O.05, S=0.56 Vor=0.10, S=0.79
iL',.'
8~(r)]
- 8Ar~/2 cos[n/4 + ~(r)] + 2r e cos[e~(r)] } dr, (6)
where
~(r)=
0.0
I O, 1/4cos-'[l+[2/(,/2-1)](1-rla)],
O \
~
the distribution of pz is bimodal so that a range of thresholds would yield the same, correct P', that is, P' = P. At a large pixel size there may be only one correct threshold, but it is within the range found for the small pixel case. When dealing with DNs (temperatures, reflectances, etc.), however, this may not be the case. Further research is needed concerning the effect of "regularization," or the averaging over the point spread function of sensors. The work of Jupp et al. (1988; 1989) is important in this regard. Given the pixel unmixing problem when the spectral structure of the field is complex, one way (perhaps the only way at present) to relate the DN threshold to the subpixel area fraction threshold is to choose a DN threshold very close to the background value. This is analogous to choosing a small subpixel area fraction threshold, as in the top plot of Figure 2. If the pixel size is small enough relative to the spatial structure of the field, then P' will be a good estimate of P. If the pixel is not small, then all that can be said is that P' >t P (see Figure 2, top). How small is small? To more easily address this and similar questions, Figure 6 was constructed as an aid in the interpretation of (8). The figure shows the normalized variance as a function of relative pixel size A and the slope of the
0.4
E 0.,__,
0.2 0.0
iI~ ".L'"---r:_-.:..I:..~+. ,
0.0
,
,
I
0.2
,
,
,
t
.
.
.
.
.
I
0.4 0.6 0.8 Subpixel Area Fraction
,-
,:1[-. 1.0
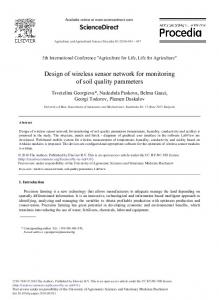
Figure 6. The variance of the distribution of subpixel area fraction computed from Eq. (8), normalized by P(1 -P), as a function of relative pixel size and the slope of the exponential covariance function a. To determine the actual variance, the contour value must be multiplied by P(1 -P).
Figure 5. Complement of the cummulative probability function of subpixel area fraction for the cloud field in Figure 3, using two different relative pixel sizes. Shown are the observed and estimated distributions, where the estimated functions are based on the true total area fraction and the observed and estimated variances in subpixel area fraction (Table 1).
10
Normalized Variance
8
N
Ol
For example, suppose thermal data are being examined for the purpose of estimating cloud fraction. Even if the background (land or ocean) temperature is known, a small deviation from that temperature in a pixel could be caused by a small amount of very cold cloud or a large amount of cloud only slightly colder than the background, or numerous other combinations of cloud amount, cloud optical thickness, and cloud top temperature. The problem is that a single threshold in terms of subpixel area fraction Pz can translate into a range of temperature thresholds and vice versa. In theory, there is a single Pz threshold that would yield the same P' over a wide range of pixel sizes. This can be seen most readily in Figures 1 and 5. At the smallest pixel size
¢/~-._x fl~. "~ "~ rr
6
4
2
0 0.0
0.2 0.4 0.6 0.8 Slope of Exponential
1.0
Area Coverage of Geophysical Fields
exponential covariance function a. The normalization was done by computing Eq. (8) without the P ( 1 - P ) term so as to remove the dependence on P. Therefore, to use this figure, the reported values must be multiplied by this term to retrieve the actual variance of the subpixel area fraction distribution. The two important relationships in Eq. (8) that are illustrated in Figure 6 are that an increase in the pixel size or an increase in the rate at which the covariance drops off with distance both result in a decreasing variance. Not shown in Figure 6 but implicit in (8) is the relationship between P and the variance: the variance of Pz is maximum when P = 0.5 for a constant A and a. Now, if we interpret the previous condition that a DN threshold close in value to that of the background translates into a subpixel area fraction threshold of approximately 0.2 (for the purpose of illustration), then Figures 2 and 6 can be used together to answer "what if' questions. For example, suppose that the geophysical field had an exponential autocovariance with a = 0.4 and the true area fraction is 0.2. What would be the estimated total area fraction P' with a relative pixel size of 2? The variance based on Figure 6 would then be approximately 0.11 and from Figure 2 the estimated area fraction would be about 0.28 with a threshold of 0.2, 0.19 with a threshold of 0.5, and 0.12 with a threshold of 0.8. With a relative pixel size of 6, the variance is 0.056 and the area fraction estimates are 0.36, 0.13, and 0.02, respectively. It should be noted that in theory a beta distribution that is consistent with the observed autocovariance function can be chosen. The regression method of estimating the rate of decay of the autocovariance described by Eq. (9) also provides an estimate of P. From these two parameters the variance in Eq. (8) is then determined, thereby defining the beta distribution. However, the autocovariance is affected by pixel size, as described in Jupp et al. (1988; 1989). Therefore, the autocovariance determined by Eq. (9) must be translated into the "true" (point) autocovariance before the correct beta distribution can be determined. SUMMARY AND CONCLUSIONS
In most analyses of geophysical fields in satellite imagery each pixel is eventually labeled as either containing or not containing the variable of interest. This labeling is accomplished through a thresholding operation, where pixels whose DN is different from the background DN by more than some threshold amount are labeled as being part of the geophysical field. Estimates of the area coverage of the field are obtained as the proportion of these pixels in the image. The actual subpixel area fraction (Pz) of the geophysical field varies considerably, however, as a function of the true area fraction, the spatial structure, and the pixel size. It has been shown
345
here that the beta distribution is an adequate model of the distribution of Pz. In the simple case of a uniform target (e.g., a cloud deck) and a uniform background, the DN thresholding operation can be described in terms of a subpixel area fraction threshold. The estimate of the total area fraction within an image is then the probability of obtaining a subpixel amount greater than the threshold, which can be easily determined from the beta distribution. The statistical models presented allow us to answer many questions in a hypothetical sense about the effect of spatial structure, pixel size, and thresholding operations on the estimated fractional area coverage in an image. It should be clear from the results presented here that the thresholding approach can result in substantial errors. Of course, if the subpixel area fraction were known, then there would be no need for employing the threshold procedure. Unfortunately, geophysical fields are often complex so that the relationship between a DN threshold and a subpixel area fraction threshold is not clear. Additional research is needed in this area to define the effect of pixel size on the distribution of DNs (e.g., temperature, reflectance) in an image. There are other approaches to the scaling problem that deserve mention. The basic idea of labeling pixels to estimate area fraction can be described by the set operations of erosion and dilation used in mathematical morphology (Serra, 1982). For example, pixels can be labelled as "hitting" an object if any part of the object is within the pixel and "not hitting" otherwise. This is analogous to thresholding near the background value. As the pixel size approaches, the image size the estimated area fraction approaches unity. On the other hand, if a "hit" is defined to occur only if the pixel is completely inside an object, the estimated area fraction approaches zero as the pixel size increases. Fractals have also been used to describe the relationship between area coverage and measurement scale. For example, in Cahalan and Joseph (1989) the relationship between cloud area and perimeter was described by a fractal scaling law for clouds. The scaling properties of stream channels have been described in terms of "fat" fractals (Karlinger and Troutman, 1992). Rainfall amounts have been studied as cascade processes (Gupta and Waymire, 1993). Unfortunately, these are all specific to a particular geophysical variable, and are difficult to generalize to remote sensing studies.
This work was supported by NASA Grants NAGW-2407 and NAGW-2598 and ONR Grant NOOO14-90-J-1840. Thanks are due to D. Jupp, T. Over, and S. Peckham for useful discussions, and to an anonymous reviewer for helpful suggestions. Mathematica was used for many of the numerical and symbolic computations.
346 Key
REFERENCES
Cahalan, R. F., and Joseph, J. H. (1989), Fractal statistics of cloud fields, Monthly Wea. Rev. 117(2):261-272. Falls, L. W. (1974), The beta distribution: a statistical model for world cloud cover, J. Geophys. Res. 79(9):1261-1264. Gringorten, I. I. (1979), Probability models of weather conditions occupying a line or area, J. Appl. Meteorol. 18:957977. Gupta, V. K., and Waymire, E. C. (1993), A statistical analysis ofmesoscale rainfall as a random cascade, J. Appl. Meteorol., 32(2):251-267. Henderson-Sellers, A., and McGuffie, K. (1992), Investigation of the Burger distribution to characterize cloudiness, J. Climate 4:1181-1209. Jones, P. A. (1992), Cloud-cover distributions and correlations, J. Appl. Meteorol. 31(7):732-741. Jupp, D. L. B., Strahler, A. H., and Woodcock, C. E. (1988), Autocorrelation and regularization in digital images I. Basic theory, IEEE Trans. Geosci. Remote Sens. 26(4):463-473. Jupp, D. L. B., Strahler, A. H., and Woodcock, C. E. (1989), Autocorrelation and regularization in digital images II. Simple image models, IEEE Trans. Geosci. Remote Sens. 27(3):247-258. Karlinger, M. R., and Troutman, B. M. (1992), Fat fractal
scaling of drainage networks from a random spatial network model, Water Resources Res. 28(7):1975-1981. Rothrock, D. A., and Thorndike, A. S. (1984), Measuring the sea ice floe size distribution, J. Geophys. Res. 89(C4):64776486. Serra, J. (1982). Image Analysis and Mathematical Morphology, Academic, London. Shenk, W. E., and Salomonson, V. V. (1972), A simulation study exploring the effects of sensor spatial resolution on estimates of cloud cover from satellites, ]. Appl. Meteorol. 11:214-220. Stoyan, D., Kendall, W. S,, and Mecke, J. (1989), Stochastic Geometry and Its Applications, Wiley, New York, 345 pp. Townshend, J. R. G., and Justice, C. O. (1988), Selecting the spatial resolution of satellite sensors required for global monitoring of land transformations, Int. J. Remote Sens. 9(2):187-236. Wielicki, B. A., and Parker, L. (1992), On the determination of cloud cover from satellite sensors: the effect of sensor spatial resolution, J. Geophys. Res. 97(D12):12,799-12,823. Wielicki, B. A., and Welch, R. M. (1986), Cumulus cloud properties derived using Landsat satellite data, J. Clim. Appl. Meteorol. 25:261-276. Woodcock, C. E., and Strahler, A. H. (1987), The factor of scale in remote sensing, Remote Sens. Environ. 21:311316.