analysis showed that a school's disciplinary climate and student/teacher relationships were predictors of student outcomes in reading in all countries. The model ...
The Association Between Learning Environment and Student Engagement and Performance in Reading: Results from the Pacific Rim in PISA 2000
John Cresswell
Australian Council for Educational Research
Paper presented at PISA International Conference WHAT Do the PISA Results Tell Us About the Education Quality and Equality in the Pacific Rim
21~22 November 2003
The Association Between Learning Environment and Student Engagement and Performance in Reading: Results from the Pacific Rim in PISA 2000
John Cresswell
Australian Council for Educational Research
PISA International Conference WHAT Do the PISA Results Tell Us About the Education Quality and Equality in the Pacific Rim Hong Kong, 21-22 November 2003
ABSTRACT Student perceptions of their school and classroom environments have been the subject of much interest and research in recent decades. This paper reports on the use of the OECD/Programme for International Student Assessment as a way of measuring students’ perceptions of school and classroom environment and relating those perceptions to their results in PISA in the countries around the Pacific rim. A Hierarchical Linear Modelling - HLM (Bryk & Raudenbusch, 1992) approach is used to analyse the data, and significant relationships have been found that will provide useful information for teachers, policy-makers and researchers. There are two sources of data relating to school and classroom environment in PISA – the Student Questionnaire, which the students complete in the same testing session as the cognitive items and the School Questionnaire, which the principal completes. The data analysis for PISA led to the creation of some constructed variables which are explored in this paper and described in the international reports (OECD, 2001) (OECD/UNESCO, 2003). The variables include students’ perceptions of disciplinary climate, achievement press the amount of teacher support, student/teacher relationships and the students’ sense of belonging at school. The students also gave an indication of their level of engagement with reading.. The School Questionnaire included information from the principal about teachers’ morale, teachers’ participation in decision-making and student/teacher relationships. This paper presents a detailed discussion of the significant associations that were calculated at both the student level and the school level between students’ perceptions of their classroom environment and their reading score and their level of engagement with reading. Regression analysis showed that a school’s disciplinary climate and student/teacher relationships were predictors of student outcomes in reading in all countries. The model which included climate factors explained different amounts of variance across the countries of the Pacific rim, but some factors were significant in all countries. The OECD/Programme for International Student Assessment (PISA) will provide data every three years on student learning outcomes in a number of different domains and also give details of perceptions that students hold about their teachers, classrooms and schools. The information gained will provide valuable guidance for teachers and policy makers.
© John Cresswell 2003
2
PISA International Conference WHAT Do the PISA Results Tell Us About the Education Quality and Equality in the Pacific Rim Hong Kong, 21-22 November 2003
INTRODUCTION Much attention has been focused on research into the factors that influence student learning outcomes in schools. Walberg (1991) wrote about these factors which were grouped into three main areas, Student Aptitude, Instruction, and Psychological Environments. Walberg wrote (p. 108), “It seems possible that optimised learning environments could lead to enormous increases in academic learning and real-world achievements.” Fraser (1986), believed that researchers and teachers should “include classroom environment scales as part of the batteries of measures used in school evaluations and school effectiveness studies”. Moos (1979) believed that the setting must first be conceptualised or understood before its impact on student behaviour could be evaluated. Anderson and Walberg (1974) wrote that a strong case for environmental research had been made by Bloom (Bloom, 1964), who in reviewing work on growth rates and environmental effects, “pointed to the development of measures of environment as crucial for accurate prediction and effective manipulation of learning.” Two factors that affect any person’s behaviour are the genetic background they have and the environment in which they grow up. There has been much interest in the degree of influence each one of these factors has. Assessing the relative influence of genetic background and environment is extremely difficult, however, since there is a constant interaction between these two and other factors during a child’s development. Lewin (1936) wrote that a person’s behaviour (B) is a function of the relationship between the person (P) and the environment (E). This was summarised in his dictum, B = f(P,E). Based on this is the work of Murray (1938), who developed the “Needs-Press” model as a theory of personality. Murray wrote that individuals have specific needs and that the strength of these needs characterises personality. Needs is an internal factor in determining behaviour. Press, on the other hand, represents the environment (the external factor) that is affecting the type of behaviour that an individual displays. Murray also distinguished between two types of press. He wrote that alpha press is the press that actually exists and can be measured, whereas beta press is a person’s own interpretation or perception of surroundings. Much of the data gathered for this project was the students’ own perceptions of their environment. STUDYING HUMAN ENVIRONMENTS Approaches to studying human environments were described by Moos (1973). He wrote that one way to describe a human environment is by examining the psychosocial and social dimensions of the environment as perceived by either insiders or outsiders, in a framework of person-milieu interaction. This is the approach that has been used to describe the environment in this study. Based on his work in the child care field, Moos wrote (1979) that “the social ecological setting in which students function can affect their attitudes and moods, their behaviour and performance and their self-concept and general sense of well-being.” Moos believed that students’ perceptions could provide valuable insights into educational settings. Other researchers in the area of classroom environment agree with this perceptual approach (Fraser, 1986). One of the advantages of this method is that it is more economical. Other advantages of the method of using student perceptions were that judgements were based on long term observation, not just one encounter, and that student perceptions of the environment can actually be a determinant of behaviour. © John Cresswell 2003
3
PISA International Conference WHAT Do the PISA Results Tell Us About the Education Quality and Equality in the Pacific Rim Hong Kong, 21-22 November 2003
THE OECD/PROGRAMME FOR INTERNATIONAL STUDENT ASSESSMENT (PISA) The OECD’s Programme for International Student Assessment (PISA) aims to measure how well students nearing the end of their compulsory schooling are prepared for adult life. The assessment is forward looking, focusing on students’ ability to meet real-life challenges, rather than testing whether they have mastered a particular curriculum. The first PISA survey was carried out in 2000 in 32 countries (including 28 OECD member countries), with about 200000 students doing the assessments. Subsequently, another 12 countries undertook the assessment and the results of the two groups were combined into a single database. This paper is based on analysis of some of the countries in that database – the countries defined as being around the Pacific rim – Australia, Canada, Chile, Hong Kong, Indonesia, Japan, Korea, Mexico, New Zealand, Peru, Thailand and the USA. There were stringent sampling requirements in place to guarantee a sample representative of the 15year-old population in each of the participating countries. The students were chosen in a strictly controlled, two-step sampling process. The sampling plan for each country was approved by an international sampling referee to guarantee that the procedures were the same in all countries. The first step was to randomly select sufficient schools to allow a sample of at least 4500 students (in each school 35 students were randomly chosen from the lists supplied by the schools). In some countries, it was necessary to oversample the smaller states and territories to allow for meaningful comparisons. To be included in the international reports (OECD/UNESCO, 2003), (OECD, 2001), countries had to obtain participation of at least 85% of the schools in the defined sample. Students were given a two hour test which assessed their abilities in three main domains: reading, mathematical and scientific literacies. The term ‘literacy’ is used to indicate a broad conception of knowledge and skills. The survey will take place every three years and each time a different domain will be focused upon. In 2000, reading literacy was the major domain. This means that the majority of testing time is devoted to this domain. In 2003 the major domain is mathematical literacy, and in 2006, it will be scientific literacy. The assessment items are created under the guidance of groups of experts that have been established for the domains. The items are extensively trialled in all the participating countries to verify that they are identical in all countries and are not culturally or geographically biased. Measures are also taken to monitor the administration of the tests to ensure that the procedures are the same in all countries. The resulting international database (OECD, 2003) is, therefore, a reliable set of data that can be used for valid between country comparisons and analysis of within country results. STUDENT RESULTS IN READING LITERACY Overall results Scores in PISA were standardised to a mean of 500 and a standard deviation of 100 across the OECD countries. Table 1 shows the mean score in reading literacy of each of the countries around the Pacific rim. It can be seen that the scores range from 327 (Peru) to 534 (Canada).
© John Cresswell 2003
4
PISA International Conference WHAT Do the PISA Results Tell Us About the Education Quality and Equality in the Pacific Rim Hong Kong, 21-22 November 2003
Table 1. Student performance in reading literacy in the Pacific rim countries. Country Australia Canada Chile Hong Kong Indonesia Japan Korea Mexico New Zealand Peru Thailand USA
Reading literacy score 528 534 410 525 371 522 525 422 529 327 431 504
Standard Error 3.5 1.6 3.6 2.9 4.0 5.2 2.4 3.3 2.8 4.4 3.2 7.0
Figure 1 is a graphical representation of these results. The white line in the middle of each block represents the country’s mean and the shading above and below the white line represents the 95% confidence limits of the mean – that is the scores within which we can be confidently sure that the mean will occur 95 per cent of the time (please see the box below on Standard Errors).. If there is an overlap of the countries then their results are not significantly different. It can be seen that there is a group of countries (Australia, Canada, Hong Kong, Japan, Korea, New Zealand and the USA which have scored in the range 504-534. These scores (apart from the USA) are significantly above the OECD mean of 500. The other group of countries (Chile, Indonesia, Mexico, Peru and Thailand) score significantly below the OECD mean. This paper will explore the characteristics of the students in these countries with the aim of informing policy makers.
.
STANDARD ERROR
If one makes estimates about a population (such as mean reading score) by analysing a sample drawn from that population, it is likely that the sample estimate will be slightly different from the population parameter. In this report estimates of population parameters are often presented within 95 per cent confidence limits. This means that there is a 95 per cent chance that the estimate of a population parameter lies within plus or minus 1.96 standard errors of the sample estimate. For example, if a region’s mean student performance is 520 with a standard error of 4 then sampling theory indicates that we can be 95 per cent confident that the mean in the population from which the sample was drawn is between 512 (=520-1.96x4) and 528 (=520+1.96x4). The 95 per cent confidence interval is 512 to 528.
© John Cresswell 2003
5
PISA International Conference WHAT Do the PISA Results Tell Us About the Education Quality and Equality in the Pacific Rim Hong Kong, 21-22 November 2003
550
500
450
400
350
SA U
nd
u
ai la
Th
Pe r
ea M ex N ic ew o Ze al an d
an
Ko r
Ja p
g on es ia
Ko n
In d
hi le C H
on g
an a C
Au st ra
lia
da
300
Figure 1. Student performance in reading literacy in the Pacific rim countries.
Results by gender In the initial international report it was found that girls significantly outscored boys in reading literacy in all countries. This pattern has been continued with the extra countries which completed the assessment in 2002 with the exception of Peru, where there is no significant difference between boys and girls. Table 2. Results by gender in reading literacy in the Pacific rim countries. Country
Female
Australia Canada Chile Hong Kong Indonesia Japan Korea Mexico New Zealand Peru Thailand USA
546 551 421 533 380 537 533 432 553 330 448 518
© John Cresswell 2003
Standard Error 4.7 1.7 4.6 3.6 4.6 5.4 3.7 3.8 3.8 5.3 3.1 6.2
Male 513 519 396 518 360 507 519 411 507 324 406 490
Standard Error 4.0 1.8 4.3 4.8 3.7 6.7 3.8 4.2 4.2 6.3* 3.9 8.4
6
PISA International Conference WHAT Do the PISA Results Tell Us About the Education Quality and Equality in the Pacific Rim Hong Kong, 21-22 November 2003
*not significant
CLASSROOM AND SCHOOL CLIMATE MEASURES IN PISA In addition to the cognitive tests, students were asked to complete a questionnaire which asked them about their home background, their parents, their family and their attitudes to school. It is from this set of data that students’ perceptions of their classrooms and schools were obtained. From a factor analysis of the results obtained a number of different scales of students’ perceptions their school and classroom climate have been described. Each of the scales is made up of a number of different questionnaire items. Table 3 shows each of the climate scales and the items that are combined to make that scale. Also listed in Table 3 are the scales relating to engagement with reading (which was done by all countries) and interest in reading (which was done by most countries). Table 3.
School climate scales in PISA 2000 Scale
Index of student perceptions of teacher support
Items (Categorised: Never, Some lessons, Most lessons, Every lesson)
How often do these things happen in your English lessons? The teacher shows an interest in every student’s learning The teacher gives students an opportunity to express opinions The teacher helps students with their work The teacher continues teaching until the students understand The teacher does a lot to help students The teachers helps students with their learning
Index of student perceptions of disciplinary climate
(Categorised: Never, Some lessons, Most lessons, Every lesson)
How often do these things happen in your English lessons? The teacher has to wait a long time for students to settle down Students cannot work well Students don’t listen to what the teacher says Students don’t start working for a long time after the lesson begins There is noise and disorder At the start of the lesson, more than five minutes are spent doing nothing
Index of student perceptions of student/teacher relations
(Categorised: Never, Some lessons, Most lessons, Every lesson)
How often do these things happen in your English lessons? Students get along well with most teachers Most teachers are interested in students’ well-being Most of my teachers really listen to what I have to say If I need extra help, I will receive it from my teachers Most of my teachers treat me fairly
Index of student perceptions of achievement press
(Categorised: Never, Some lessons, Most lessons, Every lesson)
How often do these things happen in your English lessons? The teacher expects students to work hard The teacher tells students that they can do better
© John Cresswell 2003
7
PISA International Conference WHAT Do the PISA Results Tell Us About the Education Quality and Equality in the Pacific Rim Hong Kong, 21-22 November 2003
The teacher does not like it when students hand in careless work Students have to learn a lot Index of student’s sense of belonging in the school
(Categorised:Strongly disagree, Disagree, Agree, Strongly agree)
My school is a place where: I feel left out of things I make friends easily I feel like I belong I feel awkward and out of place other students seem to like me I feel lonely I do not want to go I often feel bored
Index of engagement in reading
(Categorised:Strongly disagree, Disagree, Agree, Strongly agree)
I read only if I have to Reading is one of my favourite hobbies I like talking about books with other people I find it hard to finish books I feel happy if I receive a book as a present For me, reading is a waste of time I enjoy going to a bookshop or a library I read only to get information that I need I cannot sit still and read for more than a few minutes
Index of interest in reading
(Categorised:Strongly disagree, Disagree, Agree, Strongly agree)
Because reading is fun, I wouldn’t want to give it up I read in my spare time When I read, I sometimes get totally absorbed
The students’ responses to each of the items in a scale were combined to give an index score for that scale. This index score was standardised with a mean of zero and a standard deviation of one across the OECD countries. If a country’s mean score is positive it means that the students have scored above the OECD mean on that scale. Some caution is needed in interpreting negative scores, as they don’t necessarily signify a negative attitude, just that the mean is below the OECD mean. The score for each of the five student climate scales are listed for each country in Table 4. One of the main purposes of this paper is to observe the strength of association between school and classroom climate and performance on PISA reading literacy. For this reason, the correlation between each scale and reading performance has been calculated for each country. This is a simple bivariate correlation between the climate and the reading score without taking other variables into account. The multilevel regression analyses reported later in this paper give an indication of the independent effect of each variable when the other variables have been accounted for. A bivariate correlation is a convenient starting point to explore relationships between variables.
© John Cresswell 2003
8
PISA International Conference WHAT Do the PISA Results Tell Us About the Education Quality and Equality in the Pacific Rim Hong Kong, 21-22 November 2003
Table 4.
Mean scores on climate measures and correlation with reading performance by country.
Country
Teacher support
Australia Canada Chile Hong Kong Indonesia Japan Korea Mexico New Zealand Peru Thailand
0.41 0.31 0.30 -0.22 -0.07 -0.17 -0.67 0.07 0.34 0.30 -0.06
USA
Correlation School Correlation Student- Correlation Achieve- Correlation Sense of Correlation with disciplinary with teacher with ment with belonging with reading reading climate reading relationship reading press reading 0.07 -0.09 0.16 0.17 0.16 0.09 -0.09 -0.05 0.04 0.04 -0.14 0.13 0.25 0.15 0.20 -0.10 0.12 0.04 -0.02 -0.32 0.09 0.07 -0.02 0.12 -0.23 0.20 0.20 0.01* 0.00 0.16 0.08 0.11 -0.18 -0.10 -0.42 0.11 0.12 0.39 -0.02 0.59 0.09 0.23 0.13 -0.21 0.22 0.08 0.49 0.22 -0.32 0.19 -0.41 0.06 -0.35 0.08 0.07 0.20 0.10 -0.16 0.09 0.06 0.19 -0.39 0.12 -0.02 0.17 0.02 0.55 0.03 -0.11 0.0 0.09 0.24 0.05 -0.15 0.10 0.14 0.12 0.34 -0.14 -0.02 0.05 0.11 -0.06 -0.02 0.49 0.03 -0.03 0.08 -0.20 0.30 0.06 0.18 0.10 0.41 0.05 -0.45 0.01 -0.31 0.23
0.34
0.07
0.03
0.14
0.20
0.19
0.42
-0.02
-0.06
m: not all countries did this part of the questionnaire * not significant
Teacher support Students in Australia indicated the highest level of teacher support in the Pacific rim, while those in Korea indicated the lowest. Interestingly, in both countries the correlation between teacher support and reading performance is the same and both countries scored similar high results. It is possible that a complicating issue for this scale is that students who have the most teacher support (probably the weaker students) are the ones less likely to succeed in the assessment. School disciplinary climate This is an important climate factor and in most countries there is a positive correlation with reading score. For students in Japan it is important as they perceived the most positive disciplinary climate of all the countries and, in Japan, this was also more highly correlated with success than in the other countries. Student-teacher relationships The correlation between student-teacher relationships and reading performance is important as it is positively correlated in all but one of the countries. Higher than average scores were obtained in Indonesia, Mexico and Peru. Achievement press Achievement press is a measure of how much the students feel pressure that they must succeed. The correlation of achievement press with reading literacy is not consistent across the countries and some countries that scored above the OECD mean in reading literacy scored below the mean in achievement press. There could be a similar effect here as there is with teacher support where students who feel the most pressure may be the ones less likely to succeed. © John Cresswell 2003
9
0.14
PISA International Conference WHAT Do the PISA Results Tell Us About the Education Quality and Equality in the Pacific Rim Hong Kong, 21-22 November 2003
Sense of belonging This scale measures the degree to which a student feels happy to be at school is able to make friends and get along with others. It is positively related with reading literacy, although in the Pacific rim there are only three countries (Canada, Chile and Mexico) which score above the OECD mean. Correlations with reading score were calculated for not only the climate factors, but also with students’ interest and engagement in reading and with background factors such as socioeconomic status, gender and number of books in the home. Socioeconomic status (SES) in PISA was measured based on parental occupation. It is found that, in international studies, this measure of SES is more comparative across countries than other measures that may include wealth factors (size of house, number of cars in the household etc). STUDENT BACKGROUND FACTORS IN PISA While the focus of this paper is the relationship between school and classroom climate and reading performance, it is important to take account of the fact that engagement with reading, socioeconomic status, gender and other home background factors are significantly associated with reading as well. They have, therefore, been included here and form part of the multilevel analysis in the next section of the paper. Table 5. Mean scores on background measures and correlation with reading performance by country.
Australia
Enjoyment Correlation Interest in Correlation Socio Correlation Number of Correlation Correlation of Reading with Reading with economic with books at with of gender reading reading Index reading home reading with reading (female) -0.07 0.41 -0.02 0.34 52.25 0.32 4.90 0.29 0.17
Canada Chile Hong Kong Indonesia Japan Korea Mexico New Zealand Peru Thailand USA
0.00 -0.05 0.07 0.54 0.09 0.02 0.29 0.01 0.27 0.12 -0.13
0.42 0.29 0.11 0.12 0.19 0.33 0.33 0.38 0.03 0.28 0.32
m -0.01 0.33 m m -0.31 0.15 0.07 m 0.35 0.02
m 0.19 0.26 m m 0.31 0.08 0.32 m 0.15 0.26
52.83 39.87 42.25 36.38 50.54 42.80 42.48 52.20 40.42 33.02 52.40
0.28 0.42 0.19 0.33 0.08 0.19 0.39 0.31 0.38 0.26 0.34
4.68 3.35 3.16 2.88 4.20 4.47 3.23 4.69 3.00 3.25 4.32
0.27 0.38 0.27 0.15 0.22 0.33 0.37 0.36 0.38 0.26 0.42
0.17 0.14 0.09 0.14 0.17 0.10 0.12 0.21 0.03* 0.26 0.13
* not significant
As noted earlier in the paper, gender is significant with a positive correlation indicating that females, on average, scores higher than males. Separate analysis for each country shows that this is true for all the countries that participated in PISA except Peru. MULTILEVEL MODELLING OF PISA CLIMATE FACTORS In recent years there have been methodological and software design advances resulting in statistical techniques known as ‘Multilevel’(Goldstein, 1987) or ‘Hierarchical’ Linear Models – HLM (Bryk & Raudenbusch, 1992). These techniques allow for analysis which examines, simultaneously, differences between students within schools and differences between schools. This allows for both
© John Cresswell 2003
10
PISA International Conference WHAT Do the PISA Results Tell Us About the Education Quality and Equality in the Pacific Rim Hong Kong, 21-22 November 2003
student level and school level effects to be investigated and looks at students in schools as part of a multilevel structure. These techniques are especially relevant to school climate studies which need to take account of school level policies and practices being articulated through classrooms to individual students. It is possible to consider a number of different levels of analysis when exploring factors associated with student achievement, because students are clustered within classrooms, which are clustered within schools within districts, states or countries. This analysis of the PISA data considers two levels – the student level and the school level. There is no classroom level because of the nature of the PISA sample – it is an aged based sample, probably drawn from different classes within the school and in some cases, from different year levels. The ratio of between-school variance compared to the total student variance is an important measure when comparing education systems in different countries. This ratio is called the intraclass correlation. A higher measure of intraclass correlation indicates a higher level of variance in student performance explained by school factors, meaning that attendance at a particular school is a more important factor. If the intraclass correlation is low it means that the schools in the country are more similar to each other and it is less important which particular school the student attends. In the Pacific rim countries the intraclass correlation varies from 16.3 per cent in New Zealand to 55.1 per cent in Peru. This means that choice of school in Peru is an important factor associated with student performance – more so than it is in New Zealand. Other countries with an intraclass correlation above 50 per cent are Chile (53.8 per cent) and Mexico (53.5 per cent). Table 6.
Intraclass correlations for countries in the Pacific rim.
Country
Intraclass correlation
Australia
16.8
Canada
17.2
Chile
53.8
Hong Kong
47.3
Indonesia
40.3
Japan
45.4
Korea
37.5
Mexico
53.5
New Zealand
16.3
Peru
55.1
Thailand
31.9
USA
27.2
The climate factors at the student level have already been discussed in a previous section of the paper. There are two ways that school level factors can be created. Firstly, it is possible to aggregate student factors to generate a mean school value – for example, the mean socioeconomic status of the students at a school can be calculated, and generally it has been found to have an effect separate to individual students’ socioeconomic status. In this way it is also possible to generate school level environment factors, such as the mean school students’ perceptions of the disciplinary climate. The second way to investigate a school factor is to examine facets of school organisation or school level climate derived from principals’ responses to the PISA School Questionnaire.
© John Cresswell 2003
11
PISA International Conference WHAT Do the PISA Results Tell Us About the Education Quality and Equality in the Pacific Rim Hong Kong, 21-22 November 2003
Climate factors such as the principals’ perceptions of teacher morale, student behaviour, the level of autonomy in decision-making, are also investigated. The proportion of variance explained by the various level 1 and level 2 factors is investigated using Hierarchical Linear Modelling with reading performance as the outcome (or dependent) variable. A simple equation for the model could be represented by:
Reading performance =
constant + effect of level 1 factors + effect of level 2 factors + random effects at both level 1 and level 2
In the analysis for this paper the model is built up in the following sequence: 1. the student climate factors; 2. the reading engagement factors; 3. the student background characteristics; 4. mean school socioeconomic status; 5. mean school climate factors; and finally 6. school organisational factors. This sequence allows for the description of the variance explained alone by the climate factors, and then the increasing amount of variance explained by the addition to the model of each of the factors is calculated. The results of the multilevel analyses are shown in Tables 7 and 8. Table 7 shows the percentage of between student variance (Level 1) explained by various factors in each of the Pacific rim countries. Students’ perceptions of school climate factors explained an average of three per cent of the variance in performance. In the Pacific rim countries, students’ perceptions of school climate in Australia explained more variance than in the other countries. Further analysis of the coefficients in the model gives an indication of which particular climate factors are significant. In Australia, it can be seen that the factors that are significant are disciplinary climate, where a one standard deviation increase is associated with an increase of 4 score points in reading, student/teacher relationships (also an increase of 4 score points) and achievement press (a decrease of 8 score points). The fact that a higher perception of achievement press is associated with a lower score is consistent with the negative correlation in Table 4, where it was postulated that this may be because the students who feel the most pressure to succeed are the ones who are not succeeding and therefore, will score less on this assessment.
© John Cresswell 2003
12
PISA International Conference WHAT Do the PISA Results Tell Us About the Education Quality and Equality in the Pacific Rim Hong Kong, 21-22 November 2003
Table 7.
Percentage of student variance explained in countries in the Pacific rim.
Level 1 – percentage of between student Australia Canada variance explained by: students’ perceptions of school climate
Chile
Hong Indonesia Japan Kong
Korea
Mexico
New Zealand
Peru
Thailand
USA
5.8
3.5
3.5
1.2
1.8
1.0
0.8
2.3
3.6
4.7
3.5
3.5
12.5
15.8
7.3
6.2
1.6
8.2
7.4
4.6
13.0
1.0
4.6
12.0
5.4
4.4
2.7
1.1
2.8
1.4
2.8
1.4
7.1
2.1
4.4
5.6
school mean socioeconomic status
0.3
0.1
0.0
0.0
0.1
0.0
0.0
0.0
0.1
0.0
0.1
0.2
school mean climate factors
0.0
0.0
0.0
0.0
0.0
0.0
0.0
0.0
0.1
0.1
0.0
0.0
school mean organisational factors
0.0
0.0
0.0
0.0
0.0
0.0
0.1
0.1
0.0
0.0
0.0
0.0
Total student variance explained by model
24.0
23.8
13.5
8.5
6.3
10.6
11.1
8.4
23.9
7.9
12.6
21.3
Peru
Thailand
USA
students’ engagement with reading students’ home background and gender
Table 8.
Percentage of between-school variance explained in countries in the Pacific rim.
Level 2 - percentage of between-school Australia Canada variance explained by: students’ perceptions of school climate
Chile
Hong Indonesia Japan Kong
Korea
Mexico
New Zealand
10.3
3.5
9.5
3.6
4.5
6.4
6.3
4.8
8.9
9.8
6.6
7.1
21.2
16.6
8.0
11.9
0.5
3.2
14.9
0.0
16.4
0.0
6.2
11.1
31.1
19.4
18.8
4.6
12.9
5.1
10.4
15.5
31.4
18.6
21.0
31.3
school mean socioeconomic status
13.9
12.3
31.4
17.4
29.9
12.8
21.0
47.4
14.1
42.1
24.5
22.6
school mean climate factors
2.6
2.2
11.9
12.7
8.5
29.7
26.2
4.6
7.9
6.1
3.0
0.0
0.2
0.6
2.2
22.0
3.4
5.5
2.2
4.5
0.0
0.8
0.0
0.3
79.3
54.6
81.8
72.2
59.7
62.7
81.0
76.8
77.3
77.4
61.3
72.4
students’ engagement with reading students’ home background and gender
school mean organisational factors Total betweenschool variance explained by model
In Table 8 it can be seen that between-school variance can be explained by a number of factors in the model. In some countries a substantial portion of the between-school variance is explained by the mean school socioeconomic status – this is especially the case in Mexico (47.4 per cent), Peru (42.1 per cent) and Chile (31.4 per cent). These countries are also those which have the highest intraclass correlations – that is the largest difference between schools. © John Cresswell 2003
13
PISA International Conference WHAT Do the PISA Results Tell Us About the Education Quality and Equality in the Pacific Rim Hong Kong, 21-22 November 2003
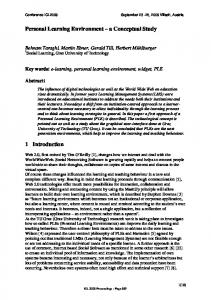
Mean school climate factors explained a larger percentage of the between-school variance in Japan (29.7 per cent) and Korea (26.2 per cent) than the other countries. Mean school measures of organisational factors such as student teacher ratio, school size, school autonomy explained a relatively large percentage of the between-school variance in Hong Kong (22.0 per cent), but only up to four per cent in other countries. Student engagement with reading has been shown to be a most significant factor associated with student performance in PISA (Kirsch et al., 2002). In Canada, it can be seen that 15.8 per cent of the variance in student performance is explained by engagement in reading. In some of the countries that scored well below the OECD mean of 500 (for example, Peru and Indonesia), it can be seen that engagement with reading explained only an extremely small proportion of the variance in student performance. And yet, in these countries, students reported higher than average levels of engagement (0.27 and 0.54 respectively). In these countries more variance was explained by other factors such as mean school socioeconomic status. 600
18.00% 16.00%
500
14.00%
400
12.00% 10.00%
300
8.00%
Variance explained by students?engagement with reading Country mean score
200
6.00% 4.00%
100
2.00%
0 USA
Peru
Thailand
Mexico
New Zealand
Korea
Japan
Indonesia
Hong Kong
Chile
Canada
Australia
0.00%
Figure 2. Variance explained by engagment with reading compared to each country’s mean score.
The results for mean score in reading literacy and the amount of variance explained by engagement with reading is shown in Figure 2. There is a relationship between these two measurements and correlation analysis shows a significant correlation of 0.81. SCHOOL CLIMATE AND READING ENGAGEMENT The previous section of the paper has reinforced the finding that engagement with reading is one of the factors significantly associated with reading performance. This paper now looks at the association of climate factors and engagement with reading using regression analysis at the student level. This gives an indication to educators which classroom climate factors are independently important in contributing to engagement with reading. A focus on these factors by teachers may lead to enhanced engagement in reading on the part of the students. Table 9 summarises this information by listing each country and the student climate factors that are associated with reading performance in those countries.
© John Cresswell 2003
14
PISA International Conference WHAT Do the PISA Results Tell Us About the Education Quality and Equality in the Pacific Rim Hong Kong, 21-22 November 2003
Table 9.
Climate variables significantly associated with reading engagement in the Pacific rim countries.
Climate variable
Australia Canada
Teacher support
Chile
Hong Indonesia Japan Kong
*
*
*
*
*
Korea
Mexico
New Zealand
*
Peru
Thailand
*
*
USA
Disciplinary climate
*
*
*
*
*
*
*
*
*
*
*
*
Student/teacher relationship
*
*
*
*
*
*
*
*
*
*
*
*
*
*
*
Achievement press Sense of belonging
*
Percentage of student variance in reading engagement explained
10.0
6.4
3.0
*
*
*
6.2
12.7
2.8
*
* 3.2
9.1
7.4
*
*
8.5
11.8
* p