Strategy is: "to introduce cost-effective flexible learning modes using a range of educational technologies ... longer) before we can hope to see any difference in our application rates. How can the .... predicted this start up cost can be absorbed.
What’s the return on our investment in flexible delivery in this program? – the Balanced Scorecard Approach by Eveline Fallshaw and Allan Ballagh RMIT University
Introduction RMIT University has signaled its commitment to more effectively using information and communication technologies through its first key strategy in the 1999-2003 RMIT University Strategic Plan. The University is active in working through its plans "to build a strong teaching and learning environment/culture through changing course architecture and product development and enhancement that recognises flexibility in course design, delivery and teaching processes which make full use of new converging technologies". Underpinning this key institutional strategy are a number of related strategies relating to staff, and infrastructure. One of the key operational priorities of the University's Teaching and Learning Strategy is: "to introduce cost-effective flexible learning modes using a range of educational technologies which expand students' learning opportunities and encourage staff to become facilitators of learning." The University is working hard to ensure that all Information Technology (IT) investments are directed towards the achievement of the University's Strategic Plan. The primary driver for IT investment and planning in relation to programs and courses is the Teaching and Learning Strategy and considerable effort and funding is being allocated to staff development programs to ensure there is comprehensive understanding of the University's strategic directions, its goals for flexible learning, and to provide staff with the necessary skills and tools to ensure the University's aims are achieved. The return on investment for the University’s IT investments will ultimately be measured by the value this represents to our students and enterprise clients. This involves utilising the technology to provide a better quality and more cost effective service to students, enterprise clients, and to the community at large, and the redirection of staff effort into more value-adding activities. This is a University-wide undertaking that is sensitive to the varied needs of the diverse discipline areas across all faculties and both higher education and TAFE sectors. The program must achieve a degree of involvement and engagement by staff in a manner unparalleled by past experience, and to this end, staff have access to forums inside faculties and broadly across the University to engage in the reshaping of tertiary and vocational education. It is critical that management is confident that, over time, it is achieving its intended aims and that the strategies it has put in place are delivering the expected outcomes for students, staff and for the university’s bottom line. Considerable effort has therefore been put into developing tools and techniques, which assist in monitoring progress, and the Balanced Scorecard has proved a useful approach. Balanced scorecards Balanced scorecards are strategic management tools that help evaluate performance and encourage good planning. Traditional financial measures - if used alone - are often insufficient performance measures in higher education as success is more appropriately measured across a range of values, including, but not limited to finance. Quality is effectively defined as fitness for purpose. When we are addressing the purposes of a range of stakeholders we need to adopt a performance measurement technique that can reflect the needs of various groups. The balanced scorecard offers a simple method for articulating strategy to staff and students and then monitoring progress toward the university’s goals. The scorecard can be used to define the university’s long-term strategy in terms of specific,
Fallshaw.rtf / E Fallshaw and A Ballagh /22/09/01/ Page 1 of 8
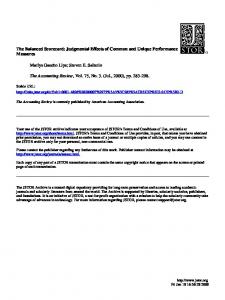
measurable goals simultaneously in different areas of management (financial returns, values of students and other clients, effectiveness of internal services and processes, and learning and growth within the organisation). Kaplan and Norton (1996) suggest that a Balanced Scorecard has four perspectives. When these are translated into the context of higher education the relevant perspectives might look something like this:
Learning and growth of staff Financial returns Development and improvement of educational services Satisfaction of students and clients
The underlying theory of a “balance” within the scorecard assumes there is a cause and effect relationship which might be expressed in the following example: If we train our teaching staff to run threaded discussions Then we will attract more students and enterprise clients (and get more fees)
Then they will use that skill to enrich the students’ learning experience Then student and enterprise satisfaction ratings will improve our reputation in the market
The problem with this strategy is that, while it might be effective in the long run, it may take some time before we see the effect of our staff training. If we have made a mistake in the logic that initially set out the cause and effect relationship between training and financial return then we may have directed a lot of time and effort at something which was never going to deliver what we needed. The hypothesis in our example is simple: if we train our staff on the use of threaded discussions this will provide student groups with a means to conduct flexible, self paced, asynchronous discussions. This in turn will increase student satisfaction with their learning experiences, which will show up in opinion surveys and be reflected in ratings in, for example, The Good Universities Guide. This will in turn attract more applications from students whose choices are influenced by such information.
Assuming the effect of the staff training takes 6 months to permeate through to there being threaded discussions embedded in the courses, and the survey results take another 6 months to collect and publish, then it will be at least a year (and probably longer) before we can hope to see any difference in our application rates. How can the balanced scorecard help us in monitoring our progress towards our intended goal and at the same time help us check that the cause and effect relationships in our hypothesis are being validated in reality? How can we ensure, before we train staff in the use of information and communication technologies, that we are likely to increase the satisfaction of our students with their learning experiences at our university? How do we check we are going to invest our scarce resources in developments which are
Fallshaw.rtf / E Fallshaw and A Ballagh /22/09/01/ Page 2 of 8
likely to lead to business growth and sustainability? The answer is to derive a return on investment plan and to monitor its success carefully. Return on Investment Establishing the business case for investing in flexible delivery at the program level is critical.. However, such analyses ought to be firmly set within an educational framework to ensure that the quality of the students’ learning experiences is maintained and enhanced as well as ensuring that our investment decisions lead to growth in our business revenues. (Bacsich et al 1999). The analysis and resulting decisions will commit the university and the department hosting the program to a considerable investment of staff time and funding and will have an impact on the quality rating and financial viability of the department. The main steps in an appropriate assessment process are described below in the form of a sample case study which includes examples of the types of choices that have to be made and the sort of performance targets that might be set at the planning stage of program renewalTargets can be of two types. They can be used to state how we will measure the overall success of our achievement (lagging indicators) and secondly they can be measures of developing or emerging future success (leading indicators). A sample Balanced Scorecard can be constructed which indicates how such leading and lagging performance indicators can be combined to do two things: to provide a simple means to monitor progress towards the desired goals and, at the same time, to continue to test how our cause and effect hypothesis is holding up over time. In the example above we might set a target of having all our staff trained in the use of threaded discussions by the end of the year. This is a good interim goal as it will be important for staff to acquire these skills if they are to be expected then to embed them in the way they teach. This is therefore a leading indicator as it tests that we are making progress in the desired direction even though we haven’t yet seen any improvement in the education provided to our students. We might then set a target that we expect to see threaded discussions in use for at least 50% of our courses within 6 months of staff completing their training. Again this is a leading indicator of progress according to the cause-effect hypothesis which states that use of threaded discussion will increase as a result of staff training – but we still are not in a position to be sure we had actually made any concrete improvement in ways of value to our customers! Our target might be to improve student satisfaction ratings with their teaching by 25%. If this rise is shown through the survey results then we can say we have achieved one of our intended goals and that our cause-effect strategy has been validated up to this stage. Student satisfaction ratings then become a lagging indicator as we have already completed one of our goals. Our final lagging indicator is the number of applications we receive from qualified candidates. If that too rises then we have validated the cause-effect relationship set out in our initial hypothesis and also achieved our goals of increased customer satisfaction as well as business growth – an excellent return on investment for all stakeholders! This is a rather simplistic example but is illustrative if the general principles involved. Now we’ll go on to look, step by step, at how a Balanced Scorecard might be constructed for a whole program that we are thinking of redeveloping for flexible delivery with a view to improving our market share.
Fallshaw.rtf / E Fallshaw and A Ballagh /22/09/01/ Page 3 of 8
The Return on Investment and Balanced Scorecard Sample Case Study: Step 1: Identify the need or problem and define the objectives
We start by stating in broad terms who needs to learn what and why they need to learn it. For example the Australian University of Technology (AUT) is concerned to ensure that it makes a good impact in South East Asia. E-Commerce is in high demand locally and internationally. AUT has a small department of E-Commerce but most of its work has been done with students on campus in Melbourne. The Chinese government has recently identified a severe shortage of e-commerce experts. AUT has therefore decided to develop a Masters program in E-Commerce for offshore delivery to China and other countries in the region. The host department has done some preliminary research and has set a target of 50 applications for admission from qualified applicants in China in the first year of offering. Potential for the program to succeed in other countries, including Singapore and Vietnam has also been established. Step 2: Consider the strategic context and relationship to the University’s strategic priorities
This E-Commerce proposal aligns with AUT’s current priorities that include opportunities for re-purposing materials, high likelihood of significant fee for service income, significant global market share, and a strong community service element. At the same time AUT seeks to take account of student interests including ensuring that its graduates are highly employable, and that its programs are in high demand. Since the aim of this proposal is to teach a Masters program in E-Commerce oriented to students in China, the external strategic context is clear and this is also consistent with many aspects of AUT’s current priorities. There is likely to be strong demand for the course from local and overseas students already in related employment and it is planned to place significant emphasis on work-integrated learning as a component in the internationalisation and contextualisation of the course materials. The department decides to set a target of at least 10 repeat employers assisting students to enrol on the course by second year of offering and at least 100 enrolments from Singapore and China and Vietnam by 2001. Step 3: Identify the delivery options
Monthly intensive workshops in Shanghai looked promising until staff analysed where potential students were living and it became apparent they would have too far to travel. Attending once each semester in Melbourne supported by online content delivery and threaded discussions looked educationally sound and also feasible, if expensive. In the end a combination of a single, annual, intensive workshop in Shanghai and online delivery was selected. Much of the core material in the existing face-to-face E-Commerce program, which is delivered in Melbourne, can readily be re-used and put online with some contextualisation. This will also develop staff skills in online teaching which will also enable them to develop a new undergraduate program and repurpose courses for offering through the Global University Alliance in 2001. The department has set a target that at least 50% of departmental staff will have been trained in use of online tools by end of semester 1; 8 quality assured courses will be online and in use by offshore students on the Masters in E-Commerce by the end of the year.
Fallshaw.rtf / E Fallshaw and A Ballagh /22/09/01/ Page 4 of 8
Step 4: Outline costs of development and delivery
It is important to assess realistically the costs of development and delivery and to establish that development costs will be fully returned and that there will be a financial return to the university and department. Cost modelling tools need to reflect real costs and allow program developers to test various development and delivery scenarios in terms of their cost implications. A typical cost of delivery assessment will take into account major items such as university, faculty and departmental overheads, travel, accommodation, meals, student assessment, preparation time, student materials, non salary communication cost, module management, maintenance of course content, maintenance of the web site and technical support, departmental/ faculty administrative support, marketing and promotion and equipment lease costs. In this example the costs of delivery analysis, conducted using a modelling spreadsheet provided by the University’s financial services group,indicated that the projected cash flow will cover the expenses involved in a staff member making a single extended trip to Shanghai once a year. Quite a lot of the online work is planned to be oriented to weekends rather than evenings due to the time differences between Melbourne and the students’ locations. Financial modelling based on market anlysis conducted by the department department indicates that development costs will be fully recovered within 2 years; and the department has set as a target that the projected cost of delivery must be supported by actual Activity Based Costing data within ±5%. It must also be seeing repeat business coming from the growing reputation of the course. The target is 10 repeat employers assisting students to enrol on the course by the second year of offering as this will be a good sign the program is meeting market needs. Step 5: Present the conclusions
Development costs for online content would be large fraction of the departmental content development budget and it is considered too risky to use the funds in this way for a new course. Also the level of expertise of staff is still relatively low and it is felt that considerable use of multimedia might delay the completion date for the project. External experts will be brought in from other areas of AUT to do the course web design and train staff to teach online. Provided course enrolments are as predicted this start up cost can be absorbed. Experience shows that the course material goes out of date fairly quickly and the budget assumes 25% of the course material will be rewritten each year. The non-financial benefits of the course are seen as: Contributing to AUT’s involvement with South East Asia − Pushing forward the University’s lifelong learning agenda − Increasing fee for service revenues − Maintaining the University’s reputation for real word research since the department’s research expertise can now be deployed in the service to the regions. − Developing staff capability to provide students with high quality online learning −
Again targets are established to include these non-financial benefits. The department would like to have 4 staff with online courses cited as University exemplars by the end of the year. They hope student satisfaction with online learning (measured during the program in the mid year Survey) will show at least 60% of students are very satisfied (leading indicator) and after they have completed the program they expect Graduates’ satisfaction with the currency and relevance of the
Fallshaw.rtf / E Fallshaw and A Ballagh /22/09/01/ Page 5 of 8
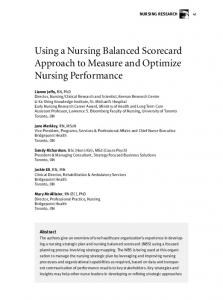
content of the program (Questionnaire data) should show 85% are very satisfied (lagging indicator). The success of increasing fee income and engagement in South East Asia can be determined by meeting a target of 100 admissions from Singapore and China and Vietnam by 2001 and receiving 150 applications form SEA in first year of offering Step 6: Monitoring progress The Balanced Scorecard will assist departments to monitor the achievement of their gaols in renewing courses for flexible delivery. By setting out the “story” about the flexible learning project in a manner which links the various perspectives of the Balanced Scorecard we can set out our assumptions and then ensure our evaluation tests their validity as the business development goes ahead. Before looking in detail at the Balanced Scorecard for the case study example for the Masters in E-Commerce, it’s worth recalling that every “story” about flexible learning projects will have a common underlying logic:
Balanced Scorecard Perspectives
Cause and effect relationships
Staff learning and growth
When teachers and academics understand how to determine the business case for which courses to deliver online, how to plan and facilitate learning experiences integrating flexible delivery, and how to use online tools then ….. this drives
Innovations in internal Our ability to plan and deliver learning experiences services/business processes which develop the required capabilities in a national and at which we must excel to international context then … improve student satisfaction this drives Student satisfaction
Our students satisfaction with studying at AUT and they will recommend AUT to their friends. Employers will be satisfied with AUT graduates and they will be readily employable then ….
this drives Financial and economic AUT’s ability to attract more students in a wider range return on investment results of on and off shore markets and therefore increases from the other drivers revenues
Fallshaw.rtf / E Fallshaw and A Ballagh /22/09/01/ Page 6 of 8
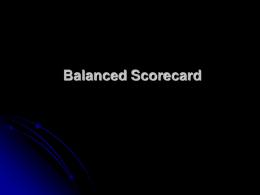
Example: A Balanced Scorecard for Masters in E-Commerce
Now we can put together the Balanced Scorecard for the proposed program and see how, over time, the measures which are built in to it, will allow us to check our progress and validate our cause-effect strategy. Perspectives Learning and growth
Leading Indicators
Lagging Indicators
Number of departmental staff trained in use of online tools
Number of staff with online courses cited as University exemplars
Target: 50% by end of semester 1 Innovations in Number of courses being internal renewed for online delivery services/busines to students on Masters in Es processes Commerce
Target: 4 by end of year Number of quality assured online courses in use on Masters in ECommerce Target: 8 by end of year
Target: 4 by end of semester 1
Students/empl oyers
Student satisfaction with online learning (Survey mid year)
Graduates’ satisfaction with the program Target: 85% very satisfied
Target: 60% very satisfied Number of applications for admission from qualified applicants
Financial return on investment/ sustainability
Target: 50 applications form SEA in first year of offering Development costs must be recovered within 2 years Target 40% cost recovery by end of 1st year
Growth in offshore student numbers: Target: at least 100 admissions from Singapore and China and Vietnam by 2001 Number of repeat employers assisting students to enrol Target: 10 by second year of offering Department ABC data must validate financial projections to within 5% Target: ABC data corresponds to CoD estimates within 5% by end of first year
Fallshaw.rtf / E Fallshaw and A Ballagh /22/09/01/ Page 7 of 8
Conclusion If the department goes ahead and develops an online version of its E-Commerce program it will be able to assess the success of its investment strategy by regularly monitoring the indicators in its Balanced Scorecard. If it is falling behind its target of 50% of departmental staff trained in use of online tools by the end of semester 1 then this will quickly become apparent and efforts can be put into addressing this problem perhaps by increasing
the number of training sessions available to staff. If this had not been identified as a critical factor in the achievement of the desired outcomes then it is likely that no one would have noticed that the plan was slipping behind until perhaps there was no improvement in the student satisfaction survey at the end of the year. By then perhaps another university would have already entered into this market and the opportunity to increase market share may already have disappeared. If we get all our staff trained by the desired date then it will be important to measure how effective this training has been in embedding the flexibility into the courses through the adoption of threaded discussions. Again, a simple measure of this type will allow the strategy to be checked at a critical stage – and if there is little adoption of this technique for communicating with, and between, students then the staff should be encouraged to put in greater efforts in renewing their courses. However, let us also recall that what may be going wrong is that the cause-effect relationship, which we initially set out, was flawed. Perhaps including threaded discussions doesn’t appeal to students – if the ratings don’t improve then we have to check if it’s because the threaded discussions weren’t adopted in many courses or perhaps students don’t like them and the original hypothesis that this would increase student satisfaction was flawed. Whatever it is, it requires some deeper analysis – but the Balanced Scorecard will point out the fact that there is an issue to be investigated and that in itself is very valuable information. The value of the Balanced Scorecard approach is that it encourages staff to articulate their rationale for how they plan to deliver what the students want by developing programs which will meet their needs and this in turn is critically dependent on having staff in place with the right skills and abilities. The Balanced Scorecard allows a quick assessment of a complex set of strategies to be carried out cheaply and frequently and it has the great benefit of allowing us to readily identify when things may be going wrong at the very early stages while there is still time to do something about it and deliver the desired return on investment to all the stakeholders.
References
Bacsich, P., Ash, C., Boniwell, K. Kaplan, L. (1999) “The costs of networked learning”, Sheffield Hallam University. Kaplan, R.S., Norton, D. P., (1999) “The Balanced Scorecard : translating strategy into action”, Harvard University Press.
Fallshaw.rtf / E Fallshaw and A Ballagh /22/09/01/ Page 8 of 8