11446
Biochemistry 2008, 47, 11446–11456
The BARD1 C-Terminal Domain Structure and Interactions with Polyadenylation Factor CstF-50† Ross A. Edwards,‡,§ Megan S. Lee,‡,§ Susan E. Tsutakawa,| R. Scott Williams,⊥ John A. Tainer,|,⊥ and J. N. Mark Glover*,§ Department of Biochemistry, UniVersity of Alberta, Edmonton, Alberta, Canada T6G 2H7, Life Sciences DiVision, Department of Genome Stability, Lawrence Berkeley National Laboratory, Berkeley, California 94720, and Department of Molecular Biology and The Skaggs Institute for Chemical Biology, The Scripps Research Institute, 10550 North Torrey Pines Road, MB4, La Jolla, California 92037 ReceiVed June 13, 2008; ReVised Manuscript ReceiVed August 20, 2008
ABSTRACT:
The BARD1 N-terminal RING domain binds BRCA1 while the BARD1 C-terminal ankyrin and tandem BRCT repeat domains bind CstF-50 to modulate mRNA processing and RNAP II stability in response to DNA damage. Here we characterize the BARD1 structural biochemistry responsible for CstF50 binding. The crystal structure of the BARD1 BRCT domain uncovers a degenerate phosphopeptide binding pocket lacking the key arginine required for phosphopeptide interactions in other BRCT proteins. Small angle X-ray scattering together with limited proteolysis results indicates that ankyrin and BRCT domains are linked by a flexible tether and do not adopt a fixed orientation relative to one another. Protein pull-down experiments utilizing a series of purified BARD1 deletion mutants indicate that interactions between the CstF-50 WD-40 domain and BARD1 involve the ankyrin-BRCT linker but do not require ankyrin or BRCT domains. The structural plasticity imparted by the ANK-BRCT linker helps to explain the regulated assembly of different protein BARD1 complexes with distinct functions in DNA damage signaling including BARD1-dependent induction of apoptosis plus p53 stabilization and interactions. BARD1 architecture and plasticity imparted by the ANK-BRCT linker are suitable to allow the BARD1 C-terminus to act as a hub with multiple binding sites to integrate diverse DNA damage signals directly to RNA polymerase.
The breast and ovarian cancer associated protein, BRCA1, together with its binding partner BARD1 (BRCA1-associated RING domain protein 1), control the cell cycle in response to DNA damage (1, 2). Both proteins interact through N-terminal RING and adjacent helical domains to form a heterodimeric E3 ubiquitin ligase that constitutes the major catalytic activity of the BRCA1-BARD1 complex (3-5). While the direct targets of BRCA1-BARD1 ubiquitination are unclear, targeting likely involves conserved protein-protein interaction domains in both BRCA1 and BARD1. Critical protein-protein interactions are mediated by a pair of sequence repeats at the C-terminus of BRCA1 called BRCT repeats (for BRCA1 C-terminal repeats) (6, 7). Similar repeats are found in a number of proteins involved in the † This research was funded by grants from the National Cancer Institute of Canada (NCIC). M.S.L. gratefully acknowledges the support of an Alberta Heritage Foundation for Medical Research Studentship. Efforts involving the SIBLYS beamline at the Advanced Light Source and the SAXS studies were supported by the NIH Structural Cell Biology of DNA Repair Machines P01 Grant CA92584 and by the Office of Science, Office of Biological and Environmental Research, U.S. Department of Energy, under Contract DE-AC02-05CH11231. Synchrotron access was funded by the Alberta Synchrotron Institute. * Address correspondence to this author. Tel: (780) 492-2136. Fax: (780) 492-0886. E-mail:
[email protected]. ‡ These authors contributed equally to this work. § University of Alberta. | Lawrence Berkeley National Laboratory. ⊥ The Scripps Research Institute.
cellular response to DNA damage (8). In BRCA1, the BRCT repeats mediate interactions with several proteins such as BACH1/BRIP (9), CtIP (10, 11), and Abraxas (12, 13). In each of these cases, the BRCA1 BRCT recognizes a phosphopeptidemotifinthetargetprotein,pSer-x-x-Phe(14,15). A series of structural studies have revealed that the Nterminal BRCT repeat contains a pocket which recognizes the phosphoserine, while the phenylalanine residue is recognized by an adjacent hydrophobic pocket formed at the interface between the N- and C-terminal BRCT repeats (8, 16-20). Cancer-associated mutations have been uncovered which specifically perturb the integrity of this phosphopeptide binding surface, demonstrating the critical importance of these interactions for the tumor suppression function of BRCA1 (16, 21, 22). BARD1 also contains tandem BRCT repeats at its Cterminus, as well as a set of ankyrin repeats immediately N-terminal to the BRCT region. In Vitro peptide binding studies suggest the BARD1 BRCT repeats may bind serinephosphorylated peptides (23), although attempts to isolate phosphorylation-dependent protein binding partners from human cells for the BARD1 BRCT region have been unsuccessful (24). Ankyrin repeats are also well-known protein-protein interaction modules (25, 26), strongly suggesting that this region could also function to recognize targets of the BRCA1-BARD1 complex. Individual ankyrin repeats consist of a helix-turn-helix followed by a β-hair-
10.1021/bi801115g CCC: $40.75 2008 American Chemical Society Published on Web 10/09/2008
BARD1 ANK-BRCT Domain Structure and Binding to CstF-50 pin. Multiple repeats stack together such that the loops protrude from one face of the structure to constitute the protein interaction surface. Both the ankyrin and BRCT repeat regions of BARD1 have been demonstrated to be required for chromosomal stability and homology-directed repair of DNA damage in mammalian cells (27). A number of missense variants within the BARD1 C-terminal regions have been isolated from breast and ovarian cancer patients, further highlighting the importance of this region for BRCA1-BARD1 function (28-30). A series of studies implicate the BARD1 C-terminus in the regulation of mRNA 3′ processing in response to DNA damage (31-34). DNA damage triggers interactions between BRCA1-BARD1 and the CstF mRNA processing complex at the sites of stalled transcription (32, 33). These interactions may regulate the inhibition of transcription through the targeted degradation of RNAP II (31), as well as the transient inhibition of mRNA polyadenylation. Interactions between the BRCA1-BARD1 heterodimer and the CstF complexes depend on direct interaction of the BARD1 C-terminus and the 50 kDa component of the CstF complex, CstF-50 (cleavage stimulation factor 50) (33). Here we have probed the structures and CstF-50 binding characteristics of BARD1 C-terminal regions. Limited proteolysis reveals that the BARD1 ankyrin and BRCT repeats constitute independent folded modules linked by a flexible tether. Small angle X-ray scattering (SAXS) indicates that the ankyrin and BRCT repeats do not adopt a fixed orientation with respect to one another and imply that these protein-protein interaction modules do not form a contiguous rigid surface for interaction with binding partners. Further, the crystal structure of the BARD1 BRCT repeat uncovers a degenerate BARD1 BRCT phosphopeptide binding pocket with intact pSer interacting motifs but which lacks binding determinants for the pSer + 3 hydrophobic specificity pocket at the inter-BRCT repeat interface. Analysis of the CstF-50 binding properties of a series of BARD1 deletion mutants maps the principle CstF-50 interaction site to the ankyrin-BRCT linker. MATERIALS AND METHODS Protein Expression and Purification. Human BARD1 (423-777), BARD1 (423-553), and BARD1 (554-777) were expressed as GST fusion proteins in Escherichia coli strain BL21(DE3) and purified by glutathione affinity chromatography. The BARD1 polypeptides were cleaved from GST using PreScission protease (GE Healthcare Life Sciences) and then purified from GST by anion-exchange (BARD1 (423-553)) or cation-exchange chromatography (BARD1 (423-777) and BARD1 (554-777)) followed by gel filtration chromatography. Human CstF-50 (92-431) was expressed as a GST fusion protein in E. coli strain BL21(DE3) and purified by glutathione affinity chromatography. Residues from 1 to 91 were excluded from the construct to limit possible self-association (35). The protein was then purified by anion-exchange followed by gel filtration chromatography. Proteolytic Mapping of the BRCT Domain. Purified BARD1 (423-777) at 2 mg/mL was digested with 5 µg/ mL trypsin for 0-60 min. The reaction was terminated with phenylmethanesulfonyl fluoride (PMSF), and the reaction
Biochemistry, Vol. 47, No. 44, 2008 11447 products were separated by SDS-PAGE and stained with Coomassie blue. Electrospray mass spectrometry was used to identify the masses of tryptic fragments. Crystallization. Crystals of BARD1 BRCT (554-777) crystal form I (CFI) were grown by vapor diffusion in hanging drops at 4 °C by mixing 2 µL of 25 mg/mL BRCT domain in protein solution (100 mM NaCl, 5 mM Tris-HCl, pH 7.5, 1 mM dithiothreitol) with 2 µL of well solution (12% PEG 8000, 0.1 M citrate, pH 3.9). BARD1 BRCT crystal form II (CFII) was grown by vapor diffusion in hanging drops at room temperature. The crystals were grown by mixing 1 µL of 6 mg/mL BRCT domain with a 1.5-fold molar excess of a Ac-pSDDE-NH2 peptide in protein solution (100 mM NaCl, 5 mM Tris-HCl, pH 7.5, 1 mM dithiothreitol) with 1 µL of well solution (20% PEG 3350, 0.2 M ammonium chloride, pH 6.3). No evidence of bound peptide was found in 2Fo - Fc or Fo - Fc electron maps. For cryopreservation, single crystals were soaked in the appropriate well solution supplemented with 26% (v/v) glycerol and then flash-frozen in liquid nitrogen. Data Collection. All data were collected at beamline 8.3.1 of the Advanced Light Source, Lawrence Berkeley National Laboratory, using an ADSC Q210 detector and a wavelength of 11111 eV. Data were collected on CFI to 2.6 Å from a single, elongated orthorhombic rod crystal. A total of 180° of data were collected using 5 s 1° oscillations at a crystalto-detector distance of 220 mm. The crystal was translated twice at 60° and 120° to minimize radiation damage. Data were indexed as primitive orthorhombic and scaled in the space group P212121. The postrefined unit cell dimensions were a ) 55.5 Å, b ) 67.9 Å, and c ) 120.4 Å, and the mosaicity was 0.24°. Data were collected on CFII to 2.1 Å. Crystals formed in the same space group as CFI but with a different unit cell, a ) 56.8 Å, b ) 75.6 Å, and c ) 118.0 Å (see Table 1). Structure Solution and Refinement. A structure-based sequence alignment was made from the superposition of BRCT repeats from BRCA1 (PDB code 1JNX) and 53BP1 (PDB code 1KZY). The amino acid sequence of the BARD1 BRCT repeat was manually aligned to this structural alignment. Molecular replacement trial models were constructed based on the main chain of the BRCT repeat from 1JNX with side chains mutated to conform to the BARD1 sequence based on the structural alignment. Extended loops and the C-terminal extension were removed from the model. Using this model a dyad search was preformed on data from CFI in MOLREP (36), searching for two copies of the model simultaneously. The rotation function was further constrained to search only the rotations determined from a self-rotation function, also calculated in MOLREP. A solution was found having an initial R-factor and correlation coefficient of 0.561 and 0.229, respectively. Rigid body refinement in REFMAC (37, 38) yielded an R-factor of 0.557 and R-free of 0.575. Rigid-body refinement in CNS gave 0.551/0.545 for R and R-free. Further simulated annealing refinement with torsion angle molecular dynamics in CNS (39) followed by 10 cycles of restrained refinement on maximum likelihood targets gave an R-factor of 0.425 and R-free of 0.469. The model was further refined in CNS to an R-factor of 0.335/ 0.339 with NCS restraints imposed. The model was further refined against the 2.1 Å CFII data set in REFMAC utilizing 2-fold NCS restraints and TLS group anisotropic B-factor
11448
Biochemistry, Vol. 47, No. 44, 2008
Edwards et al.
Table 1: Crystallographic Data Collection, Phasing, and Refinement Statistics CFI space group cell dimensions a (Å) b (Å) c (Å) cell angles (deg) wavelength (Å) resolution range (Å) observations unique reflections completeness (%) 〈I/σI〉 linear R-factor resolution range (Å) R-factor/R-free no. of refined atoms protein water other rms deviations bonds (Å) angles (deg) average B-factors (Å2) main chain side chain and waters all atoms Ramachandran most favored allowed generously allowed disallowed
CFII
P212121
P212121
55.48 67.91 120.40
56.82 75.55 117.97
1.1159 50-2.6 (2.69-2.60) 200053 13944 95.3 (68.2) 31.5 (2.8) 0.052 (0.282) 28.4-2.1 0.223/0.262
1.1159 28.4-2.1 (2.18-2.10) 231155 28825 94.9 (70.0) 35.5 (2.2) 0.032 (0.437)
3312 118 12 0.010 1.221 46.6 47.2 46.9 333 (92.8%) 24 (6.7%) 1 (0.3%) 1 (0.3%)
refinement. The final model contains 3312 protein atoms, 118 waters, and two glycerol molecules. The final R-factor and R-free were 0.223 and 0.262. We were unable to model the N-terminal residues 554-568 in either chain nor residues 742-748 in chain A (part of the extended loop between β3′ and β4′ in the C-terminal BRCT domain), and we presume these regions are disordered in the crystals. All model building was carried out in COOT (40). An asymmetric 7σ peak near His 686 in chain A could not be satisfactorily modeled. The Ramachandran plot contained 92.8% of all residues in the favored regions, and 99.7% of all residues were in allowed regions (Table 1). Atomic coordinates and structure factors have been submitted to Protein Database (RCSB accession code 2R1Z). GST Pull-down Assays. Fifteen micrograms of GST or GST-CstF-50 (92-431) was incubated with 125 µg of the indicated BARD1 constructs for 30 min at 30 °C in 25 µL final volume wash buffer (400 mM NaCl, 20 mM Tris, pH 8.0, 1 mM EDTA, 0.5% NP-40, 1 µg/µL leupeptin, 0.7 µg/ µL pepstatin, and 25 µg/µL PMSF). Binding reactions were incubated with glutathione-agarose beads for 90 min at 4 °C, and the beads were washed four times with the wash buffer. Bound proteins were then eluted and separated by SDS-PAGE and stained with SYPRO Orange (Sigma). SAXS Data Collection. SAXS data were collected at beamline 12.3.1 of the Advanced Light Source, Lawrence Berkeley National Laboratory, at 12 keV on a MAR165 detector and used to analyze the solution architecture, conformation, and assembly of BARD1 samples (41, 42). Samples were maintained at 4 °C during data collection using a thermostatically controlled cuvette. BARD1 (423-553) at concentrations 3, 7, and 15 mg/mL and BARD1 (423-777) at concentrations 2.5, 5, and 10 mg/mL were buffer-
exchanged overnight at 4 °C in 50 µL dialysis buttons, utilizing 6-8 kDa nominal MWCO regenerated cellulose dialysis tubing, against a 50 mL volume of the SAXS buffer (100 mM NaCl, 50 mM Tris-HCl, pH 7.5, 1 mM dithiothreitol). The dialyzed samples were separated into two equal volumes with half the sample being exposed as is and the remainder passed through a 0.1 µm spin filter (Millipore Ultrafree-MC Durapore PVDF 0.5 mL) immediately prior to measurement. A series of exposures (either 6, 60, and 6 s or 6, 6, 60, and 6 s) were measured to assess for radiation sensitivity. Scattering of the dialysis medium alone from 6 or 60 s exposures was subtracted from the scattering of the equivalently exposed samples to yield scattering curves for the macromolecules alone. Data were analyzed using the programs PRIMUS (43), GNOM (44), AUTOGNOM, and AUTORG (45). BARD1 (423-777) at 2.5 mg/mL yielded data that were too noisy for further analysis, even at the longer exposure time. At 10 mg/mL, in both filtered and nonfiltered samples, radiation sensitivity was apparent, leading to curves that tended to higher intensity at low s (s < 0.05 Å-1) with increasing X-ray exposure. Radiation sensitivity appeared attenuated at 5 mg/mL in the nonfiltered sample relative to that seen at 10 mg/mL, and in the 0.1 µm filtered sample was not apparent with the scattering curves of the first and last exposures overlaying within the noise limits of the data. In general, scattering curves of the filtered samples were more consistent, particularly at high s (s > 0.20 Å-1), than their nonfiltered counterparts. Scattering curves of the filtered samples from the initial short 6 s exposure at all three concentrations were scaled and compared to detect possible concentration-dependent oligomerization or aggregation. All three curves superimpose at low s with only slight deviation visible in the 10 mg/mL sample, indicating the filtered samples are inherently monodisperse at 2.5 and 5 mg/mL. To further test for aggregation, plots of log(I(s)) vs s2 (Guinier plots) were used to obtain estimates of the radius of gyration (RG) using the program AUTORG. As only small amounts of aggregate are needed to contribute significantly to scattering at low s, a linear dependence of log(I(s)) vs s2 in the range sRG < 1.3 indicates an absence of aggregation. The increase of RG with accumulated exposure time at 10 mg/mL, from 32.8 Å after 2 s exposure to 39.4 Å after 82 s, clearly shows the radiation-induced aggregation that occurs at this concentration. At 5 mg/mL this trend is not observed (RG 32.3 Å after 6 s and 29.4 Å after 78 s). RG after 6, 6, and 4 s exposure for 2.5, 5, and 10 mg/mL, respectively, are 31.4, 32.3, and 35.2 Å. The scattering curve from the filtered sample at 5 mg/mL, 60 s exposure, was chosen as a BARD1 (423-777) representative curve for further analysis due to its combination of low noise and monodispersity (Figure 2A,C). Multiangle laser light scattering (MALLS) performed at room temperature in the same buffer determined BARD1 (423-777) to be monomeric at 4 mg/mL (see Supporting Information, Figure S1). The RG for the selected BARD1 (423-777) scattering curve as calculated by AUTORG (Figure 2C) was 33.2 ( 0.05 Å using data points 10-45 (0.0155 to 0.0368 Å-1), consistent with that calculated independently using GNOM, RG ) 33.1 Å, at Dmax 100 Å. The first 10 data points were removed for all subsequent analysis due to high associated error (mean percentage error of 5.2% for points 1-10 compared with 1.2% for points
BARD1 ANK-BRCT Domain Structure and Binding to CstF-50
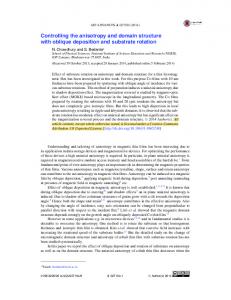
FIGURE 1: The BARD1 ankyrin and BRCT repeats are tethered by a flexible linker. BARD1 (423-777) was digested with trypsin for the times indicated, and the products were analyzed by SDS-PAGE. The open arrow indicates the BARD1-BRCT fragment, and the closed arrow indicates the BARD1-ankyrin fragment.
11-20). All calculations were performed using data in the range 0.016 < s < 0.325 Å-1. BARD1 (423-553) data were treated similarly. AUTORG calculated RG as 16.2 Å using data points 28-101. The first 27 data points were subsequently discarded and data used in the range 0.030 < s < 0.346 Å-1. Estimation of Dmax. The programs GNOM and AUTOGNOM were used to estimate Dmax, the longest intraatomic vector in the solution structure. AUTOGNOM calculated Dmax and RG for BARD1 (423-777) as 99.6 and 32.9 Å, respectively. Further, GNOM was used to evaluate the p(r) function in the range 50 < Dmax < 150 Å spanning the value initially determined by AUTOGNOM. A clear maximum for the Q-score, an overall score used to judge the quality of the solution, was obtained at Dmax 105 Å, consistent with the value obtained from AUTOGNOM. Visual inspection of plotted p(r) curves revealed, however, that while the p(r) function generally tended to p(r) ) 0 at approximately 105 Å, a tail-off of the p(r) function could be observed out to Dmax ∼ 120 Å. The radius of gyration of BARD1 (423-553) calculated from the Guinier plot using PRIMUS was 16.5 Å for data with sRG < 1.3 (Figure 2C). The first 28 data points were excluded. RG and Dmax calculated using GNOM were 16.7 and 50 Å, respectively, with a Q-score of 0.942. Similar results were obtained using AUTORG and AUTOGNOM with RG and Dmax of 16.2 and 49 Å, respectively. SAXS Structure Determination. Ab initio molecular envelopes for the ankyrin repeat domain were calculated using the programs DAMMIN (46) and GASBOR (47). In the later case, intensities were fit in reciprocal space. The programs were repeated 20-40 times with the same input parameters but a different, randomly chosen, value to seed the molecular dynamics calculation. Envelopes from these independent iterations were superimposed, averaged, and filtered using the programs SUPCOMB (48) and DAMAVER (49). A structural model for the ankyrin repeat in BARD1 was created using the 3D-JIGSAW (version 2.0) server (http:// www.bmm.icnet.uk/servers/3djigsaw) in automated mode, which builds three-dimensional models for proteins based on homologues of known structure (50-52). The structural homologue used by 3D-JIGSAW as the basis for the model was gankyrin, containing seven ankyrin repeats (PDB ID 1UOH).
Biochemistry, Vol. 47, No. 44, 2008 11449 The multidomain ankyrin-BRCT construct was tested for interdomain flexibility using the ensemble optimization method (EOM) (53). A pool of 10000 models, treating each domain as a rigid body connected by a flexible linker, was randomly generated using the program RANCH. The pool effectively sampled the possible conformational space of the ankyrin-BRCT structure. A genetic algorithm, implemented in the program GAJOE, was then used to select a subset (ensemble) of models from the pool fitting best to the experimental data. The distribution of two criteria, RG and Dmax, was used to quantitatively compare the optimized ensemble against the pool. The final optimized ensemble consisted of 19 models had a mean RG and Dmax of 30.5 and 95.1 Å, with a range of 12.2 and 38.5 Å, respectively. The mean RG and Dmax of the pool were 31.8 and 100.7 Å, with a range of 25.4 and 87.6 Å, respectively. RESULTS Mapping Structural Domains within the BARD1 CTerminal Region. Sequence analysis of BARD1 C-terminal to the RING domain suggested the presence of three to four ankyrin repeats followed by a pair of tandem BRCT repeats. To better understand BARD1 domain architecture, we first employed limited proteolytic mapping to locate folded protein domains within a purified C-terminal fragment of human BARD1 (423-777) which contains both the ankyrin and BRCT repeat domains. Tryptic digestion rapidly converted BARD1 (423-777) into two protease stable fragments (Figure 1). Electrospray mass spectrometry and N-terminal sequencing of the large trypsin fragment identified a protein with molecular mass 25736 ( 5 Da and an N-terminal alanine, corresponding to BARD1 residues 554-777. This fragment contains both BARD1 BRCT repeats, indicating that the two BRCT repeats form a stable structural unit similar to those of BRCA1 and MDC1 (20, 54). Mass spectrometry of the small fragment revealed a mass of 14301 ( 1 Da matching the BARD1 ankyrin repeat region spanning residues 423-553. This analysis shows that the ankyrin repeat regions and the tandem BRCT repeats each adopt stably folded structures linked by a protease-sensitive linker peptide. X-ray Crystal Structure of the BARD1 BRCT Repeats. To probe the structure of the BARD1 C-terminus, we crystallized and determined the X-ray structure of the tandem BARD1 BRCT repeat domain (554-777). The BARD1 BRCT repeat structure was solved using molecular replacement methods and refined to 2.1 Å resolution (see Materials and Methods). The structure of BARD1 (554-777) is reminiscent of the BRCT repeats in BRCA1 and MDC1 with the two BRCT domains packing in the same head-to-tail manner (Figure 3A). The structure determined here is also essentially identical to the structure of a smaller BARD1 BRCT fragment recently determined by Birrane et al. (55). The N-terminal domains of BRCT repeats whose structures are known are structurally well conserved relative to their C-terminal BRCT domains, which tend to have larger and more diverse loops. A major difference in the N-terminal BRCT domain of BARD1 occurs in the loop between helix R3 and the linker helix. In both BRCA1 and MDC1, a 10-13 amino acid variable loop caps the N-terminal end of the linker helix. This loop is absent in BARD1. Residues in this
11450
Biochemistry, Vol. 47, No. 44, 2008
Edwards et al.
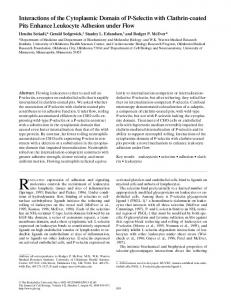
FIGURE 3: Structure of the tandem BRCT repeats of BARD1. (A) Overview of the BARD1 BRCT structure (orange) aligned with the structure of the BRCA1 BRCT (blue) bound to an optimized phosphopeptide target (green) (PDB accession code 1T2V). (B) Details of the phosphopeptide recognition surfaces of BRCA1 and BARD1, colored as in (A). Residues involved in peptide binding are labeled and shown as sticks.
FIGURE 2: SAXS analysis of the C-terminal region of BARD1. (A) Top curve set: Experimental SAXS curve of the ankyrin-BRCT (BARD1 (423-777), black crosses); best fit of the optimized ensemble to the data (red line), χ ) 2.2. Bottom curve set: Experimental SAXS curve of the ankyrin repeat (BARD1 (423-553), black crosses); theoretical scattering curve calculated by CRYSOL of the 3D-jigsaw ankyrin model (blue line); best fit of a single GASBOR ankyrin model (red line), χ ) 2.2. (B) Distance distribution function, p(r), calculated using GNOM. The p(r) function of ankyrin is a bell-shaped curve representative of a compact globular protein. The ankyrin-BRCT p(r) function represents a more elongated structure, tailing off beyond 100 Å. For comparison, the calculated p(r) function of a hypothetical compact model generated by the EOM is shown in red. (C) Guinier plots for BARD1 (423-553) (crosses) and BARD1 (423-777) (dots) with line of best fit. Inset: Kratky plots of BARD1 (423-553) (solid line) and BARD1 (423-777) (double-solid line).
loop make no direct contacts to either the phosphoserine or phenylalanine binding sites. Likewise, the topology and core of the C-terminal domain are conserved. However, the loop connecting β2′ and β3′ is significantly longer in BARD1
covering the base of the C-terminal domain core, distal to the peptide binding face. An amino acid sequence comparison of BARD1 with BRCA1 and MDC1 revealed that the residues involved in directly binding to the phosphoserine in the N-terminal BRCT domain are conserved in BARD1 (Ser1655, Gly1656, Thr1700, and Lys1702) and functionally conserved in MDC1 (Thr1898, Gly1899, Thr1934, and Lys1936) (16). Superposition of the BARD1 BRCT structure on that of BRCA1 and MDC1 further shows that the arrangement of these residues are spatially conserved, consistent with the hypothesis that this surface may also act as a phosphate binding site in BARD1 (Figure 3B). Indeed, a previous peptide selection study suggested that the tandem BARD1 BRCT repeats preferred phosphoserine-containing peptides (15). In contrast to the phosphoserine recognition motifs, the pSer + 3 specificity pocket of BARD1 is quite different from that of BRCA1 (16) and MDC1 (20, 56). Arg1699, one of the critical phosphopeptide recognition residues in this region of BRCA1, hydrogen bonds to the main chain of the +3 residue peptide targets and orients the phenylalanine side chain to dock into the +3 specificity pocket (16). A cancerassociated missense mutation of this residue (R1699W) in
BARD1 ANK-BRCT Domain Structure and Binding to CstF-50 BRCA1 disrupts protein folding (21) and phosphopeptide binding (16), underscoring the importance of this residue in mediating phosphopeptide interactions in the BRCT protein family. In MDC1, the corresponding residue, Arg1933, adopts a similar conformation to Arg1699 in BRCA1 (20). This arginine forms a strong, dual salt-bridging interaction with the negatively charged carboxyl terminus of its interacting peptide, γ-H2AX (56). Interestingly, BARD1 contains a serine instead of an arginine in the +3 specificity pocket, suggesting that interactions with the peptide main chain at +3 may be very different from that of BRCA1 or MDC1. Oriented peptide library analysis indicated that the BARD1 BRCT repeat specifically recognizes pS-[D/E]-[D/E]-E (23). To probe the affinity of the BRCT domain of BARD1 for the predicted peptide substrates, we monitored the change of BARD1 intrinsic fluorescence upon binding to peptide substrates. Binding affinities were measured for the phosphopeptide (fluorescein-pSDDE-CONH2) as well as for the nonphosphorylated counterpart (fluorescein-SDDE-CONH2). BARD1 failed to show any binding to either peptide in these studies, while binding was demonstrated between the BRCA1 BRCT domain and its phosphopeptide target from BACH1 (fluorescein-GGSRSTpSPTFNK-CONH2) (data not shown). The interaction may be transient during DNA damage repair, suggested by the low BARD1-BRCT specificities for the phosphopeptide residues at positions from 0 to +3 (23). A previous report has suggested that Thr714 and Thr734 in BARD1 may be important DNA damage phosphorylation sites (57). Our structure shows that Thr734 is buried within a BRCT repeat whereas Thr714 is exposed to solvent. Therefore, it is unlikely that Thr734 is a true phosphorylation site, possibly explaining why phospho-specific antibody raised against pThr734 peptide failed to recognize BARD1 (57). Inhibition of 3′ mRNA cleavage after DNA damage and preferential degradation of RNAP IIO in BARD1 T734A mutant may be due to its negative effects on integrity of the BRCT repeat structure. In contrast, Thr714 is positioned within a large loop on the surface of the C-terminal BRCT repeat between R1′ and β2′. Probing the Solution Structure of the BARD1 C-Terminal Domain by Small Angle X-ray Scattering. We were unable to crystallize the BARD1 ankyrin-BRCT region (BARD1 (423-777)), suggesting the ankyrin-BRCT linker imparts flexibility to the protein that hinders crystallization. Consistent with this observation and our proteolysis results (Figure 1), residues 554-568 are completely disordered in both chains in the crystallographic asymmetric unit of our BARD1-BRCT structure. We therefore propose that residues 554-568 belong to a flexible linker that connects the ankyrin and the BRCT domains. To further understand the structural nature of the ankryin-BRCT assembly, we employed solution small angle X-ray scattering (SAXS) to study structures of the BARD1 ankyrin repeat and ankyrin-BRCT assemblies. SAXS Analysis of the BARD1 Ankyrin Repeats. The distance distribution function calculated from the X-ray solution scattering of the BARD1 ankyrin repeat region (423-553) shows an asymmetric bell-shaped curve with a peak at r ∼ 18 Å and slightly skewed toward higher r (Figure 2B). Such a curve is typical of a moderately asymmetric but globular protein. An inflection point leading to a tail-off in the curve can be observed at ∼35 Å, perhaps indicating the presence of a second, partially distinct, structural entity. A
Biochemistry, Vol. 47, No. 44, 2008 11451 Kratky plot, while showing a distinct bell-shaped curve, plateaus at I(s)s-2 > 0 (Figure 2C, inset), an indicator that this construct may be partially unfolded in solution (58, 59). Sequence analysis of the ankyrin domain indicates three ankyrin repeats spanning residues 427-525. A possible fourth repeat having poor sequence similarity can be manually assigned to residues 526-548 with the C-terminal loop of the fourth repeat being part of the 20 amino acid linker 549-568. To determine the number of ankyrin repeats in the minimum fragment, BARD1 (423-553) and BARD1 (423-526), which correspond to four and three ankyrin repeats, respectively, were expressed in BL21(DE3). BARD1 (423-526) showed a very low level of expression (data not shown), suggesting that the minimum fragment is most consistent with the domain containing four ankyrin repeats. Further confirmation that BARD1 (423-526) contains four and not three ankyrin repeats comes from a comparison of the maximum dimension of this domain (Dmax) determined from the SAXS data compared with the maximum dimensions of ankyrin repeat structures determined by X-ray crystallography. The SAXS data yields a Dmax of 50 Å for BARD1 (423-553), consistent with Dmax of 49-52 Å for four repeat ankyrin structures (PDB ID 1DCQ, 1N0R, 1S70, 1YCS) and significantly larger than the Dmax of 40 Å for a three repeat ankyrin structure (PDB ID 1N0Q). Next, the ab initio modeling program GASBOR was used to generate models minimizing the fit to the experimental SAXS data in reciprocal space. Multiple iterations of the program were run and the resulting models averaged to give final models that fit the data with average χ2 values of 1.6 (see Materials and Methods and Figure 4). The overall shape of the ankyrin domain is cylindrical with a small constriction approximately two-thirds of the way along its 50 Å length (Figure 4). Using SITUS (60), the X-ray crystal structure of a three-repeat designed consensus ankyrin domain (61), PDB ID 1N0Q, was automatically docked into the SAXS envelope. The three ankyrin repeats fit neatly into the larger cylindrical portion of the envelope. Due to the narrowing of the envelope at the end the potential fourth C-terminal repeat cannot be accommodated if structured as a standard ankyrin motif. Secondary structure prediction (JPRED, data not shown) suggests a helix-turn-helix motif for the fourth repeat. The fourth repeat therefore likely forms in a nonstandard orientation or is only partially folded. The remaining six to eight amino acids in BARD1 (423-553), which form the beginning of the 20 amino acid linker to the BRCT domain, may be entirely unstructured. While this paper was in preparation, a crystal structure of the ankyrin repeat region of BARD1 was reported. This structure demonstrates that BARD1 contains four ankyrin repeats, with a slightly truncated fourth repeat (62). The rms difference between all main chain atoms of the homology model and crystal structure is 2.0 Å. This structure was also docked into the GASBOR envelop of the ANK domain (Figure 4C) and gives a satisfactory fit to the experimental data (χ2 values of 4). Additional density is seen in the GASBOR envelop which likely corresponds to the unstructured residues 546-553 present in both the crystallized fragment and the fragment used in the SAXS analysis. SAXS Analysis of the BARD1 Ankyrin-BRCT Domain. To probe the solution structure and interdomain dynamics of the intact BARD1 C-terminal domain, we next carried out
11452
Biochemistry, Vol. 47, No. 44, 2008
Edwards et al.
FIGURE 4: SAXS envelope for the BARD1 ankyrin domain. (A) The DAMAVER reference bead model of BARD1 (423-553) (spheres), a single GASBOR iteration, superimposed on the averaged and filtered envelope (gray mesh) from multiple GASBOR iterations. (B) Three repeat ankyrin domain (PDB ID 1N0Q) docked using SITUS into the GASBOR envelope of BARD1 (423-553). (C) Superposition of the ankyrin homology model (blue) and crystal structure (red) with both docked manually into the BARD1 (423-553) GASBOR envelope (gray semitransparent surface). The rms difference between all main chain atoms of the homology model and crystal structures is 2.0 Å. The fourth repeat of this standard ankyrin domain makes a poor fit to the GASBOR envelope, suggesting the C-terminal fourth repeat of BARD1 (423-553) may be in an atypical conformation in solution. The flexible linker residues 546-553 were not modeled in either the crystal structure or the 3D-jigsaw ankyrin model.
SAXS studies on the intact C-terminal ankyrin-BRCT region of BARD1 (423-777). Guinier plots for data with sRG < 1.3 showed a good fit to linearity, indicating the sample was not aggregated (Figure 2C). Both the scattering curve and the distance distribution function, p(r), exhibited features broadly characteristic of an elongated molecule as described in ref63. The scattering curve is rather featureless and decays slowly. The p(r) function has a maximum at small r, which corresponds approximately to the radius of the cross section, before decreasing linearly to p(r) ) 0 at the maximum dimension of the particle (Dmax) (Figure 2B). Two additional features in the p(r) function are observed: a shoulder at r ∼ 40 Å and tailing-off of the p(r) function at r > 90 Å. The shoulder in the p(r) function suggests the presence of a second, partially distinct, structural domain in the molecule. The observed tailing-off of the p(r) function suggests the possible presence in solution of conformational heterogeneity leading to a broader range of Dmax. However, the Kratky plot was consistent with that of a folded protein, having a bell-shaped curve that does not plateau at higher s-values (Figure 2C, inset). Given that the C-terminal region is a multidomain protein joined by a proteolytically labile linker and that conformational heterogeneity was suggested from analysis of the p(r) function, the solution scattering profile was first tested for interdomain flexibility using the ensemble optimization method (53). An ensemble, optimized against the experimental SAXS curve using a genetic algorithm, was selected from a pool of 10000 randomly generated C-terminal domain conformers. Values of RG and Dmax for the ensemble were compared against those calculated from the pool. In the case where the molecule adopts a limited set of conformations in solution, the ensemble is expected to sample a narrow range of RG and Dmax relative to the values in the pool. However, if the molecule is flexible, sampling a large number of interdomain conformations in solution, the distribution of RG and Dmax values will be correspondingly broad, more comparable to those of the pool (53, 64). The C-terminal domain of BARD1 resembles the later case and thus exhibits conformational heterogeneity in solution via its flexible linker (Figure 5A,B). All models in the optimized ensemble are shown aligned on their BRCT domains in Figure 5C. The
theoretical scattering curve of the ensemble fits that of the experimental scattering curve with a χ2 ) 2.2 (Figure 2A). For comparison, the calculated p(r) function of the most compact model generated by the EOM (RG ) 20.5 Å, Dmax ) 69.4 Å, χ ) 13) has a single peak and no extended tail (Figure 2B). The BARD1 Ankyrin-BRCT Linker Is Critical for Interactions with CstF-50. To probe the functional role of BARD1 C-terminal domain flexibility in interactions with its protein partners, we mapped the regions of BARD1 required for physical interactions with CstF-50. CstF-50 (92-431), lacking the 91 amino acid tail N-terminal to its WD-40 domain, was previously shown to be necessary and sufficient for BARD1 interactions by two-hybrid studies (33). To confirm this interaction, GST-CstF-50 (92-431) and BARD1 (423-777) were purified separately from E. coli and used in GST pull-down assays (Figure 6A). BARD1 (423-777) bound to GST-CstF-50 (92-431), but not to GST alone, revealing a specific interaction between the two proteins. To map the region of BARD1 required for interaction with CstF50, we compared binding of CstF-50 to the isolated ankyrin domain (BARD1 (423-553)), the linker-BRCT construct (BARD1 (554-777)), the BRCT repeat alone (BARD1 (569-777)), and the ankyrin-linker-BRCT construct (BARD1 (423-777)). The isolated BRCT repeat exhibited weak CstF50 binding, and the ankyrin domain in isolation did not bind to CstF-50, suggesting these regions make minimal contributions to high-affinity CstF-50 interactions (Figure 6C). In contrast, the ANK-linker-BRCT and linker-BRCT displayed robust CstF-50 binding (Figure 6A,B), implicating the flexible ankyrin-BRCT linker as the core CstF-50 interaction region. DISCUSSION Functionally important conformational flexibility in the interactions with multiple protein partners has recently been characterized as critical in proteins that act as hubs for the integration of information for DNA repair and DNA replication pathways (65, 66). Here we find that BARD1, which acts in the control of the cell cycle in response to DNA damage (1, 2), unexpectedly employs a flexible linker region
BARD1 ANK-BRCT Domain Structure and Binding to CstF-50
FIGURE 5: BARD1 ankyrin-BRCT fragment samples a broad range of conformations in solution. Frequency of occurrence of RG (A) and Dmax (B) values for the optimized ensemble (empty boxes) compared to those of the pool of 10000 randomly generated conformations (filled boxes). The optimized ensemble, representing the BARD1 C-terminal domain in solution, samples a broad range of both RG and Dmax, comparable to those of the pool. The C-terminal domain of BARD1 is therefore described as conformationally flexible in solution. The RG and Dmax ranges are however both systematically shorter than for those in the pool. This may be due to a partially folded rather than completely flexible linker. (C) The conformational flexibility of the BARD1 C-terminal domain in solution is shown by the optimized ensemble that best represents the experimental SAXS curve. The 19 models within the ensemble were aligned on their BRCT domains. The BRCT repeat is shown in red, the flexible linker is in blue, and ankyrin domains are in gray.
for functionally important interactions, suggesting how BARD1ʼs structure may facilitate its ability to act as a hub for multiple partners and thereby provide a means to integrate information for control of transcription and RNAP II in response to DNA damage. Our biochemical, crystallographic, and small angle X-ray scattering data characterize the structural biochemistry for BARD1 interactions with CstF-50. The combined results indicate that the C-terminal region of BARD1 consists of a
Biochemistry, Vol. 47, No. 44, 2008 11453
FIGURE 6: The BARD1 ankyrin-BRCT linker is critical for interactions with CstF-50. (A) Interaction of GST-CstF50 (92-431) and BARD1 (423-777). The BARD1 construct containing both ankyrin repeats and BRCT repeats was incubated with purified GST or GST-CstF50 (92-431). Bound proteins were eluted and resolved by SDS-PAGE. Five percent of the GST-CstF50 (92-431) used in binding reactions is shown. (B) Requirement of the BARD1 linker for CstF-50 interaction. BARD1-BRCT derivatives with or without the BARD1 linker were used in binding reactions with GST-CstF50 (92-431). Five percent of each of the GST-CstF50 (92-431) used in binding reactions is shown. (C) Lack of interaction between BARD1-ankyrin and GST-CstF50 (92-431). BARD1-ankyrin was incubated with purified GST or GST-CstF50 (92-431). Five percent of the BARD1-ankyrin used in binding reactions is shown.
two-domain structure connected by a flexible peptide linker. SAXS data show that the solution structure is most consistent with an ensemble of ankyrin-BRCT models suggesting that the two domains sample a wide range of orientations with respect to one another (Figure 5C), reminiscent of those seen for mismatch repair interactions (66). In addition, a recent NMR spectroscopic study failed to uncover any interactions between the BARD1 ankyrin and BRCT domains (62). Thus, the protein interaction surfaces on the ankyrin and BRCT domains are not prealigned to form a contiguous recognition surface as might be expected but instead provide a means to alter BARD1 architecture depending upon its partner interactions with the linker region. CstF-50 is the best characterized binding partner for the BARD1 C-terminal region. Our pull-down data demonstrate that specific interactions between the CstF-50 WD-40 domain and BARD1 critically depend on the BARD1 interdomain
11454
Biochemistry, Vol. 47, No. 44, 2008
linker (Figure 6). Structural studies of WD-40-containing protein complexes indicate that proteins of this family interact with protein partners at the depression formed at the center of the WD-40 β-propeller structure. These interactions can then form an anchor for assembly of larger protein complexes. Such interactions were first structurally characterized for heterotrimeric G-proteins where the β-subunit is a WD40 protein (67, 68). Interestingly, interactions between CstF50 and the BARD1 linker could rigidify and thereby control architectural placement of the BARD1 C-terminal region, thereby reducing the relative flexibility of the ankyrin and BRCT domains and facilitating interactions with other factors, as seen for the Rad51 polymerization domain interaction with BRCA2 (69). CstF-50 is implicated in the direct recognition of the C-terminal domain (CTD) of RNA polymerase II, potentially providing a critical interaction to recruit the CstF complex to the transcribing RNA polymerase holoenzyme (33, 70, 71). This interaction does not require the WD-40 domain of CstF50 but relies on an N-terminal region that we have shown is not required for interactions with BARD1 (70). Significantly, since the minimal binding regions do not overlap, the RNAP II CTD, CstF-50, and the BARD1 C-terminal domains could potentially all interact within the elongating transcriptional complex. The proximity of the BARD1 BRCT to the CTD would allow for additional interactions between the phosphorylated CTD and the BARD1 BRCT. Since the BARD1 BRCT preferentially binds phosphopeptides with negatively charged side chains at the +2 and +3 positions in Vitro (23), CTD binding by the BARD1 BRCT might be facilitated by phosphorylation at both the position 2 and 5 serines of the CTD. Besides interactions with CstF-50, the BARD1 C-terminal region is implicated in interactions with p53. These interactions lead to the phosphorylation and stabilization of p53 and are furthermore implicated in facilitating apoptosis in response to DNA damage (72-74). The ankyrin repeats, linker, and a portion of the N-terminal BRCT repeat contain the minimal region of BARD1 required for p53 interactions (73). The Q564H BARD1 mutation attenuates BARD1dependent induction of apoptosis, p53 stabilization, and interactions with p53, suggesting that the BARD1 linker region is critical for a functional interaction of BARD1 with p53 (74). Thus, the C-terminal region of BARD1 can interact with diverse partner proteins to regulate different aspects of the DNA damage response. Such proteins that act as hubs in integrating DNA repair responses are potential master keys to understanding and eventual therapeutic interventions for cancer, highlighting the value of understanding the detailed structural biochemistry underlying pathway control by multiple structural interactions (75). For BARD1, the structural plasticity of this region, imparted by the ANK-BRCT linker, is likely key to the regulated assembly of different protein complexes with distinct functions in DNA damage signaling. ACKNOWLEDGMENT We thank Stephen Campbell for assistance with FP, Bob Parker and Alberta Peptide Institute for peptide synthesis, the AICT (Academic Information and Communication Technologies) of the University of Alberta for access to their
Edwards et al. LINUX cluster, the staff at the ALS beamline 8.3.1 for assistance with crystallographic data collection, the staff at SIBYLS beamline for assistance with SAXS data collection. SUPPORTING INFORMATION AVAILABLE MALLS data showing that BARD1(423-777) is monomeric (Figure S1). This material is available free of charge via the Internet at http://pubs.acs.org. REFERENCES 1. Scully, R., Xie, A., and Nagaraju, G. (2004) Molecular functions of BRCA1 in the DNA damage response. Cancer Biol. Ther. 3, 521–527. 2. Irminger-Finger, I., and Leung, W. C. (2002) BRCA1-dependent and independent functions of BARD1. Int. J. Biochem. Cell Biol. 34, 582–587. 3. Wu, L. C., Wang, Z. W., Tsan, J. T., Spillman, M. A., Phung, A., Xu, X. L., Yang, M. C., Hwang, L. Y., Bowcock, A. M., and Baer, R. (1996) Identification of a RING protein that can interact in vivo with the BRCA1 gene product. Nat. Genet. 14, 430–440. 4. Brzovic, P. S., Keeffe, J. R., Nishikawa, H., Miyamoto, K., Fox, D., III, Fukuda, M., Ohta, T., and Klevit, R. (2003) Binding and recognition in the assembly of an active BRCA1/BARD1 ubiquitinligase complex. Proc. Natl. Acad. Sci. U.S.A. 100, 5646–5651. 5. Brzovic, P. S., Rajagopal, P., Hoyt, D. W., King, M. C., and Klevit, R. E. (2001) Structure of a BRCA1-BARD1 heterodimeric RINGRING complex. Nat. Struct. Biol. 8, 833–837. 6. Bork, P., Hofmann, K., Bucher, P., Neuwald, A. F., Altschul, S. F., and Koonin, E. V. (1997) A superfamily of conserved domains in DNA damage-responsive cell cycle checkpoint proteins. FASEB J. 11, 68–76. 7. Callebaut, I., and Mornon, J. P. (1997) From BRCA1 to RAP1: a widespread BRCT module closely associated with DNA repair. FEBS Lett. 400, 25–30. 8. Glover, J. N., Williams, R. S., and Lee, M. S. (2004) Interactions between BRCT repeats and phosphoproteins: tangled up in two. Trends Biochem. Sci. 29, 579–585. 9. Cantor, S. B., Bell, D. W., Ganesan, S., Kass, E. M., Drapkin, R., Grossman, S., Wahrer, D. C., Sgroi, D. C., Lane, W. S., Haber, D. A., and Livingston, D. M. (2001) BACH1, a novel helicaselike protein, interacts directly with BRCA1 and contributes to its DNA repair function. Cell 105, 149–160. 10. Yu, X., Wu, L. C., Bowcock, A. M., Aronheim, A., and Baer, R. (1998) The C-terminal (BRCT) domains of BRCA1 interact in vivo with CtIP, a protein implicated in the CtBP pathway of transcriptional repression. J. Biol. Chem. 273, 25388–25392. 11. Li, S., Chen, P. L., Subramanian, T., Chinnadurai, G., Tomlinson, G., Osborne, C. K., Sharp, Z. D., and Lee, W. H. (1999) Binding of CtIP to the BRCT repeats of BRCA1 involved in the transcription regulation of p21 is disrupted upon DNA damage. J. Biol. Chem. 274, 11334–11338. 12. Kim, H., Huang, J., and Chen, J. (2007) CCDC98 is a BRCA1BRCT domain-binding protein involved in the DNA damage response. Nat. Struct. Mol. Biol. 14, 710–715. 13. Liu, Z., Wu, J., and Yu, X. (2007) CCDC98 targets BRCA1 to DNA damage sites. Nat. Struct. Mol. Biol. 14, 716–720. 14. Manke, I. A., Lowery, D. M., Nguyen, A., and Yaffe, M. B. (2003) BRCT repeats as phosphopeptide-binding modules involved in protein targeting. Science 302, 636–639. 15. Yu, X., Chini, C. C., He, M., Mer, G., and Chen, J. (2003) The BRCT domain is a phospho-protein binding domain. Science 302, 639–642. 16. Williams, R. S., Lee, M. S., Hau, D. D., and Glover, J. N. (2004) Structural basis of phosphopeptide recognition by the BRCT domain of BRCA1. Nat. Struct. Mol. Biol. 11, 519–525. 17. Clapperton, J. A., Manke, I. A., Lowery, D. M., Ho, T., Haire, L. F., Yaffe, M. B., and Smerdon, S. J. (2004) Structure and mechanism of BRCA1 BRCT domain recognition of phosphorylated BACH1 with implications for cancer. Nat. Struct. Mol. Biol. 11, 512–518. 18. Shiozaki, E. N., Gu, L., Yan, N., and Shi, Y. (2004) Structure of the BRCT repeats of BRCA1 bound to a BACH1 phosphopeptide: implications for signaling. Mol. Cell 14, 405–412.
BARD1 ANK-BRCT Domain Structure and Binding to CstF-50 19. Varma, A. K., Brown, R. S., Birrane, G., and Ladias, J. A. (2005) Structural basis for cell cycle checkpoint control by the BRCA1CtIP complex. Biochemistry 44, 10941–10946. 20. Lee, M. S., Edwards, R. A., Thede, G. L., and Glover, J. N. (2005) Structure of the BRCT repeat domain of MDC1 and its specificity for the free COOH-terminal end of the gamma-H2AX histone tail. J. Biol. Chem. 280, 32053–32056. 21. Williams, R. S., and Glover, J. N. (2003) Structural consequences of a cancer-causing BRCA1-BRCT missense mutation. J. Biol. Chem. 278, 2630–2635. 22. Tischkowitz, M., Hamel, N., Carvalho, M. A., Birrane, G., Soni, A., van.Beers, E. H., Joosse, S. A., Wong, N., Novak, D., Quenneville, L. A., Grist, S. A., Nederlof, P. M., Goldgar, D. E., Tavtigian, S. V., Monteiro, A. N., Ladias, J. A. and, and Foulkes, W. D. (2008) Pathogenicity of the BRCA1 missense variant M1775K is determined by the disruption of the BRCT phosphopeptide-binding pocket: a multi-modal approach. Eur. J. Hum. Genet. (in press). 23. Rodriguez, M., Yu, X., Chen, J., and Songyang, Z. (2003) Phosphopeptide binding specificities of BRCA1 COOH-terminal (BRCT) domains. J. Biol. Chem. 278, 52914–52918. 24. Kim, H., Chen, J., and Yu, X. (2007) Ubiquitin-binding protein RAP80 mediates BRCA1-dependent DNA damage response. Science 316, 1202–1205. 25. Sedgwick, S. G., and Smerdon, S. J. (1999) The ankyrin repeat: a diversity of interactions on a common structural framework. Trends Biochem. Sci. 24, 311–316. 26. Mosavi, L. K., Cammett, T. J., Desrosiers, D. C., and Peng, Z. Y. (2004) The ankyrin repeat as molecular architecture for protein recognition. Protein Sci. 13, 1435–1448. 27. Laufer, M., Nandula, S. V., Modi, A. P., Wang, S., Jasin, M., Murty, V. V., Ludwig, T., and Baer, R. (2007) Structural requirements for the BARD1 tumor suppressor in chromosomal stability and homology-directed DNA repair. J. Biol. Chem. 282, 34325–34333. 28. Thai, T. H., Du, F., Tsan, J. T., Jin, Y., Phung, A., Spillman, M. A., Massa, H. F., Muller, C. Y., Ashfaq, R., Mathis, J. M., Miller, D. S., Trask, B. J., Baer, R., and Bowcock, A. M. (1998) Mutations in the BRCA1-associated RING domain (BARD1) gene in primary breast, ovarian and uterine cancers. Hum. Mol. Genet. 7, 195–202. 29. Ghimenti, C., Sensi, E., Presciuttini, S., Brunetti, I. M., Conte, P., Bevilacqua, G., and Caligo, M. A. (2002) Germline mutations of the BRCA1-associated ring domain (BARD1) gene in breast and breast/ovarian families negative for BRCA1 and BRCA2 alterations. Genes Chromosomes Cancer 33, 235–242. 30. Sauer, M. K., and Andrulis, I. L. (2005) Identification and characterization of missense alterations in the BRCA1 associated RING domain (BARD1) gene in breast and ovarian cancer. J. Med. Genet. 42, 633–638. 31. Kleiman, F. E., Wu-Baer, F., Fonseca, D., Kaneko, S., Baer, R., and Manley, J. L. (2005) BRCA1/BARD1 inhibition of mRNA 3′ processing involves targeted degradation of RNA polymerase II. Genes DeV. 19, 1227–1237. 32. Kleiman, F. E., and Manley, J. L. (2001) The BARD1-CstF-50 interaction links mRNA 3′ end formation to DNA damage and tumor suppression. Cell 104, 743–753. 33. Kleiman, F. E., and Manley, J. L. (1999) Functional interaction of BRCA1-associated BARD1 with polyadenylation factor CstF-50. Science 285, 1576–1579. 34. Mirkin, N., Fonseca, D., Mohammed, S., Cevher, M. A., Manley, J. L., and Kleiman, F. E. (2008) The 3′ processing factor CstF functions in the DNA repair response. Nucleic Acids Res. (in press). 35. Takagaki, Y., and Manley, J. L. (2000) Complex protein interactions within the human polyadenylation machinery identify a novel component. Mol. Cell. Biol. 20, 1515–1525. 36. Vagin, A., and Teplyakov, A. (1997) MOLREP: an automated program for molecular replacement. J. Appl. Crystallogr. 30, 1022– 1025. 37. Murshudov, G. N., Vagin, A. A., and Dodson, E. J. (1997) Refinement of macromolecular structures by the maximumlikelihood method. Acta Crystallogr., Sect. D: Biol. Crystallogr. 53, 240–255. 38. Winn, M., Isupov, M., and Murchudov, G. N. (2001) Use of TLS parameters to model anisotropic displacements in macromolecular refinement. Acta Crystallogr., Sect. D: Biol. Crystallogr. 57, 122– 133. 39. Brunger, A. T., Adams, P. D., Clore, G. M., DeLano, W. L., Gros, P., Grosse.Kunstleve, R. W., Jiang, J. S., Kuszewski, J., Nilges, M., Pannu, N. S., Read, R. J., Rice, L. M., Simonson, T., and
Biochemistry, Vol. 47, No. 44, 2008 11455
40. 41.
42.
43.
44. 45. 46. 47. 48. 49. 50.
51. 52. 53.
54. 55. 56.
57.
58. 59.
60. 61. 62.
Warren, G. L. (1998) Crystallography & NMR system: A new software suite for macromolecular structure determination. Acta Crystallogr., Sect. D: Biol. Crystallogr. 54, 905–921. Emsley, P., and Cowtan, K. (2004) Coot: model-building tools for molecular graphics. Acta Crystallogr., Sect. D: Biol. Crystallogr. 60, 2126–2132. Putnam, C. D., Hammel, M., Hura, G. L., and Tainer, J. A. (2007) X-ray solution scattering (SAXS) combined with crystallography and computation: defining accurate macromolecular structures, conformations and assemblies in solution. Q. ReV. Biophys. 40, 191–285. Tsutakawa, S. E., Hura, G. L., Frankel, K. A., Cooper, P. K., and Tainer, J. A. (2007) Structural analysis of flexible proteins in solution by small angle X-ray scattering combined with crystallography. J. Struct. Biol. 158, 214–223. Konarev, P. V., Volkov, V. V., Sokolova, A. V., Koch, M. H. J., and Svergun, D. I. (2003) PRIMUS: a Windows PC-based system for small-angle scattering data analysis. J. Appl. Crystallogr. 36, 1277–1282. Svergun, D. I. (1992) Determination of the regularization parameter in indirect-transform methods using perceptual criteria. J. Appl. Crystallogr. 25, 495–503. Kikhney, A. G., Konarev, P. V., and Svergun, D. I. Svergun, D. I. (1999) Restoring low resolution structure of biological macromolecules from solution scattering using simulated annealing. Biophys. J. 76, 2879–2886. Svergun, D. I., Petoukhov, M. V., and Koch, M. H. (2001) Determination of domain structure of proteins from X-ray solution scattering. Biophys. J. 80, 2946–2953. Kozin, M. B., and Svergun, D. I. (2001) Automated matching of high- and low-resolution structural models. J. Appl. Crystallogr. 34, 33–41. Volkov, V. V., and Svergun, D. I. (2003) Uniqueness of ab initio shape determination in small-angle scattering. J. Appl. Crystallogr. 36, 860–864. Bates, P. A., Kelley, L. A., MacCallum, R. M., and Sternberg, M. J. (2001) Enhancement of protein modeling by human intervention in applying the automatic programs 3D-JIGSAW and 3DPSSM. Proteins Suppl. 5, 39–46. Bates, P. A., and Sternberg, M. J. (1999) Model building by comparison at CASP3: using expert knowledge and computer automation. Proteins Suppl. 3, 47–54. Contreras-Moreira, B., and Bates, P. A. (2002) Domain fishing: a first step in protein comparative modelling. Bioinformatics 18, 1141–1142. Bernado, P., Mylonas, E., Petoukhov, M. V., Blackledge, M., and Svergun, D. I. (2007) Structural characterization of flexible proteins using small-angle X-ray scattering. J. Am. Chem. Soc. 129, 5656– 5664. Williams, R. S., Green, R., and Glover, J. N. (2001) Crystal structure of the BRCT repeat region from the breast cancerassociated protein BRCA1. Nat. Struct. Biol. 8, 838–842. Birrane, G., Varma, A. K., Soni, A., and Ladias, J. A. (2007) Crystal structure of the BARD1 BRCT domains. Biochemistry 46, 7706– 7712. Stucki, M., Clapperton, J. A., Mohammad, D., Yaffe, M. B., Smerdon, S. J., and Jackson, S. P. (2005) MDC1 directly binds phosphorylated histone H2AX to regulate cellular responses to DNA double-strand breaks. Cell 123, 1213–1226. Kim, H. S., Li, H., Cevher, M., Parmelee, A., Fonseca, D., Kleiman, F. E., and Lee, S. B. (2006) DNA damage-induced BARD1 phosphorylation is critical for the inhibition of messenger RNA processing by BRCA1/BARD1 complex. Cancer Res. 66, 4561– 4565. Porod, G. (1982) Small Angle X-Ray Scattering, Academic, London. Pollack, L., Tate, M. W., Darnton, N. C., Knight, J. B., Gruner, S. M., Eaton, W. A., and Austin, R. H. (1999) Compactness of the denatured state of a fast-folding protein measured by submillisecond small-angle x-ray scattering. Proc. Natl. Acad. Sci. U.S.A. 96, 10115–10117. Wriggers, W., and Chaon, P. (2001) Using Situs for the registration of protein structures with low-resolution bead models from X-ray solution scattering. J. Appl. Crystallogr. 34, 773–776. Mosavi, L. K., Minor, D. L., Jr., and Peng, Z. Y. (2002) Consensusderived structural determinants of the ankyrin repeat motif. Proc. Natl. Acad. Sci. U.S.A. 99, 16029–16034. Fox, D., Le Trong, I., Rajagopal, P., Brzovic, P. S., Stenkamp, R. E., and Klevit, R. E. (2008) Crystal structure of the BARD1
11456
63. 64.
65.
66. 67. 68.
69.
Biochemistry, Vol. 47, No. 44, 2008
ankyrin repeat domain and its functional consequences. J. Biol. Chem. (in press). Svergun, D. I., and Koch, M. H. J. (2003) Small-angle scattering studies of biological macromolecules in solution. Bernado, P., Perez, Y., Svergun, D. I., and Pons, M. (2008) Structural characterization of the active and inactive states of Src kinase in solution by small-angle X-ray scattering. J. Mol. Biol. 376, 492–505. Pascal, J. M., Tsodikov, O. V., Hura, G. L., Song, W., Cotner, E. A., Classen, S., Tomkinson, A. E., Tainer, J. A., and Ellenberger, T. (2006) A flexible interface between DNA ligase and PCNA supports conformational switching and efficient ligation of DNA. Mol. Cell 24, 279–291. Shell, S. S., Putnam, C. D., and Kolodner, R. D. (2007) The N terminus of Saccharomyces cerevisiae Msh6 is an unstructured tether to PCNA. Mol. Cell 26, 565–578. Gaudet, R., Bohm, A., and Sigler, P. B. (1996) Crystal structure at 2.4 angstroms resolution of the complex of transducin betagamma and its regulator, phosducin. Cell 87, 577–588. Wall, M. A., Coleman, D. E., Lee, E., Iniguez-Lluhi, J. A., Posner, B. A., Gilman, A. G., and Sprang, S. R. (1995) The structure of the G protein heterotrimer Gi alpha 1 beta 1 gamma 2. Cell 83, 1047–1058. Shin, D. S., Pellegrini, L., Daniels, D. S., Yelent, B., Craig, L., Bates, D., Yu, D. S., Shivji, M. K., Hitomi, C., Arvai, A. S., Volkmann, N., Tsuruta, H., Blundell, T. L., Venkitaraman, A. R., and Tainer, J. A. (2003) Full-length archaeal Rad51 structure and mutants: mechanisms for RAD51 assembly and control by BRCA2. EMBO J. 22, 4566–4576.
Edwards et al. 70. Fong, N., and Bentley, D. L. (2001) Capping, splicing, and 3′ processing are independently stimulated by RNA polymerase II: different functions for different segments of the CTD. Genes DeV. 15, 1783–1795. 71. McCracken, S., Fong, N., Yankulov, K., Ballantyne, S., Pan, G., Greenblatt, J., Patterson, S. D., Wickens, M., and Bentley, D. L. (1997) The C-terminal domain of RNA polymerase II couples mRNA processing to transcription. Nature 385, 357–361. 72. Fabbro, M., Savage, K., Hobson, K., Deans, A. J., Powell, S. N., McArthur, G. A., and Khanna, K. K. (2004) BRCA1-BARD1 complexes are required for p53Ser-15 phosphorylation and a G1/S arrest following ionizing radiation-induced DNA damage. J. Biol. Chem. 279, 31251–31258. 73. Feki, A., Jefford, C. E., Berardi, P., Wu, J. Y., Cartier, L., Krause, K. H., and Irminger-Finger, I. (2005) BARD1 induces apoptosis by catalysing phosphorylation of p53 by DNA-damage response kinase. Oncogene 24, 3726–3736. 74. Irminger-Finger, I., Leung, W. C., Li, J., Dubois-Dauphin, M., Harb, J., Feki, A., Jefford, C. E., Soriano, J. V., Jaconi, M., Montesano, R., and Krause, K. H. (2001) Identification of BARD1 as mediator between proapoptotic stress and p53-dependent apoptosis. Mol. Cell 8, 1255–1266. 75. Perry, J. J., Fan, L., and Tainer, J. A. (2007) Developing master keys to brain pathology, cancer and aging from the structural biology of proteins controlling reactive oxygen species and DNA repair. Neuroscience 145, 1280–1299. BI801115G