ARTHRITIS & RHEUMATOLOGY Vol. 66, No. 12, December 2014, pp 3463–3475 DOI 10.1002/art.38875 © 2014 The Authors. Arthritis & Rheumatology is published by Wiley Periodicals, Inc. on behalf of the American College of Rheumatology. This is an open access article under the terms of the Creative Commons Attribution-NonCommercial-NoDerivs License, which permits use and distribution in any medium, provided the original work is properly cited, the use is non-commercial and no modifications or adaptations are made.
The Biologic Basis of Clinical Heterogeneity in Juvenile Idiopathic Arthritis Simon W. M. Eng,1 Trang T. Duong,2 Alan M. Rosenberg,3 Quaid Morris,4 and Rae S. M. Yeung1 on behalf of the REACCH OUT and BBOP Research Consortia Objective. Childhood arthritis encompasses a heterogeneous family of diseases. Significant variation in clinical presentation remains despite consensusdriven diagnostic classifications. Developments in data analysis provide powerful tools for interrogating large heterogeneous data sets. We report a novel approach to integrating biologic and clinical data toward a new classification for childhood arthritis, using computational biology for data-driven pattern recognition. Methods. Probabilistic principal components analysis was used to transform a large set of data into 4 interpretable indicators or composite variables on which patients were grouped by cluster analysis. Sensitivity analysis was conducted to determine key variables in determining indicators and cluster assignment. Results were validated against an independent validation cohort. Results. Meaningful biologic and clinical charac-
teristics, including levels of proinflammatory cytokines and measures of disease activity, defined axes/ indicators that identified homogeneous patient subgroups by cluster analysis. The new patient classifications resolved major differences between patient subpopulations better than International League of Associations for Rheumatology subtypes. Fourteen variables were identified by sensitivity analysis to crucially determine indicators and clusters. This new schema was conserved in an independent validation cohort. Conclusion. Data-driven unsupervised machine learning is a powerful approach for interrogating clinical and biologic data toward disease classification, providing insight into the biology underlying clinical heterogeneity in childhood arthritis. Our analytical framework enabled the recovery of unique patterns from small cohorts and addresses a major challenge, patient numbers, in studying rare diseases.
Supported by the Canadian Institutes of Health Research (CIHR) and The Arthritis Society (CIHR team grants 82517 and QNT-69301), the Canadian Arthritis Network (team grant SRI-IJD01), and the Natural Science and Engineering Research Council (operating grant to Dr. Morris). Additional funding was provided by the University of Saskatchewan, the Manitoba Institute of Child Health, McGill University, Memorial University, the University of British Columbia, and the University of Sherbrooke. Dr. Yeung holds the Hak-Ming and Deborah Chiu Chair in Paediatric Translational Research at The Hospital for Sick Children, University of Toronto, Toronto, Ontario, Canada. 1 Simon W. M. Eng, BSc, Rae S. M. Yeung, MD, PhD, FRCPC: The Hospital for Sick Children and University of Toronto, Toronto, Ontario, Canada; 2Trang T. Duong, PhD: The Hospital for Sick Children, Toronto, Ontario, Canada; 3Alan M. Rosenberg, MD: University of Saskatchewan, Saskatoon, Saskatchewan, Canada; 4 Quaid Morris, PhD: University of Toronto, Toronto, Ontario, Canada. Address correspondence to Rae S. M. Yeung, MD, PhD, FRCPC, The Hospital for Sick Children, Department of Paediatrics, 555 University Avenue, Toronto, Ontario M5G 1X8, Canada. E-mail:
[email protected]. Submitted for publication February 6, 2014; accepted in revised form September 4, 2014.
Childhood arthritis (juvenile idiopathic arthritis [JIA]) comprises a heterogeneous group of diseases, all manifesting joint inflammation but with distinct clinical manifestations, disease course, and outcomes. The International League of Associations for Rheumatology (ILAR) diagnostic criteria were formulated by expert consensus and classify children with chronic arthritis based on the number of affected joints and extraarticular manifestations during the first 6 months of disease (1). These clinical subtypes—systemic arthritis, oligoarthritis, rheumatoid factor (RF)–negative polyarthritis, RFpositive polyarthritis, psoriatic arthritis, enthesitisrelated arthritis (ERA), and undifferentiated arthritis— mark an important first step toward a unified, internationally accepted classification system for chronic childhood arthritis, yet substantial patient heterogeneity remains (2). Recent work has provided insight into immuno3463
3464
ENG ET AL
biologic differences among patients (3) by identifying biomarkers of susceptibility and outcome based on patient genotypes (4–7), gene expression (8–13), protein expression (14–21), and cellular phenotypes (22). Meta-analyses have identified associations with singlenucleotide polymorphisms in genes regulating immune responses (23, 24). Gene expression profiling has identified unique immune activation signatures associated with the different subtypes and responses to therapy (12,13,18,25). Distinguishing features of immune activation are also seen at the cellular level, with unique T cell surface molecule expression patterns predicting the disease course in oligoarthritis (22). Pattern recognition is the basis of clinical medicine. Emerging developments in data acquisition, management, and analysis provide avenues for data-driven pattern recognition toward disease classifications that integrate information from diverse sources. The size and heterogeneity of these data sets pose analytical challenges that arise from mixtures of types of measurements. Advances in high-throughput data analysis have substantially affected the quality and accuracy of clinical conclusions derived from biologic data. Integrating biologic patterns will enable a rationally conceived, evidenced-based approach to disease classification that considers both clinical and biologic characteristics (26). In this study, we sought to establish a conceptual framework for a biologically based disease classification system. Machine learning methods developed for pattern recognition were applied to a defined set of demographic, clinical, laboratory, and cytokine expression data in an inception cohort of treatment-naive children with new-onset arthritis. The aims of this study were to establish an analytical framework, generate indicators that describe significant differences across patients, recover homogeneous patient subgroups based on these indicators, and validate findings in an independent cohort. PATIENTS AND METHODS Study design. The discovery and validation phases included 157 and 102 consecutive patients with new-onset JIA enrolled in the REsearch in Arthritis in Canadian CHildren, Emphasizing OUTcomes (REACCH OUT) and Biologically Based Outcome Predictors in JIA (BBOP) studies, respectively. The same set of clinical data, biologic samples, and assays were collected for both independent studies, except that the BBOP study did not measure fractalkine expression. Appendix A lists members of the REACCH OUT and BBOP consortia who contributed to detailed patient data acquisition and biologic specimen collection. Children were included in these studies if they satisfied the ILAR classification criteria (1,27), were within 6 months of disease onset, and had not
received medications other than nonsteroidal antiinflammatory drugs. Informed consent for participation was obtained from parents, and informed consent or assent was obtained from patients, as appropriate. Clinical and laboratory data. Detailed demographic, clinical, and laboratory data were captured at enrollment and at 6 months (see Supplementary Table 1, available on the Arthritis & Rheumatology web site at http://onlinelibrary. wiley.com/doi/10.1002/art.38875/abstract). Clinical data were collected prospectively using standardized clinical reporting forms, which captured all key features in the ILAR classification criteria and components of the American College of Rheumatology pediatric core set of measures of disease activity (27), including standard laboratory markers and questionnaire-based assessments of function, global disease activity, and quality of life. Biologic sample collection and cytokine assays. Peripheral blood samples were collected and processed according to a standardized protocol at each study visit and were transported to the central biobank (The Hospital for Sick Children). Serum samples were stored at ⫺80°C in 200 l aliquots outside of transport. Cytokine and chemokine concentrations were measured using multiplex protein detection kits according to the manufacturer’s specifications (Millipore) and analyzed on a Luminex100 LabMAP system at the University Health Network Microarray Centre in Toronto (www.microarrays.ca). Hardware and software. We used Python software, version 2.7 (www.python.org) and R statistical software, version 2.15 (www.r-project.org) on a Mac OS X, version 10.7, operating system (Apple Computers), as well as the High Performance Facility at The Hospital for Sick Children running Linux, version 2.6.32. Data preprocessing. Protein concentrations were logtransformed. For each variable, outliers were removed by replacing measurements more than 3 times the interquartile range above the 75th percentile (or below the 25th percentile) with a missing value; these constituted 0.4% of all data. Variables were then Z score–transformed. Cross-validated dimensionality reduction. After data preprocessing, 5.8% of data were missing. Missing values and principal components (PCs) were inferred using probabilistic principal components analysis (PPCA) from pcaMethods, version 1.42.0 (28). Each PC is represented by a series of weights (loadings), one for each variable. A “PC score” for a patient is a composite indicator equal to the sum of the element-wise product of the patient variables and the PC loadings. PPCA selects PCs corresponding to the indicators that capture the most variation among patients. The number of PCs was selected using mean Q2 across 100⫻ 3-fold cross-validation. Q2 is the correlation between PC-based reconstructions and data values on the third of the data not used to calculate PCs in each iteration of cross-validation (28). We selected the largest number of PCs whose Q2 was not significantly smaller than the maximum Q2 (unpaired 2-tailed t-tests, ␣ ⫽ 0.05, Bonferroni corrected). To reduce noise on each PC from insignificantly contributing variables, we “desensitized” each PC by setting to zero any loading whose sign was sensitive to the removal of single patients within the data set—whose 95% confidence interval across leave-one-out (LOO) cross-validation spanned zero (29). PC vectors were then normalized by rescaling them
BIOLOGIC BASIS OF CLINICAL HETEROGENEITY IN JIA
such that the square root of the sum of the squared loadings was 1. Standardized patient data were projected onto these desensitized, normalized PCs to compute PC score vectors for patients. Gaussian mixture model clustering. We fit Gaussian mixture models (GMMs) to scores using mclust, version 4.0 (30), which models high-density regions of patients along the PCs as clusters. We used the mclust option {G ⫽ 1:10} to select cluster number and constraints on the covariance matrix using the Bayesian information criterion (BIC). Comparisons of new patient clusters and ILAR subtypes. We used Circos, version 0.60 (31) to visualize relationships between clusters and ILAR subtypes. We performed Kruskal-Wallis tests to detect differences in distribution among the clusters and ILAR subtypes for each PC and variable. We determined pairs of clusters and pairs of ILAR subtypes that differed significantly in distribution (P ⬍ 0.05) by MannWhitney tests, using Bonferroni correction. We also computed the percent variance explained for each variable by both the clusters and ILAR subtypes using linear models, which predicted values of held-back variables given cluster and ILAR subtype assignments. This percent is the squared Pearson correlation between the original and predicted values. Sensitivity analysis. To assess the robustness and generalization of the patient clusters, sensitivity analysis was conducted by rerunning PPCA and cluster analysis as described above, withholding data from one variable at a time. Four PCs, 5 clusters, and the same constraints on the covariance matrices during clustering were used again, generating “LOO groupings.” For each variable, sensitivity analysis was conducted with 100 different initial seeds for random number generation and was confirmed by rerunning with 100 different seeds. For each variable, we matched LOO clusters to original clusters by a greedy algorithm that, at each step, matched clusters with the largest proportion of patient overlap (the number of shared patients divided by the combined number of patients). We also computed the coclustering probability P(C,C⬘), the proportion of patients that cluster together in the original clusterings (C) that also cluster together in the LOO cluster (C⬘). We also calculated the percent variance of the held-back variables explained by the original and LOO clusters as above. Validation in an independent cohort. We assessed the generalizability of the PCs and clusters using the independent BBOP cohort. We substituted zero for missing fractalkine values after log transformation. Patient profiles were then processed as above and projected onto discovery PCs to recover scores; patients were then assigned to the most likely discovery cluster. We performed de novo GMM clustering on the scores as described above and computed coclustering probabilities with the discovery phase clusters. We also computed PCs on the validation data, reclustered the patients, computed coclustering probabilities with the previous 2 clusterings, and compared the new clusters and ILAR subtypes using the same metrics described above for the discovery cohort. Disease trajectories. To determine whether the clusters predicted disease activity, 6-month data were Z score– transformed using the same parameters as at baseline and subsequently projected onto PC 2 (see below) to compute
3465
6-month PC 2 scores. Significance of changes from baseline was computed using paired 2-tailed t-tests.
RESULTS Patient demographics and diagnoses. Two independent cohorts of children with new-onset JIA (see Supplementary Table 2, available on the Arthritis & Rheumatology web site at http://onlinelibrary.wiley.com/ doi/10.1002/art.38875/abstract) were used for discovery and validation purposes. No treatment-naive patients with systemic arthritis fulfilled the strict study inclusion criteria, and therefore, treatment-naive patients were not represented in this study. The distributions of ILAR subtypes in the 2 cohorts were similar; however, ERA and psoriatic arthritis were underrepresented in the validation cohort. Four indicators produced by PPCA. The discovery data set contained missing data (5.4%). We evaluated several algorithms that perform PCA with missing data. PPCA minimized reconstruction error by maximizing Q2 and therefore most accurately described patients as a whole (see Supplementary Figure 1A, available on the Arthritis & Rheumatology web site at http:// onlinelibrary.wiley.com/doi/10.1002/art.38875/abstract). To maximize information recovery, 4 PCs were retained, which recovered 46% of variance in patient profiles (see Supplementary Figure 1B). The relationships between patients remained intact on all PCs when the original scores were correlated with desensitized scores (see Patients and Methods) (see Supplementary Figure 2, available on the Arthritis & Rheumatology web site at http://onlinelibrary.wiley.com/doi/10.1002/art.38875/ abstract). Desensitized PCs were used for all subsequent analyses. Meaningful clinical and biologic patterns outlined by the 4 indicators. The PCs outlined major differences or contrasts of characteristics among patients, rather than a uniform presentation of individual patients (Figure 1A) (see Supplementary Figure 1C, available on the Arthritis & Rheumatology web site at http://onlinelibrary.wiley.com/doi/10.1002/art.38875/ abstract). PC 1 was defined by levels of circulating proinflammatory cytokines (summarized as cytokines). PC 2 was defined by increased measures of disease activity and platelet count together with female sex, which contrasted with antinuclear antibodies (ANAs) and hemoglobin (disease activity). PC 3 described a time component with age at diagnosis and time from symptom onset to diagnosis together with higher counts of joints with active disease, hemoglobin, interleukin-17 (IL-17), and enthesitis contrasted with platelet count,
3466
ENG ET AL
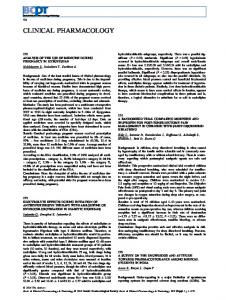
Figure 1. Analytical framework leading to new biologically based patient clusters. A, Desensitized, normalized principal component (PC) loadings of variables. Individual loadings on each PC were set to zero when their 95% confidence intervals, generated by leave-one-out cross-validation, spanned zero. Displayed statistical significance is computed based on these confidence intervals. • • • ⫽ P ⬍ 0.001 (i.e., the 99.9% confidence interval does not span zero); • • ⫽ P ⬍ 0.01 (99% confidence interval); • ⫽ P ⬍ 0.05 (95% confidence interval). Heatmap color codes corresponding to loadings on each PC are illustrated at the bottom of the graph. B, Violin plots showing the relative density of the scores (y-axis) of each patient cluster (x-axis) along each PC (individual graphs). The width of the plot is scaled by the number of patients in each cluster. C, Three-dimensional scatterplots of patients, colored by cluster, along triplets of PCs. Wire meshes depict the 95% confidence interval of the covariance matrices corresponding to each cluster. The axes are labeled at the upper right. IL-17 ⫽ interleukin-17; IFN␥ ⫽ interferon-␥; MIP-1␣ ⫽ macrophage inflammatory protein 1␣; TNF␣ ⫽ tumor necrosis factor ␣; OPG ⫽ osteoprotegerin; MCP-1 ⫽ monocyte chemotactic protein 1; ROM ⫽ range of motion; C-HAQ ⫽ Childhood Health Assessment Questionnaire; JAQQ ⫽ Juvenile Arthritis Quality of Life Questionnaire; VAS ⫽ visual analog scale; PGA ⫽ physician’s global assessment of disease activity; QoML ⫽ quality of my life; ESR ⫽ erythrocyte sedimentation rate; WBC ⫽ white blood cell; ANA ⫽ antinuclear antibody; CRP ⫽ C-reactive protein; RF ⫽ rheumatoid factor; M ⫽ macrophage.
IL-4, and IL-1␣ (age). PC 4 contained a Th1 cytokine signature versus a decrease in Th2 and monocyte/ macrophage cytokine signatures (Th1 versus Th2 and macrophage [M]). Five homogeneous patient clusters recovered by GMMs. We then applied GMMs to patient scores, using the BIC (see Supplementary Figure 3, available on the
Arthritis & Rheumatology web site at http://onlinelibrary. wiley.com/doi/10.1002/art.38875/abstract) to select 5 homogeneous clusters differentiated by meaningful biologic and clinical characteristics. Cluster I was a small, tightly clustered group of children with an older age at onset and very low measures of disease activity and levels of circulating proinflammatory cytokines (skewed
BIOLOGIC BASIS OF CLINICAL HETEROGENEITY IN JIA
toward a Th1 response). Cluster II was an intermediate group with low measures of disease activity and low levels of proinflammatory cytokines (skewed toward a Th1 response). The most diverse group, cluster III, encompassed a broad range of ages at diagnosis, markedly increased measures of disease activity, and moder-
3467
ate levels of Th1/Th17/macrophage-associated soluble mediators of inflammation. The largest cluster, cluster IV, included younger children diagnosed shortly after symptom onset, with higher platelet counts, lower hemoglobin values, intermediate levels of proinflammatory cytokines (skewed toward macrophage/Th2 immune re-
Figure 2. Enhanced ability of clusters to resolve patient heterogeneity compared to International League of Associations for Rheumatology (ILAR) subtypes across PC scores and variables in the discovery cohort. A, Box plots of PC Z scores in clusters and ILAR subtypes. Each box represents the 25th to 75th percentiles. Lines inside the boxes represent the median. Whiskers represent the 3rd and 97th percentiles. B, Box plots of critical (as identified by sensitivity analysis; see Figure 4) clinical variables across clusters and ILAR subtypes. C, Box plots of critical biologic variables across clusters and ILAR subtypes. NS ⫽ not significant; O ⫽ oligoarthritis; P⫺ ⫽ RF-negative polyarthritis; P⫹ ⫽ RF-positive polyarthritis; Ps ⫽ psoriatic arthritis; E ⫽ enthesitis-related arthritis; U ⫽ undifferentiated arthritis (see Figure 1 for other definitions).
3468
sponses), and intermediate measures of disease activity. Cluster V described older children with a delay from symptom onset to diagnosis with low measures of disease activity but very high levels of proinflammatory cytokines. Visually, the patient clusters were homogeneous when their shapes, and distributions were displayed across PCs (Figures 1B, 1C, and 2A). Several metrics were used to assess homogeneity of the clusters and ILAR subtypes. First, we calculated Kruskal-Wallis P values (see Supplementary Table 3, available on the Arthritis & Rheumatology web site at http://onlinelibrary.wiley.com/doi/10.1002/art.38875/ abstract) and also titrated the significance threshold for all individual variables; we show the number of baseline variables with significant Kruskal-Wallis tests at each threshold. As shown in Supplementary Figure 4 (available on the Arthritis & Rheumatology web site at http:// onlinelibrary.wiley.com/doi/10.1002/art.38875/abstract), at almost every significance threshold, there were many more significant Kruskal-Wallis tests under the new
ENG ET AL
scheme than with the ILAR subtypes. The percent variance explained on the original variables was also calculated (see Supplementary Table 4 and Supplementary Figure 5, available on the Arthritis & Rheumatology web site at http://onlinelibrary.wiley.com/doi/10.1002/ art.38875/abstract). Overall, P values were lower and the percent variance explained was higher in the clusters compared to the ILAR subtypes for both individual clinical and biologic variables (Figures 2B and C). These results were also true for the composite PCs (Figure 2A), demonstrating that the clusters were more homogeneous than the ILAR subtypes on both individual and composite measures. This definitive difference in homogeneity was clear when we displayed patient PC scores (heatmaps), grouped by cluster and ILAR subtype, and linkages (ribbons) between these 2 classification schemes using a Circos diagram (Figure 3). Homogeneous patterns were clearly evident in PC scores for each cluster on the left compared to the heterogeneous patterns for each ILAR
Figure 3. Relationships between clusters and ILAR subtypes. The circular plot depicts relationships and patient compositions of each new cluster (left) and ILAR subtype (right). Individual patient scores on each of the 4 principal components (PCs) are depicted in the outermost layer (a), with the heatmap corresponding to the scores for each PC shown at lower left. Each cluster and ILAR subtype is depicted by a color or shade of gray, respectively, in the second layer (b). The ILAR subtype composition (shades of gray) of each cluster and the cluster composition (colors) of each ILAR subtype are depicted in the third layer (c). Colored ribbons link clusters and ILAR subtypes. Numbers of patients are proportional to the width of the ribbons. Thicker ribbons indicate more patients shared between clusters and ILAR subtypes. See Figure 2 for other definitions.
BIOLOGIC BASIS OF CLINICAL HETEROGENEITY IN JIA
3469
Figure 4. Results of sensitivity analysis. Shown are boxplots of (across 100 runs) coclustering probabilities, ordered by medians ascending from left to right (A), and changes in percent variance explained, ordered by medians ascending from left to right (B), on withheld variables for each withheld variable. Each box represents the 25th to 75th percentiles. Lines inside the boxes represent the median. Dots at bottom represent variables with low coclustering probabilities and large negative changes in percent variance explained. See Figure 1 for definitions.
subtype on the right. Additionally, oligoarthritis separated into all 5 clusters regardless of segregation into persistent or extended oligoarthritis (results not shown). Clinically meaningful patterns and linkages were visible; cluster I, which mostly corresponded to an ERA subset, and a large subset of cluster III, which corresponded to RF-negative polyarthritis, suggested that the clustering recapitulated expert-derived patient subtypes while stratifying patients more homogeneously. Patient clusters are largely insensitive to single variable removal. If the clusters represented natural patient groupings, they should not have been sensitive to the specific choice of variables so long as the appropriate clinical and biologic variables were represented. To evaluate their sensitivity to data perturbations, the entire analytical framework was repeated 38 times, each time holding back one variable. Two metrics were considered to compare the resulting 38 LOO patient clusterings to the original clustering: coclustering probability and reduction in percent variance explained. The coclustering probability associated with a variable measures how often pairs of patients originally
coclustered remain coclustered upon removal of that variable (Figure 4A) (see Supplementary Table 5, available on the Arthritis & Rheumatology web site at http:// onlinelibrary.wiley.com/doi/10.1002/art.38875/abstract). Two natural groupings of variable coclustering probabilities existed, separated by a prominent gap near 70%. Of the 14 variables below this threshold, 9 were clinical (enthesitis, Childhood Health Assessment Questionnaire [C-HAQ] score [32], patient’s global assessment of disease activity on a visual analog scale [VAS], Juvenile Arthritis Quality of Life Questionnaire [33], physician’s global assessment of disease activity, age at diagnosis, number of joints with effusions, number of joints with active disease, and number of joints with limited range of motion) and 5 were biologic (erythrocyte sedimentation rate [ESR], and IL-1␣, IL-6, IL-4, and C-reactive protein [CRP] levels). This set of variables did not change when different random initializations were used (see Supplementary Figure 6, available on the Arthritis & Rheumatology web site at http://onlinelibrary.wiley.com/ doi/10.1002/art.38875/abstract). “Reduction in variance explained” measures the
3470
ENG ET AL
Figure 5. Validation. A, PC loadings from the validation cohort compared to PC loadings from the discovery phase. Validation PCs were generated using PC analysis on an independent validation cohort. Each point represents a variable in both the discovery and validation data sets. Pearson correlations are shown along with P values generated using Pearson’s product-moment correlation coefficient test. B, Loadings for validation PCs. The order of variables is the same as that for the discovery PCs shown in Figure 1A. Slashes represent fractalkine, which was not measured in the validation cohort. Individual loadings on each PC were set to zero when their 95% confidence intervals, generated by leave-one-out cross-validation, spanned zero. Displayed statistical significance is computed based on these confidence intervals. • • • ⫽ P ⬍ 0.001 (i.e., the 99.9% confidence interval does not span zero); • • ⫽ P ⬍ 0.01 (99% confidence interval); • ⫽ P ⬍ 0.05 (95% confidence interval). Heatmap color codes corresponding to loadings on each PC are illustrated at the bottom of the graph. C, Violin plots of cluster scores following projection of validation data onto discovery PCs and clusters. Colors, ordering, and interpretation of these plots correspond to those depicting the discovery cohort in Figure 1B. No violin plot is shown for cluster I because no validation cohort patients were assigned to it. See Figure 1 for definitions.
decrease in the predictive value of a patient’s cluster assignment for predicting the associated variable’s value when the original clustering is replaced with the LOO clustering for that variable. Many variables had a significant proportion of their variance explained by the original clustering (Figure 2); however, surprisingly, for many variables, there was little reduction in variance explained when the variable was not used to derive the PCs or the clusters. For example, IL-17 had a substantial proportion of variance explained by the original cluster-
ing (27%), but this only decreased to 24% when IL-17 was not used to determine clusters, suggesting that the clustering was insensitive to the removal of IL-17 but nonetheless predicted IL-17 levels. We noted that the top 10 variables with the greatest reduction in variance explained were also among the 14 with the lowest coclustering probability (Figure 4B) (see Supplementary Table 5 and Supplementary Figure 7, available on the Arthritis & Rheumatology web site at http://onlinelibrary. wiley.com/doi/10.1002/art.38875/abstract). This set of 10
BIOLOGIC BASIS OF CLINICAL HETEROGENEITY IN JIA
“doubly-sensitive” variables was insensitive to random initialization (see Supplementary Figure 6, available on the Arthritis & Rheumatology web site at http:// onlinelibrary.wiley.com/doi/10.1002/art.38875/abstract) and included the Juvenile Arthritis Quality of Life Questionnaire, number of joints with effusions, number of joints with active disease, patient’s global assessment of disease activity on a VAS, physician’s global assessment of disease activity, ESR, C-HAQ score, and IL-4, CRP, and IL-1␣ levels. Indicators and clusters are generalizable. Having established that the clustering was largely insensitive to the absence of individual variables in patient profiles, we determined whether our findings generalized to an independent validation cohort. The loadings of the validation PCs, calculated independently of the discovery PCs, were highly and significantly correlated with the discovery PC loadings (Figure 5A), showing strikingly similar patterns (Figure 5B). We then investigated whether the discovery indicators and clusters were representative of the validation cohort, including whether the clusters were also more homogeneous in that cohort. To do so, patient scores were computed for the validation cohort, and the distribution of these scores was compared to the distribution of those in the discovery cohort. Validation cohort patients were also assigned to clusters. Both the distribution of scores and patients among the clusters in the validation cohort were strongly concordant with those in the discovery cohort (Figure 5C) (see Supplementary Figure 8, available on the Arthritis & Rheumatology web site at http://onlinelibrary.wiley.com/doi/10.1002/ art.38875/abstract). Kruskal-Wallis P values for the clusters also tended to be lower than for the ILAR subtypes (see Supplementary Figure 9, available on the Arthritis & Rheumatology web site at http://onlinelibrary.wiley. com/doi/10.1002/art.38875/abstract). Therefore, the increased homogeneity of the clusters generalized to patient groups not used to derive the clusters, suggesting that the clustering identified generalizable patient groupings that reduced heterogeneity at diagnosis better. Slight differences in cluster assignments (the absence of cluster I) were consistent with underrepresentation of patients with ERA in the validation cohort, as cluster I consisted mainly of patients with ERA. Clusters have distinct disease trajectories. PC 2 was a composite disease activity measure (see above). We plotted baseline and 6-month PC 2 scores for patients across clusters and ILAR subtypes (Figure 6) and found striking patterns that could be resolved by the new clusters. The ILAR subtypes described mixtures of disease trajectories, which were resolved into distinct
3471
Figure 6. Distinct disease trajectories. Scores for principal component (PC) 2 at 6 months were generated by projecting clinical data at 6 months onto PC 2 using loadings generated from baseline data. These scores, at both baseline and 6 months (x-axes), were then Z score–transformed with respect to the mean and SD of baseline PC 2 scores. Each line in each cluster represents 1 patient and connects the patient’s baseline and 6-month PC 2 Z scores (y-axes). Clusters are displayed along the horizontal axis, and International League of Associations for Rheumatology (ILAR) subtypes are displayed along the vertical axis; each cell represents the intersection of patients for a given cluster and ILAR subtype. The leftmost column represents all patients in each cluster, and the top row represents all patients in each ILAR subtype. The cell at the top left represents all patients. For each cluster and ILAR subtype, test statistics (t) and Bonferroni-corrected P values were calculated using paired 2-tailed t-tests to determine whether trajectories within each cluster were not significantly different from each other. Negative values of t describe a general decrease in disease activity from baseline to 6 months. RF ⫽ rheumatoid factor; ERA ⫽ enthesitis-related arthritis.
patterns by the clusters. Three of 5 clusters had significantly distinct disease trajectories (P ⫽ 0.0204, P ⫽ 6.05 ⫻ 10⫺12, P ⫽ 0.0185; Bonferroni correction for the
3472
ENG ET AL
5 clusters) compared to only 1 of 6 ILAR subtypes (P ⫽ 0.000865; Bonferroni correction for the 6 ILAR subtypes). DISCUSSION In this study, we developed an analytical framework to identify and characterize clinically and biologically homogeneous patient subgroups from characteristics at diagnosis, a practical time point for classifying patients. We used a multistage strategy to maximize statistical power and avoid excessive granularity that may impair generalizability to other patient cohorts. At each stage of the analysis, objective measures and rigorous tests guided model selection and validated results. We began our analysis by transforming a large data set to interpretable PCs/composite variables using PCA, an established method for analyzing large data sets in genetic studies (34–36) whose application to distinguish clinical characteristics has previously been studied in JIA (37). Strikingly, these PCs summarized fundamental biologic and clinical characteristics and defined axes for identifying 5 homogeneous patient clusters by cluster analysis (Figures 1–3). These clusters described obviously recognizable patient groups seen in the clinic, resolved major differences between patient subpopulations better than the ILAR subtypes, and were measurably more homogeneous (Figures 2 and 3) (see Supplementary Figures 4 and 5, available on the Arthritis & Rheumatology web site at http://onlinelibrary.wiley.com/ doi/10.1002/art.38875/abstract). Through a comprehensive validation exercise, the new PCs and clusters were reproducible in an unrelated cohort of children with new-onset arthritis (Figure 5), thereby demonstrating that our approach to classification generalizes outside our discovery patient cohort. The clusters also strongly predicted disease course (Figure 6). Taken together, these results validate our approach and provide insight into the biologic basis of clinical heterogeneity in childhood arthritis. The PCs were generated using data alone, and outlined clinically and biologically meaningful patterns among patients while maximizing the variance explained (see Supplementary Figure 1B, available on the Arthritis & Rheumatology web site at http://onlinelibrary.wiley. com/doi/10.1002/art.38875/abstract). Strikingly, the most significant patterns, accounting for the most variability among patients, were levels of circulating proinflammatory cytokines (PC 1), a biologically sensible result given extensive documentation of the role of soluble inflammatory mediators systemically and in affected tissue in childhood arthritis. PC 2 reflected standardized metrics,
including traditional demographic, clinical, and laboratory features including individual components that make up internationally accepted measures of disease activity (27); these features include sex, hemoglobin value, platelet count, and ANAs, all of which are key differentiating features of JIA. The finding that ANAs distinguish subgroups is concordant with previous studies (37). The key features of PC 2 suggest that the transition to a biologically and clinically based disease classification may not require substantial changes in patient assessment and clinical data collection at the bedside. PCs 3 and 4 further stratify patients with diametrically opposed features. PC 3 identified important time components, including age at diagnosis and time from symptom onset to diagnosis, consistent with previous findings that age critically influences underlying biology; differential gene expression patterns in children of different ages present with similar patterns of arthritis (38). Additionally, PCs 3 and 4 clearly distinguished between Th1/Th17 immune responses and Th2 and monocyte/ macrophage activation (9,39,40). The 5 clusters are clinically relevant and resolve major differences better between patient subpopulations (Figures 1B, 1C, and 2) (see Supplementary Figures 4 and 5, available on the Arthritis & Rheumatology web site at http://onlinelibrary.wiley.com/doi/10.1002/art.38875/ abstract). These clusters support clinical observations and sensibilities; for example, subsets of oligoarthritis behave like RF-negative polyarthritis or psoriatic arthritis and vice versa (41). Figure 3 illustrates that homogeneous subsets of ILAR subtypes are found within each cluster; especially striking is cluster I, which largely consists of a subset of patients with ERA. The clusters performed much better than the ILAR subtypes in distinguishing clinical and biologic heterogeneities (Figures 2 and 3). The clusters detected major significant differences in clinical measures of disease activity, including those defining the ILAR subtypes, biologic measures of inflammation, and composite measures by all metrics described above. P values were lower in the clusters than in the ILAR subtypes for both clinical and biologic variables, and the percent variance explained was higher. Importantly, these results held in both the discovery cohort (Figure 2) (see Supplementary Figures 4 and 5, available on the Arthritis & Rheumatology web site at http://onlinelibrary.wiley.com/doi/10.1002/ art.38875/abstract) and the validation cohort (see Supplementary Figures 8 and 9, available on the Arthritis & Rheumatology web site at http://onlinelibrary.wiley.com/ doi/10.1002/art.38875/abstract). The increased homogeneity of the clusters gen-
BIOLOGIC BASIS OF CLINICAL HETEROGENEITY IN JIA
eralized to patient cohorts not used to derive the clusters, suggesting that the clustering identified generalizable patient groupings that resolve heterogeneity at diagnosis better. The ability to discriminate these differences among patients is a fundamental principle on which to build a disease classification. The clinical measures of disease activity and biologic measures of inflammation were often correlated among the clusters. Strikingly, these measures were discordant in cluster V, with relatively asymptomatic children expressing extremely high levels of proinflammatory cytokines. These children were clinically sicker 6 months later, with increased measures of disease activity (Figure 6). Remarkably, clusters I and II also do not improve in disease activity; interestingly, their immune responses are prominently skewed toward Th1 (interferon-␥)–associated cytokine signatures and away from Th2 (IL-4)– and macrophage (IL-1␣)–associated cytokine signatures. Integrating biologic and clinical information may have the greatest impact on these subgroups of children in whom undetected biology underlies clinical phenotype, highlighting the potential impact of biologic information on clinical decisionmaking. Sensitivity analysis showed that the clusters were robust to small variations in the input data, which is remarkable given that we recovered distinct large-scale patterns and patient clusters from 157 children that were validated in 102 children. These attributes are useful for small cohorts and directly address a major challenge, patient numbers, in dealing with rare diseases. The 14 variables that significantly disrupted the clusters upon removal (Figures 2 and 4) (see Supplementary Figures 6 and 7, available on the Arthritis & Rheumatology web site at http://onlinelibrary.wiley.com/doi/10.1002/art.38875/ abstract) demonstrate that our methods identified important factors crucial for differentiating children with arthritis. Nine of these variables make sense clinically, describing disease activity physically (enthesitis and numbers of joints with effusions, with active disease, or with limited range of motion) and from the viewpoints of the physician (physician’s global assessment of disease activity) and the patient (patient’s global assessment of disease activity on a VAS). These variables also incorporate measures of quality of life (Juvenile Arthritis Quality of Life Questionnaire), physical function (CHAQ score), and age at diagnosis. Many of these variables are important indicators of disease progression in childhood arthritis (41–43). The 5 biologic variables, which include general measures of systemic inflammation (ESR and CRP level), soluble mediators of inflammation currently targeted for treatment (IL-1 and IL-6)
3473
(44–47), and a less-studied mediator implicated in disease pathogenesis (IL-4), point to the prominent role of biology in distinguishing clinical heterogeneity in JIA. Interestingly, the clusters differed significantly on circulating IL-1 levels despite excluding patients with systemic arthritis. IL-1 is targeted for therapy in systemic arthritis (1,12,18). Interestingly, an IL-1␣ signature was found in the remaining ILAR subtypes, suggesting a mechanistic answer to differences in the efficacy of IL-1 blockade (IL-1 receptor antagonism versus specific anti–IL-1 therapy) in some children with nonsystemic arthritis (48,49). The key role of IL-4 in defining patient groups by sensitivity analysis supports earlier studies implicating Th2-related cytokines in moderating the pathogenesis of childhood arthritis (50,51). Using data alone, our analytical framework recovered important known biomarkers in JIA and provided a means to integrate these known biologic signals with important clinical signals to identify homogeneous patient subpopulations. The strict eligibility criterion to be treatmentnaive at study entry presents several limitations, including the potential overrepresentation of children with mild disease, as evidenced by the lack of patients with systemic arthritis in our study population. These children are likely prescribed immunosuppressive therapy prior to satisfying the diagnostic criterion of a minimum duration of 6 weeks of arthritis, thus preventing study entry. Another study limitation is a practical one, the limiting of participation to the small number of academic health science centers with the resources for appropriate sample processing and storage prior to transportation to the core laboratory. This limitation has resulted in a national effort to use simple, standardized protocols for sample collection (52), which minimizes processing at sample collection, thus allowing physicians across Canada to participate regardless of resource availability. Our study produced exciting and meaningful results using proven methodology applied to a small inception cohort and established an analytical framework using machine learning algorithms. In constructing this conceptual framework, we used validated approaches to extract information from large data sets and to handle missing data, a practical reality in clinical medicine, and thereby developed a promising approach for integrating diverse and heterogeneous data sets to recover meaningful patterns. Our results suggest that machine learning is a powerful and feasible approach for pattern recognition, culminating in a new integrated approach to disease classification for childhood arthritis that provides insight into the biology underlying clinical
3474
ENG ET AL
heterogeneity. Better disease definitions form the cornerstone of better understanding and ultimately better treatments and outcomes in a new era of personalized medicine.
15.
AUTHOR CONTRIBUTIONS
16.
All authors were involved in drafting the article or revising it critically for important intellectual content, and all authors approved the final version to be published. Dr. Yeung had full access to all of the data in the study and takes responsibility for the integrity of the data and the accuracy of the data analysis. Study conception and design. Rosenberg, Morris, Yeung. Acquisition of data. Eng, Duong, Rosenberg, Yeung. Analysis and interpretation of data. Eng, Rosenberg, Morris, Yeung.
REFERENCES 1. Petty RE, Southwood TR, Manners P, Baum J, Glass DN, Goldenberg J, et al. International League of Associations for Rheumatology classification of juvenile idiopathic arthritis: second revision, Edmonton, 2001. J Rheumatol 2004;31:390–2. 2. Martini A. It is time to rethink juvenile idiopathic arthritis classification and nomenclature. Ann Rheum Dis 2012;71:1437–9. 3. Hunter PJ, Wedderburn LR. Pediatric rheumatic disease: can molecular profiling predict the future in JIA? Nat Rev Rheumatol 2009;5:593–94. 4. Hinks A, Cobb J, Sudman M, Eyre S, Martin P, Flynn E, et al. Investigation of rheumatoid arthritis susceptibility loci in juvenile idiopathic arthritis confirms high degree of overlap. Ann Rheum Dis 2012;71:1117–21. 5. Hinks A, Eyre S, Ke X, Barton A, Martin P, Flynn E, et al. Association of the AFF3 gene and IL2/IL21 gene region with juvenile idiopathic arthritis. Genes Immun 2010;11:194–8. 6. Hinks A, Martin P, Flynn E, Eyre S, Packham J, Childhood Arthritis Prospective Study (CAPS), UKRAG Consortium, BSPAR Study Group, et al. Association of the CCR5 gene with juvenile idiopathic arthritis. Genes Immun 2010;11:584–9. 7. Omoyinmi E, Forabosco P, Hamaoui R, Bryant A, Hinks A, Ursu S, et al. Association of the IL-10 gene family locus on chromosome 1 with juvenile idiopathic arthritis (JIA). PLoS One 2012;7:e47673. 8. Ogilvie EM, Khan A, Hubank M, Kellam P, Woo P. Specific gene expression profiles in systemic juvenile idiopathic arthritis. Arthritis Rheum 2007;56:1954–65. 9. Jarvis JN, Jiang K, Frank MB, Knowlton N, Aggarwal A, Wallace CA, et al. Gene expression profiling in neutrophils from children with polyarticular juvenile idiopathic arthritis. Arthritis Rheum 2009;60:1488–95. 10. Barnes MG, Aronow BJ, Luyrink LK, Moroldo MB, Pavlidis P, Passo MH, et al. Gene expression in juvenile arthritis and spondyloarthropathy: pro-angiogenic ELR⫹ chemokine genes relate to course of arthritis. Rheumatology (Oxford) 2004;43:973–9. 11. Barnes MG, Grom AA, Thompson SD, Griffin TA, Pavlidis P, Itert L, et al. Subtype-specific peripheral blood gene expression profiles in recent-onset juvenile idiopathic arthritis. Arthritis Rheum 2009;60:2102–12. 12. Allantaz F, Chaussabel D, Stichweh D, Bennett L, Allman W, Mejias A, et al. Blood leukocyte microarrays to diagnose systemic onset juvenile idiopathic arthritis and follow the response to IL-1 blockade. J Exp Med 2007;204:2131–44. 13. Griffin TA, Barnes MG, Ilowite NT, Olson JC, Sherry DD, Gottlieb BS, et al. Gene expression signatures in polyarticular juvenile idiopathic arthritis demonstrate disease heterogeneity and offer a molecular classification of disease subsets. Arthritis Rheum 2009;60:2113–23. 14. Rooney M, Varsani H, Martin K, Lombard PR, Dayer JM, Woo P.
17.
18.
19.
20.
21.
22.
23. 24.
25. 26.
27. 28. 29. 30. 31. 32.
Tumour necrosis factor ␣ and its soluble receptors in juvenile chronic arthritis. Rheumatology (Oxford) 2000;39:432–8. Shahin AA, Shaker OG, Kamal N, Hafez HA, Gaber W, Shahin HA. Circulating interleukin-6, soluble interleukin-2 receptors, tumor necrosis factor ␣, and interleukin-10 levels in juvenile chronic arthritis: correlations with soft tissue vascularity assessed by power Doppler sonography. Rheumatol Int 2002;22:84–8. Lotito AP, Campa A, Silva CA, Kiss MH, Mello SB. Interleukin 18 as a marker of disease activity and severity in patients with juvenile idiopathic arthritis. J Rheumatol 2007;34:823–30. Cattalini M, Maduskuie V, Fawcett PT, Brescia AM, Rose CD. Predicting duration of beneficial effect of joint injection among children with chronic arthritis by measuring biomarkers concentration in synovial fluid at the time of injection. Clin Exp Rheumatol 2008;26:1153–60. Pascual V, Allantaz F, Arce E, Punaro M, Banchereau J. Role of interleukin-1 (IL-1) in the pathogenesis of systemic onset juvenile idiopathic arthritis and clinical response to IL-1 blockade. J Exp Med 2005;201:1479–86. Scola MP, Thompson SD, Brunner HI, Tsoras MK, Witte D, Van Dijk MA, et al. Interferon-␥:interleukin 4 ratios and associated type 1 cytokine expression in juvenile rheumatoid arthritis synovial tissue. J Rheumatol 2002;29:369–78. De Jager W, Hoppenreijs EP, Wulffraat NM, Wedderburn LR, Kuis W, Prakken BJ. Blood and synovial fluid cytokine signatures in patients with juvenile idiopathic arthritis: a cross-sectional study. Ann Rheum Dis 2007;66:589–98. Van den Ham HJ, de Jager W, Bijlsma JW, Prakken BJ, de Boer RJ. Differential cytokine profiles in juvenile idiopathic arthritis subtypes revealed by cluster analysis. Rheumatology (Oxford) 2009;48:899–905. Hunter PJ, Nistala K, Jina N, Eddaoudi A, Thomson W, Hubank M, et al. Biologic predictors of extension of oligoarticular juvenile idiopathic arthritis as determined from synovial fluid cellular composition and gene expression. Arthritis Rheum 2010;62: 896–907. Angeles-Han S, Prahalad S. The genetics of juvenile idiopathic arthritis: what is new in 2010? Curr Rheumatol Rep 2010;12: 87–93. Thompson SD, Marion MC, Sudman M, Ryan M, Tsoras M, Howard TD, et al. Genome-wide association analysis of juvenile idiopathic arthritis identifies a new susceptibility locus at chromosomal region 3q13. Arthritis Rheum 2012;64:2781–91. Prakken B, Albani S, Martini A. Juvenile idiopathic arthritis. Lancet 2011;377:2138–49. Committee on a Framework for Developing a New Taxonomy of Disease, National Academy of Sciences. Toward precision medicine: building a knowledge network for biomedical research and a new taxonomy of disease (2011). Washington (DC): National Academies Press; 2011. URL: http://dels.nas.edu/report/towardprecision-medicine-building-knowledge/13284. Giannini EH, Ruperto N, Ravelli A, Lovell DJ, Felson DT, Martini A. Preliminary definition of improvement in juvenile arthritis. Arthritis Rheum 1997;40:1202–9. Stacklies W, Redestig H, Scholz M, Walther D, Selbig J. pcaMethods: a Bioconductor package providing PCA methods for incomplete data. Bioinformatics 2007;23:1164–7. Nyamundanda G, Brennan L, Gormley IC. Probabilistic principal component analysis for metabolomic data. BMC Bioinformatics 2010;11:571. Fraley C, Raftery AE. MCLUST version 3 for R: normal mixture modeling and model-based clustering. Seattle: University of Washington; 2006. Krzywinski M, Schein J, Birol I, Connors J, Gascoyne R, Horsman D, et al. Circos: an information aesthetic for comparative genomics. Genome Res 2009;19:1639–45. Singh G, Athreya BH, Fries JF, Goldsmith DP. Measurement of health status in children with juvenile rheumatoid arthritis. Arthritis Rheum 1994;37:1761–9.
BIOLOGIC BASIS OF CLINICAL HETEROGENEITY IN JIA
33. Duffy CM, Arsenault L, Duffy KN, Paquin JD, Strawczynski H. The Juvenile Arthritis Quality of Life Questionnaire—development of a new responsive index for juvenile rheumatoid arthritis and juvenile spondyloarthritides. J Rheumatol 1997;24:738–46. 34. Novembre J, Johnson T, Bryc K, Kutalik Z, Boyko AR, Auton A, et al. Genes mirror geography within Europe [published erratum appears in Nature 2008;456:274]. Nature 2008;456:98–101. 35. Markle JG, Frank DN, Mortin-Toth S, Robertson CE, Feazel LM, Rolle-Kampczyk U, et al. Sex differences in the gut microbiome drive hormone-dependent regulation of autoimmunity. Science 2013;339:1084–8. 36. Turnbaugh PJ, Hamady M, Yatsunenko T, Cantarel BL, Duncan A, Ley RE, et al. A core gut microbiome in obese and lean twins. Nature 2009;457:480–4. 37. Ravelli A, Varnier GC, Oliveira S, Castell E, Arguedas O, Magnani A, et al. Antinuclear antibody–positive patients should be grouped as a separate category in the classification of juvenile idiopathic arthritis. Arthritis Rheum 2011;63:267–75. 38. Barnes MG, Grom AA, Thompson SD, Griffin TA, Luyrink LK, Colbert RA, et al. Biologic similarities based on age at onset in oligoarticular and polyarticular subtypes of juvenile idiopathic arthritis. Arthritis Rheum 2010;62:3249–58. 39. Cosmi L, Cimaz R, Maggi L, Santarlasci V, Capone M, Borriello F, et al. Evidence of the transient nature of the Th17 phenotype of CD4⫹CD161⫹ T cells in the synovial fluid of patients with juvenile idiopathic arthritis. Arthritis Rheum 2011;63:2504–15. 40. Ravelli A, Grom AA, Behrens EM, Cron RQ. Macrophage activation syndrome as part of systemic juvenile idiopathic arthritis: diagnosis, genetics, pathophysiology and treatment. Genes Immun 2012;12:289–98. 41. Ravelli A, Felici E, Magni-Manzoni S, Pistorio A, Novarini C, Bozzola E, et al. Patients with antinuclear antibody–positive juvenile idiopathic arthritis constitute a homogeneous subgroup irrespective of the course of joint disease. Arthritis Rheum 2005; 52:826–32. 42. Brunner HI, Klein-Gitelman MS, Miller MJ, Trombley M, Baldwin N, Kress A, et al. Health of children with chronic arthritis: relationship of different measures and the quality of parent proxy reporting. Arthritis Rheum 2004;51:763–73. 43. Falcone A, Cassone R, Rossi E, Pistorio A, Martini A, Ravelli A. Inter-observer agreement of the physician’s global assessment of disease activity in children with juvenile idiopathic arthritis. Clin Exp Rheumatol 2005;23:113–6. 44. Gattorno M, Chicha L, Gregorio A, Ferlito F, Rossi F, Jarrossay D, et al. Distinct expression pattern of IFN-␣ and TNF-␣ in juvenile idiopathic arthritis synovial tissue. Rheumatology (Oxford) 2007;46:657–65. 45. De Benedetti F, Brunner HI, Ruperto N, Kenwright A, Wright S, Calvo I, et al. Randomized trial of tocilizumab in systemic juvenile idiopathic arthritis. N Engl J Med 2012;367:2385–95. 46. Pignatti P, Vivarelli M, Meazza C, Rizzolo MG, Martini A, De
3475
47.
48.
49.
50.
51.
52.
Benedetti F. Abnormal regulation of interleukin 6 in systemic juvenile idiopathic arthritis. J Rheumatol 2001;28:1670–6. De Benedetti F, Massa M, Robbioni P, Ravelli A, Burgio GR, Martini A. Correlation of serum interleukin-6 levels with joint involvement and thrombocytosis in systemic juvenile rheumatoid arthritis. Arthritis Rheum 1991;34:1158–63. Ilowite N, Porras O, Reiff A, Rudge S, Punaro M, Martin A, et al. Anakinra in the treatment of polyarticular-course juvenile rheumatoid arthritis: safety and preliminary efficacy results of a randomized multicenter study. Clin Rheumatol 2009;28:129–37. Ungar WJ, Costa V, Burnett HF, Feldman BM, Laxer RM. The use of biologic response modifiers in polyarticular-course juvenile idiopathic arthritis: a systematic review. Semin Arthritis Rheum 2013;42:597–618. Suppiah V, Rooney M, Vandenbroeck K. Polymorphisms in the interleukin-4 and IL-4 receptor genes modify risk for chronic inflammatory arthropathies in women. Exp Mol Pathol 2006;81: 239–44. Thompson SD, Luyrink LK, Graham TB, Tsoras M, Ryan M, Passo MH, et al. Chemokine receptor CCR4 on CD4⫹ T cells in juvenile rheumatoid arthritis synovial fluid defines a subset of cells with increased IL-4:IFN-␥ mRNA ratios. J Immunol 2001;166: 6899–906. Matheson LA, Duong TT, Rosenberg AM, Yeung RS. Assessment of sample collection and storage methods for multicenter immunologic research in children. J Immunol Methods 2008;339:82–9.
APPENDIX A: CONTRIBUTING MEMBERS OF REACCH OUT AND BBOP CONSORTIA The following members of the REACCH OUT and BBOP consortia, all in Canada, contributed to detailed patient data acquisition and biologic specimen collection: Paul Dancey (Janeway Children’s Hospital and Rehabilitation Centre, St. John’s, Newfoundland); Adam Huber, Bianca Lang, Suzanne Ramsey, and Elizabeth Stringer (IWK Health Centre, Halifax, Nova Scotia); Anne-Laure Chetaille (le Centre Hospitalier Universitaire de Que´bec, Que´bec, Quebec); Chantal Guillet (Sante´ et Services Sociaux, Que´bec, Quebec); Gilles Boire (l’Universite´ de Sherbrooke, Que´bec, Quebec); Sarah Campillo, Gae¨lle Che´deville, Cia´ran Duffy, Karen Duffy, Michele Gibbon, and Rosie Scuccimarri (McGill University, Montre´al, Quebec); Roman Jurencak and Johannes Roth (Children’s Hospital of Eastern Ontario, Ottawa, Ontario); Susanne Benseler, Bonnie Cameron, Brian Feldman, Ronald Laxer, Rayfel Schneider, Earl Silverman, Lynn Spiegel, and Shirley Tse (The Hospital for Sick Children, Toronto, Ontario); Kiem Oen (Health Sciences Centre, Winnipeg, Winnipeg, Manitoba); Adam Baxter-Jones, Lynn Maenz, Loren Matheson, and Elham Rezaei (University of Saskatchewan, Saskatoon, Saskatchewan); Janet Ellsworth and Claire LeBlanc (Alberta Health Services, Edmonton, Alberta); and David Cabral, Jaime Guzman, Kristin Houghton, Ross Petty, Lori Tucker, and Stuart Turvey (BC Children’s Hospital, Vancouver, British Columbia).