The breakdown of synchronization Extended Abstract Christian Hofer, Georg Jäger & Thomas Brudermann* University of Graz Institute of Systems Sciences, Innovation and Sustainability Research Merangasse 18/1, 8010 Graz, Austria *Corresponding author:
[email protected]
1 Introduction Synchronization is a common emergent property in systems of coupled oscillators. It can be observed in many natural occurring systems; on a microbiological level, examples include intracellular dynamics, circadian rhythms (Golombek & Rosenstein, 2010) or neural systems (Varela, Lachaux, Rodriguez, & Martinerie, 2001). In ecological systems, synchrony occurs in population dynamics or on behavioral levels (e.g. synchronized flashing of male fireflies in the species photinus carolinus,(Copeland & Moiseff, 1994)). But also more complex social systems tend to exhibit synchronization patterns, even if there is no top-down coordination. Existing research has addressed various mechanisms leading to synchronization. In population dynamics, synchrony may arise from three simple mechanisms; (a) dispersal/exchange of individuals among populations, (b) congruent dependence on a synchronous exogenous factor (e.g. temperature) or trophic interactions with other species, e.g. predator-prey relations (Liebhold, Koenig, & Bjornstad, 2004). Climate variability drives population cycling and synchrony (Pomara & Zuckerberg, 2017), and infanticide (e.g. due to predator pressure) seems to be an evolutionary driver for breeding synchrony in various species (Poikonen, Koskela, Mappes, & Mills, 2008). Holland & Hastings (2008) argue that synchronization furthermore is favored by increases in coupling strength and large-scale network structures that produce short cuts and clustering (small world topology). Synchronization of animal behavior, such as bird flocking or fish shoaling, has been shown to be the result of simple behavioral rules (Herbert-Read et al., 2011). In human social systems, synchronization can be observed as well. One prime example was the swaying of the London millennium bridge on its opening day as a result of crowd synchrony (Strogatz, Abrams, McRobie, Eckhardt, & Ott, 2005). Another interesting example is the synchronization of audience applause in concert halls (Mann, Faria, Sumpter, & Krause, 2013; Néda, Ravasz, Vicsek, Brechet, & Barabási, 2000). In a broader sense, and as a result of social influence and mimicking, “synchronized” behaviors can frequently be observed: Fashion hypes or investor herding in boom-bust cycles on stock markets (Fenzl & Pelzmann, 2012) are just two examples. While mechanisms of synchronization in various systems have been addressed in several studies, there has been little attention to mechanisms of desynchronization. For example, Holland & Hastings (2008) note that heterogeneous (ecological) networks have longer periods of asynchronous dynamics and consequently lower amplitude fluctuations in population abundances, and Lai & Porter (2013) claim that noise plays a significant role in synchronization and desynchronization. However, synchronization break-downs have not received a lot of attention so far outside the neurology and engineering domains. The aim of this research therefore is to study the desynchronization of systems: When do synchronized systems become asynchronous again, and what are the mechanisms behind the break-down of synchronization? As a starting point, we test desynchronization in a rather simple system, namely applause in a concert hall. This system is characterized by clear boundaries, simple behavioral systems, and availability of data from previous studies.
2 Methods and Agent Behavior In our preliminary agent-based model, implemented in NetLogo 6.0.1, we simulate applause in a concert hall with 1000 randomly distributed agents. Each agent has a preferred fast clapping frequency f1 and a preferred slow clapping frequency f2. Both these properties are distributed according to a Gaussian distribution, with means at four and two claps per second respectively. Data used for simulation was obtained from empirical measurements reported by Néda et al. (2000). The clapping behavior of the agents is influenced by (1) the intrinsic preference of each agent and (2) the actions of neighboring agents on the other hand. When agents start clapping, they will initially clap in their preferred fast frequency f1. Over time, however, they get tired and their clapping frequency decreases, until the point where they reach their preferred slow clapping frequency f2. They continue to clap in this frequency until they reach a certain level of tiredness, at which they stop. Under certain circumstances agents will deviate from their preferred frequencies in order to clap in unison with others. When an agent is already close to clapping (i.e. a certain portion pf of the interval, 0< pf 200 to facilitate illustration.
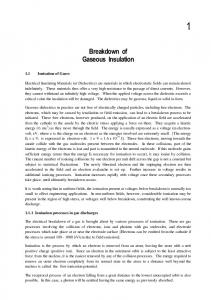
In most parameter settings, simulations exhibit three distinct phases: Asynchronous clapping, synchronized clapping and desynchronized clapping. In the first phase, agents begin to clap at a fast frequency. Here we do not observe any synchronization, mainly because the average frequency is too high. Agents hear a constant noise of claps from every direction, so as soon as they are ready to clap, they do so, and no synchronization can occur.
This is changing in the second phase (roughly after 15 seconds in a typical simulation run as illustrated in Figure 1). The average frequency then is low enough for distinct claps to be perceived. Contrary to phase one, in which agents immediately clap after the interval pf *f2 (they are ready to clap, perceive another clap, and join), it takes longer until agents perceive a clap they can ‘join’ – a result of lower frequencies. In the fast clapping phase synchronization is not possible due to noise; slower clapping however generates the ‘wiggle room’ in which synchrony can emerge. These marginally increased periods between clapping are necessary for synchronization, as they change the effective clapping frequency of each agent; consequently one dominant frequency begins to emerge. After about 20 seconds the majority of agents clap in synchrony. The phase of desynchronization is of particular interest for us. It starts after approximately 30 seconds, when some agents become increasingly tired, reduce clapping speed and therefore are less likely to clap in an other than their preferred frequency. This leads to the situation that some agents ignore the dominant frequency and clap in their preferred (and slower) frequency f2. This behavior is contagious in the sense that other agents are stimulated to clap outside the dominant frequency as well. As a result, clusters of different frequencies form, with a growing number of agents clapping in their preferred frequency f2, without regard for their surroundings. This leads to a steep decrease and the breakdown of synchronization. In the last phase the previously synchronous clapping deteriorates into random noise – an effect that can be observed in reality as well. Our model includes two parameters that cannot be extracted from empirical data, thus their influence on the outcome was determined in a sensitivity analysis: The range of influence of each agent mainly determines how fast synchronization is achieved, but the concrete value of this range does not influence the qualitative result of the simulation, as long as it is big enough that information can be transmitted between all agents. The initial value of pf, the second parameter, influences how fast synchronization is achieved. For values above .8 the clapping stops before full synchronization is reached.
4 Discussion and Outlook In this short paper we summarized preliminary findings on the study of synchronization break-down. The findings for the example of applause dynamics suggest that simple, empirically grounded agent rules are sufficient to induce synchronization; the very same rules consequently initiate the break down of synchronization. Applause dynamics are a rather simple system. This makes the present model well suited as an accessible starting point to the topic of desynchronization, with the final goal of understanding mechanisms of synchronization breakdown in more complex social systems. This topic is especially relevant, since highly synchronized human behaviors, be it on stock markets, in politics or simply when walking over a bridge, bear hazardous potential. Also species in sync often are more vulnerable to exogenous threats (e.g. if a cold wave hits synchronously blooming apple trees, the entire harvest is most likely lost). While the processes that lead to synchronization are very well understood, the topic of desynchronization is often neglected. Considering the impact synchronization and desynchronization have on the sustainability of systems, we consider it important to fill this gap. This research therefore aims to contribute to identification, collection and modeling of various mechanisms that lead to synchronization and, more importantly, its breakdown.
5 References Copeland, J., & Moiseff, A. (1994). The occurrence of synchrony in the North American firefly Photinus carolinus (Coleoptera: Lampyridae). Journal of Insect Behavior, 8(3), 381–394.
Fenzl, T., & Pelzmann, L. (2012). Psychological and Social Forces Behind Aggregate Financial Market Behavior. Journal of Behavioral Finance, 13(1), 56–65. Golombek, D. A., & Rosenstein, R. E. (2010). Physiology of Circadian Entrainment. Physiological Reviews, 90(3):1063-1102. Herbert-Read, J. E., Perna, A., Mann, R. P., Schaerf, T. M., Sumpter, D. J. T., & Ward, A. J. W. (2011). Inferring the rules of interaction of shoaling fish. Proceedings of the National Academy of Sciences of the United States of America, 108(46), 18726–31. Holland, M. D., & Hastings, A. (2008). Strong effect of dispersal network structure on ecological dynamics. Nature, 456(7223), 792–4. Lai, Y. M., & Porter, M. A. (2013). Noise-induced synchronization, desynchronization, and clustering in globally coupled nonidentical oscillators. Physical Review E - Statistical, Nonlinear, and Soft Matter Physics, 88(1), 1–7. Liebhold, A., Koenig, W. D., & Bjornstad, O. N. (2004). Spatial Synchrony in Population Dynamics. Annual Review of Ecology, Evolution and Systematics, 35(1), 467–490. Mann, R. P., Faria, J., Sumpter, D. J. T., & Krause, J. (2013). The dynamics of audience applause. Journal of The Royal Society Interface, 10(85), 20130466–20130466. Néda, Z., Ravasz, E., Vicsek, T., Brechet, Y., & Barabási, A. L. (2000). Physics of the rhythmic applause. Physical Review E - Statistical Physics, Plasmas, Fluids, and Related Interdisciplinary Topics, 61(6 B), 6987–6992. Poikonen, T., Koskela, E., Mappes, T., & Mills, S. C. (2008). Infanticide in the evolution of reproductive synchrony: Effects on reproductive success. Evolution, 62(3), 612–621. Pomara, L. Y., & Zuckerberg, B. (2017). Climate variability drives population cycling and synchrony. Diversity and Distributions, 1–14. Strogatz, S. H., Abrams, D. M., McRobie, A., Eckhardt, B., & Ott, E. (2005). Theoretical mechanics: Crowd synchrony on the Millennium Bridge. Nature, 438(7064), 43–44. Varela, F., Lachaux, J.-P., Rodriguez, E., & Martinerie, J. (2001). The brainweb: Phase synchronization and large-scale integration. Nature Reviews Neuroscience, 2(4), 229–239.