amortizes reliable data writes [Gra78, Hae83]. The ... spooling into Safe RAM all data and/or log pages ... recovery from disk media failure, which writes a log of.
The Case For Safe RAM George Copeland, Tom Keller, Ravi Krishnamurthy
and Marc Smith
MCC 3500 West Balcones Center Drive Austin, Texas 78759 (512) 338-3473
Abstract Battery-backed-up DRAM memories can be configured today to be almost as reliable as disk. This paper argues that it is cost-effective to employ Safe RAM in computer systems which support reliable updates. Safe RAM allows systems that support reliable updates, such as database and transaction processing systems, to perform more efficiently. We show how a response time improvement can always be realized, and how a throughput improvement can be realized to the extent that a system has had to limit disk utilization to achieve adequate response time. We also show that Safe RAM is cost-effective today for most applications and will become increasingly cost-effective as more caching is used, and as DRAM standby power and disk active power decrease.
1 Introduction This paper investigates whether it is cost-effective to employ in computer systems a memory that is made almost as reliable as disk, which we call Safe RAM. We define Safe RAM as a memory having enough backup power to keep both the memory and disk alive for long enough to copy the memory to disk, as well as adequate protection from runaway software. Some Safe RAM features are available in some systems t0day.t However, a convincing argument has not yet been made for the cost-effectiveness of Safe RAM. A major area of opportunity for Safe RAM is in support of reliable updates which must be made atomic and persistent. Although other benefits may exist for Safe we base our RAM (e.g., improved availability), cost-effectiveness arguments only on reliable updates. Many computer systems, such as database and transaction processing systems, must support reliable Such systems typically employ several updates. conventional techniques for amortizing disk I/O across The most common, caching multiple transactions. (i.e., memory buffering for disk reads), amortizes t Tandem, Stratus, HP, DEC’s Mira, *IBM disk caches and Amdahl RAM disks have the ca ablht of keeping memory alive during power failure. The?BM 1S400 has an option that allows both the memory and disk to continue operation for several minutes. Permission to copy without fee all OT part of this material is granted provided that the copies are not made OT distributed for direct commercial advantage, the VLDB copyright notice and the title of the publication and its date appear, and notice is given that copying ia by permission of the Very Large Data Base Endowment. To copy otherwise, OT to republish, requires a fee and/or special permission from the Endowment.
Proceedings Conference
of the Fifteenth International on Very Large Data Bases
reads. The addition of logging and checkpointing amortizes reliable data writes [Gra78, Hae83]. The further addition of group commit amortizes log writes [DeW84, Gaw85]. A common thread among these techniques is that disk is assumed to be a stable mass storage and RAM is not, so that a transaction must commit its reliable updates by forcing either the updated data pages or logs containing the updates out to disk. A performance limitation of this assumption is that a transaction must wait on at least one disk write for the log. We can overcome this limitation by the strategy of spooling into Safe RAM all data and/or log pages containing reliable updates. A transaction can then safely commit after having written its updates to the Safe RAM, thus avoiding the need for forcing logs or pages containing reliable updates to disk during the critical path of a transaction. Pages are written from the Safe RAM to disk by a background task whenever the disk has no other I/O to perform. This strategy allows all disk writes for reliable updates to be removed from the critical path of any transaction. This gives Safe RAM a performance advantage for disk bottlenecked systems, which can be applied at different points along the throughput and response time continuum. We show that a response time improvement can always be realized, and that a throughput improvement can be realized to the extent a system has had to limit disk utilization to achieve adequate response time. The performance advantages of Safe RAM increase in time as technology progresses. Safe RAM is of marginal advantage in processor-bottlenecked systems; however, processor MIPS are becoming cheaper at a much faster rate than disk arms. Also, DRAM standby power and disk active power, which contribute to the cost of Safe RAM, are decreasing at a rapid rate. Thus, the reasons why Safe RAM may not have been a good idea in the past are rapidly diminishing. We first discuss the feasibility and cost of Safe RAM using conventional technologies in Section 2. In Section 3, we review conventional techniques for reliable updates and show how they can be easily extended to use Safe RAM. Sections 4 and 5 quantify the performance impact of this Safe RAM extension to the best of the conventional techniques and show when it is cost-effective. Throughout this comparison, we make assumptions that are pessimistic for Safe RAM. Section 6 discusses some related issues. Section 7 provides a summary.
2 Feasibility And Cost Of Safe RAM In this section, we first describe how Safe RAM can RAM, UPS conventional using be realized (uninterruptible power supply) and memory-protection Amsterdam,
- 327 -
1989
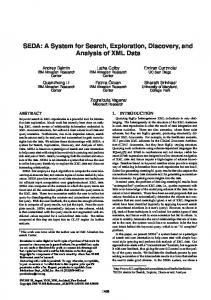
technologies using either of two physical organizations. Then, we describe how the additional cost involves only a few per cent of the system cost. We use this cost later as a basis for determining cost-effectiveness. 2.1 Realization With Conventional Technology We view the storage hierarchy of the system as shown in Figure 2.1. It consists of 1) a main conventional RAM, 2) a Safe RAM which we call the Safe, and 3) a conventional disk. The main RAM contains code, system files, temporary results, transaction workspaces and a cache for the most frequently used pages of the database. The Safe is used as a stable intermediate storage for reliable updates to disk, such that the pages in the Safe are almost as resilient to system and power failures as pages in disk.t We use a foreground (i.e., high priority) disk queue for database reads and I/O for temporary data, and a background (i.e., low priority) oueue to spool reliable data and loa writes.
Figure 2.1: A Storage Hierarchy With Safe RAM Although the Safe is built using off-the-shelf RAM technology, it must be made almost as safe as disk. A disk is nonvolatile and is protected by requiring access through a controller. Making RAM almost as safe as disk requires roughly comparable nonvolatility and protection. Non-volatility is accomplished by using a UPS for the Safe, the disk and the disk controller. Upon UPS detection of power failure, these components are switched to UPS battery power and the Safe’s contents are written to disk. When normal power is reinstated, recovery requires no special procedure. The UPS power requirement is the total active power of these components plus the standby power of the Safe’s DRAM. The UPS energy (energy=power*time) requirement is dependent upon the time to write the Safe to disk. Safe RAM is a storage medium. The physical failure rate of equally-priced disk and parity-based RAM subsystems are roughly equivalent [Bel88]. Any of the conventional recovery techniques used for disk media failure in conventional systems can be used to protect against Safe RAM media failure as well. Most database systems use a checkpoint and log technique for recovery from disk media failure, which writes a log of updates for each transaction before the transaction is allowed to commit and periodically writes a checkpoint of the database, both to a separate media than those Some database containing the database [Gra78]. svstems offer an ootional mirrored-disk techniaue for t[Gra78] (in Section 5.8.3.2) makesthe historical note that databasesystemsusing core memories, which were nonvolatile, assumed that the contents of m-core system crashes.
logs survived
- 328 -
recovery from disk media failure, which maintains two copies of the database on separate disks by applying writes to both disk copies [Kat78]. The mirrored-disk technique improves availability because recovery is much faster than the checkpoint and log technique, but increases cost. The choice of whether to use this technique is based on the application’s availability and cost requirements and the expected frequency of disk media failure. In systems that use the mirrored-disk technique, the checkpoint and log technique is usually also used as a backup for media recovery and for recovery from user and system errors which commit incorrect updates to the database. A similar choice of whether to use a mirrored Safe for recovery from Safe media failure is possible. 2.2 Physical Realizations Figure 2.2 illustrates two physical realizations of the Safe. The Separate Safe realization employs a Safe which is separate from the main RAM and requires a separate mode of access (e.g., through a controller in a “silicon disk” implementation). The Integrated Safe realization makes the entire main RAM safe, so that the Safe pages can be distributed throughout the main RAM, intermixed with other pages (e.g., workspace and cache pages).
~1~~
Figure 2.2: Physical Realizations The advantages of the Separate Safe are: No additional protection requirements are needed, because the separate mode of access to the Separate Safe by the main processor protects the Safe from “runaway” system errors which result in undesired For the Integrated Safe, writes to memory. additional memory protection may be required to reduce the frequency of recovery. Conventional memory protection techniques (e.g., generous use of process virtual address spaces, write-protection mechanisms available in conventional MMUs, shadow memory pages or mirrored processor and memory pairs) can be used to ensure that only very limited types of system or user-program errors can damage Safe contents. Only the disk controller, the Safe and the disk require battery power and energy during the time required to write the Safe to disk. The Integrated Safe requires all of memory to be refreshed during this time. The advantages of the Integrated Safe are: The size of the Safe in Integrated Safe can be dynamically varied up to the size of main memory. The size of the Separate Safe is fixed at a smaller moderate size and therefore requires the additional complexity of handling the case where the size of the Safe is exceeded (e.g., by forcing writes to the disk instead of the Safe until room becomes available in l
l
l
the Safe). Also, the cost of additional memory for the Integrated Safe to accommodate the Safe contents is limited to the average Safe size instead of a maximum Safe size as in the case of the Separate Safe. Copying pages between workspaces, the cache and the Safe is not necessary. Instead, pointers and protection status can be updated to reflect the move without physically copying the pages. The Separate Safe requires transfers between the main RAM and the Safe using a different, and probably slower, mode of access. This advantage is important for throughput if the processor is the bottleneck (since less work is required) and for response time (because this copyin takes place during the critical path of a transaction 7 . On the other hand, the copying required by the Separate Safe can reduce data contention because copying is considerably shorter than disk I/O and the page must be read locked during this time to ensure that a consistent copy of the page is written to disk. For brevity, we will assume a Separate Safe for this paper. An analysis which includes the Integrated Safe may be found in [Cop88]. l
2.3 Assumptions About Technology The technology estimates relevant to this report concern DRAM (dynamic RAM) cost, standby power and active power, processor active power, disk cost, speed and active power, and UPS cost, power and energy. In Figure 2.3, we provide estimates for both 1987 and 1993 for the sake of comparison. In particular, notice the rapid rate of decline of DRAM standby power IFuj86, Ohs87, Saw88], a trend which favors a Safe RAM approach. We arrived at these estimates by simple extrapolation from historical trends and from various popular periodicals. We have pessimistically assumed that UPS costs will remain constant. The purpose of these numbers is not to make accurate predictions about technology. Instead, we use them to roughly calibrate various curves and provide ballpark estimates for several parameters. The conclusions that we draw in this paper are not highly sensitive to the accuracy of these estimates and our calculations can easily be redone by the reader with different technology characterizations and cost estimates as they become available. 2.4 Cost Of Safe RAM In this section, we estimate the cost of the Separate Safe physical realization in both 1987 and 1993. We define the Safe as cost-effective if it can improve throughput by at least some CostRatio (ratio of system cost with Safe to without Safe) without increasing response time. For example, we determine later that the CostRatio is 1.043 for the Separate Safe realization This means that to be using 1987 technology. a Safe would have to increase cost-effective, throughput by more than 4.3%, without sacrificing response time. The CostRatios that we calculate in this section are pessimistically high because of the following assumptions:
- 329 -
DRAM
cost/Mbyte standby power active power
$SOO/Mbyte 2wattlMbyte lOwatts
$25lMbyte lOwatt/Gbyte lOwatts
micro
active power
Swath
Swatts
time of power extra batteries
20min (1200sec) 1 $0. S/Kwatt-set
IXOCBSSOT
UPS
20min (1200sec) 1 $0. S/Kwatt-set
Figure 2.3: Technology Assumptions We assume a single disk system. The required Safe size for n disks is significantly smaller than n times the size required for one disk. We only include disk in the base cost. Including processor and memory in the base cost would reduce the CostRatio required to make Safe RAM cost-effective. 9 We include a large memory size in the standby power requirements of the Integrated Safe. The UPS power requirements for RAM standby power is proportional to the RAM size. Only a very small percentage of the UPS energy is actually required to support Safe RAM, but we include the full cost of this unused energy in the CostRatio. For the Separate Safe in 1987, the power required is about 116 watts, including a 100 watt disk, a 5 watt microprocessor, a DRAM with active power of 10 watts, and 100 2-Kbyte pages of Safe DRAM at 2 watt/Mbyte for standby power (0.4 watts). The time to write 100 sector-sized pages of Safe at 0.026 set/access is 2.6 set (assuming random writes to sectors). This is only about 0.2% of the energy capacity of the UPS, so that no additional battery energy is needed. This results in $116 worth of UPS. The additional RAM cost for the Safe would be $100. Thus, the total additional cost for the Safe is about $216. Because disk cost is $5,000, the CostRatio is 1.043. For the Separate Safe in 1993, the power required is about 65 watts, including a 50 watt disk, a 5 watt microprocessor, a DRAM with active power of 10 watts, and 100 2-Kbyte pages of Safe DRAM at 10 watt/Gbyte for standby power (0.002 watts). The time to write 100 sector-sized pages of Safe at 0.0 16 set/access is 1.6 set (assuming random writes to sectors). This is only about 0.1% of the energy capacity of the UPS, so that no additional battery energy is needed. This results in $65 worth of UPS. The additional RAM cost for the Safe would be $5. Thus, the total additional cost for the l
l
l
Safe is about $70. Because disk cost is $2,000, the CostRatio is 1.035. Obviously, even for today’s technology, only a negligible improvement in throughput is required to recover the dollar cost of Safe RAM because the dollar cost is so small.
3 History Of Reliable Updates Techniques In this section, we summarize the historical evolution of conventional techniques for reliable updates and show how they can be easily extended to use Safe RAM. In the simplest technique for reliable updates, a transaction reads pages from the public database and updates copies of the pages in the cache or a local workspace. When the transaction is ready to commit, a log of the updates is forced to disk, denoting the commit point. Then, the updated database pages are forced to disk to reflect the transaction-consistent state. The disk I/OS in the critical path of each in this simple technique transaction can be characterized by three variables: 9 Dr: the number of read I/OS for pages that were not in the cache (and I/O for temporary data) ; 9 Dw: the number of write I/OS for pages containing reliable updates; Dl: the number of log I/OS of reliable updates at commit time. Some pages are read only once and discovered in cache by subsequent transactions, which amortizes reads. In the simple technique, a page may be overwritten on disk many times if that page is updated by many transactions. Many techniques have been proposed to amortize the writes over many transactions. Two such techniques are checkpointing (CP) which amortizes data writes, and group commit (GC) which amortizes log writes. In CP techniques [Gra78, Hae83, Moh89], only the log is forced to disk at commit time of the transaction. A database page is written to disk only when that page is swapped out by the cache-replacement algorithm. As a result, a database page may be written to disk only once after many updates. To recover from failure, the system must reconstruct a consistent state of the database using the log. To avoid a recovery having to go arbitrarily far back in the log, checkpointing is periodically done, wherein all the updated pages still in the cache are forced to disk at the end of a checkpointing interval. This strategy incurs the following I/OS in the critical path of each transaction: 1) Dr, 2) Dw’ (I/O for swapping out dirty pages for allocating memory for later transactions), 3) Dl, and 4) checkpointing overhead. Due to cache locality, Dw’ is usually smaller than Dw (for the simple technique) and checkpointing overhead is amortized over many transactions. While checkpointing reduces the I/O for reliable updates, the data writes still lie in the critical path of some later transaction, because the cache-replacement algorithm will write pages out to allocate memory for later transactions. Thus, every l
- 330 -
write of an updated page is done in the critical path of some transaction. After reducing the number of read and write I/OS per transaction via caching and checkpointing (perhaps close to zero for systems supporting memory-resident data), the log I/O cost becomes significant. In GC techniques [DeW84, Gaw85, Moh89], transactions are held up until a full log page can be written or a timeout occurs. Thus, the log write is amortized over a group of transactions. This strategy incurs the following I/OS in the critical path of each transaction: 1) Dr, 2) Dw’, 3) Dl’, and 4) checkpointing overhead. Dl’ is usually less than Dl (in the simple and CP techniques), because the logs are amortized over several transactions. Further, a log I/O still lies in the critical path of each transaction, data I/OS still lie in the critical path of some later transaction, and each transaction is also held up for a period of time (waiting to commit) in its critical path. Consequently, the response time of each transaction reflects these I/O and waiting overheads. Recall that in both the CP and GC techniques, dirty data pages are written out to disk by the cache-replacement algorithm to reallocate memory during the critical path of some later transaction. Alternatively, spooling can be used to migrate these dirty pages to disk. The advantage of spooling is that the dirty pages are written to disk as a background operation when no read I/O request is pending, instead of during the critical path of some transaction. The GC technique can be extended to use such a spooling mechanism to further improve performance. When this extension is made, checkpointing is usually also further optimized by making a log entry containing system status information (e.g., which pages are “dirty” and the status of transactions) instead of actually flushing the updated (dirty) pages, because spooling will keep the updated pages young enough so that a recovery does not have to go very far back in the log. We consider Safe RAM a natural next step in this migration toward improved performance. Although Safe RAM may eventually influence the design of recovery algorithms, the use of Safe RAM does not necessarily require changing existing recovery algorithms provided that the Safe is treated the same as disk. Safe RAM can productively be used in conjunction with the most efficient conventional reliable update techniques (e.g., GC with spooling). In Sections 4 and 5, we compare the performance impact of Safe RAM on GC with spooling. In this context, the advantage of Safe RAM is that amortizing log writes via grouping does not cause a delay in commit times. This removes the log writes from the critical path of transactions. We quantify when this justifies the cost of Safe RAM.
4 Modeling This section provides guidelines for the size of the Safe and provides equations for throughput and response time, which we use in Section 5 to show cost-effectiveness. We compare the best of the conventional reliable update techniques (e.g., GC with
spooling) with and without the Safe. Throughout this section, we assume that the disk is the system bottleneck. We also make a number of assumptions, which we refer to as “pessimistic assumptions”, that have a negative effect on the performance model for Safe RAM (e.g., overestimating the required size of the Safe and underestimating its improvements in response time and throughput). As a result, we get a lower bound for the improvement using Safe RAM, so that our cost-effectiveness argument is conservative. 4.1 Size of Safe We are interested in determining the required size of the Safe given disk loading and how the load is made up of reads and writes. We will do this by defining two metrics, the mean time to overflow the Safe (MTTO) and the mean time to recover from the overflow (MTTR), and then, for given loads and Safe sizes, determining these means and seeing if they are acceptable. We show that even under extremely pessimistic assumptions, a moderate-sized Safe results in acceptable MTTO and M’ITR. We model the system by a single M/M/l queue, making the following pessimistic assumptions in order to guarantee that the calculated MTTO will be far smaller than would be observed in an actual implementation: l All disk I/OS are writes. The higher the proportion of reads to writes, the smaller the Safe needs to be. (If all disk I/OS were reads, then no Safe would be required.) l Disk service times are exponentially distributed. This distribution has a variance higher than usually encountered in disk systems, resulting in longer queue length distributions (and thus a shorter M-I-TO). For simplicity, we assume Poisson arrival rates. We assume a Safe of k pages (capable of holding k writes) and arrival and service rates characterized by means X and 1. The probability of having exactly k writes in the queue is (1-p)pk where p=X/c~, the average utilization [Kle76]. The steady-state probability of having more than k writes in the queue (an overflowed Safe) is simply pk+l . The probability of having k or fewer writes in the queue is l-pk+l . The average rate at which the Safe overflows is a full Safe given that we x Prob [ started with a non-full Safe3 k writes in the queue given that we = X Prob started with< k writes in the queue I
The mean time between overflows is the inverse, or MTTO = l/p
lmpk+l
(l-p)pk+l
*
- 331 -
Similarly, the mean rate at which the system exits the overflow state is having k+l writes in the queue given that l.t Prob we started with k writes in the aueue I
= (bpjF .
The inverse yields MTTR,
or
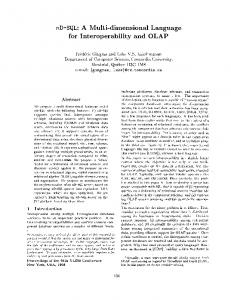
MTTR=$& Notice that MTTR is independent of k. Figure 4.1 illustrates how MTTO (plotted on a log scale) depends exponentially on p for a given Safe size of k. We use a mean disk service time of 1/1.t= 26 msec for the plot. Note that for even (unrealistically) high disk utilizations (e.g., 0.90), the pessimistic bound of MTTO yields 10,800 set = 3.0 hours for k=lOO. The bound of MTTR for this case is 0.26 sec. To summarize this extreme example, if one implemented this system and ran an exclusively write workload on an overutilized disk with mean utilization of 90%, then one could expect a 100 page Safe to require writes to be forced to disk instead of the Safe for 0.26 see once every 3 hours. elC&
ek
e4
F
e2 I
\
.... minute
tl
.60
I
I
I
I
I
L
-65
.70
.75
.80
.85
.90
Fig
4.1: MPan Time to Overflow the Safe
4.2 Performance Model This section develops the throughput and response time equations with and without Safe RAM. We assume the following: l Only disk I/O is included in our throughput and Processor delays are response time equations. assumed to be negligible. . The logs of G (G>l) transactions are grouped into one page. l Reliable writes are spooled for both the Safe and non-Safe case. We assume these spooled writes are removed from the critical path of any transaction.
This assumption is justified by the short length of the spooling queue described in Section 4.1 and by the fact that these pages will have recently-used cache status at the time they are put into the queue. These writes are nonpreemptive, so that the foreground queue must wait on any spooling I/OS which have already begun. There is a single database disk characterized by service rate l.~ and utilization p. There is a single log disk characterized only by service rate l.t. Safe RAM never requires waiting for the log write, so that this response time delay is eliminated and a high log-disk utilization can be Without Safe RAM, we optimistically tolerated. assume that the log disk is never the system bottleneck and has low enough utilization so that its response time equals its service time of 11l.t. We also optimistically assume that a log write can be accomplished in a single I/O, regardless of how large Dw and G are. These optimistic assumptions are correspondingly pessimistic for Safe RAM. 9 For simplicity, we ignore any checkpointing overhead, which is typically quite small. When Safe RAM is not used for either disk, the commit time of multiple (G) transactions are delayed for a group commit, so that their logs can be written to the log disk with a single log write. We assume each transaction causes a total of D disk I/OS to the database disk, so that the maximum number of transactions per second without Safe RAM is l
l
TpSo = h - h.k nl-l’ where po is the database-disk utilization without the Safe. The Dr reads are placed in the database disk’s foreground queue, the Dw writes are placed in the database disk’s spooling queue, and the log writes are placed in the log disk’s foreground queue. Thus, the transaction response time has three terms. First, each transaction must wait on Dr I/OS in the database disk’s foreground queue. The average response time (queue wait plus service) for each of these I/OS is given in [Kle76] (Vol. 2, p. 121) as
+$ft
l/CL'
where pr=EQ-, is the disk utilization due to the foreground queue. Secondly, each transaction must wait on the other transactions in its group. This average group delay lies within the range:
+&oW)
= -$
(G-1)>-$ (G-1).
The first expression assumes that each transaction is delayed for an average of half of the average inter-arrival time of G-l transactions (we assume the last transaction does not have to wait). The second expression assumes that each transaction is delayed for an average of half of the burst-service time of G-l transactions. We use the second expression for group delay because it is lower and thus is pessimistic for Safe RAM (i.e., it underestimates the savings due to Safe RAM).
- 332 -
Thirdly, each transaction must then wait on the hlp, write in the log disk’s foreground queue, whicli WC: assume is l/k.. As a result, the average ~ranSlc~ifJrl response time yithout Safe RAM is
When Safe RAM is used for both data and log disks, the logs of multiple (G) transactions are grouped within the Safe containing the log disk’s spooling queue, so that they can later be written to the log disk with a single log write, but without requiring the commit time of any transaction to be delayed. Each transaction causes a total of D I/OS to the database disk, so that maximum TPS with Safe RAM is -I-PC& = .+L - iti!i - D ’ where ps is the database disk utilization with the Safe. The Dr reads are placed in the database disk’s foreground queue, the Dw writes are placed in the database disk’s spooling queue, and the log writes are placed in the log disk’s spooling queue. Thus, each transaction must wait on Dr I/OS in the database disk’s foreground queue. This is described by the first term in RTo, except that ps is used instead of po. Safe RAIM avoids the delays for group commit and log writes (second and third terms in RTo). As a result, RT with Safe RAM is . . RTs
= Dr
.
5 When Is Safe RAM Cost-Effective? In this section, we quantify the performance improvements of Safe RAM and show when it is cost-effective. 5.1 Comparison Methodology The performance improvement due to Safe RAM can be applied at different points along the throughput We examine continuum. and response-time throughput ratios (with Safe RAM over without Safe RAM) while constraining the response time with Safe RAM to be at least as good as without it. We also examine response time ratios (without Safe RAM over with Safe RAM) while constraining throughput to be equal. The numerators and denominators of these throughput and response time ratios are chosen to conveniently indicate that Safe RAM is better when either of the ratios is greater than 1. We define RTs I TPSo=TPSs. TPSs’o = -ITPSo RTsSRTo and RTo/s sBTp We define cost-effective to mean that TPSs/o is greater than the CostRatio described in Section 2.4. It is easy to prove that RTo/s>l and TPSs/ozl for all values of Dr, Dw, G and po, and that TPSs/o>l when po CostRatio). We derived TPSs/o and RTo/s analytically and plotted them using the following values:
X
X
The first case is the DebitCredit benchmark without caching [Ano85]. The second case constrains Dr/D to be the same as the first case while decreasing D via caching. The third case constrains D to be the same as the first case while increasing Dr/D. The fourth case constrains Dr/D to be the same as the third case while decreasing D via caching. We use G values of 1 (no grouping) and 4. We varied p. from 0.2 to 0.9 and allowed ps to go as high as 0.9 and 0.7. We included pmz0.9 to represent the upper bound on disk utilization for any system. We also included pmz0.7 to represent systems that require spare disk utilization for other purposes (e.g., disk mirroringt) . 5.2 The Comparison For the case when grouping is not used (G=l) , Figure 5.1 illustrates the effect of Safe RAM on throughput when response time with Safe RAM is constrained to be at least as good as without it. The TPSs/o curves are TPSSIO = pmlpo shown in solid lines for pmz0.9. except when ps is forced to be below pm by the response time constraint. The dashed line shows the 0.7/pocurve. For pmz0.7, the curves are the minimum of the 0.7/p. curve and the solid curves. The higher of the two CostRatios (1.043) is also shown by the dotted line. Figure 5.3 illustrates TPSs/o when grouping is Figures 5.1 and 5.3 illustrate the used (G=4). following: As Dr is reduced (either by reducing Dr directly or by reducing D with Dr/D held constant), the curves come closer to the pmlpo curve, because the response time constraint becomes easier to meet. For G=l and pmz0.9, the (0.3, 0.4) curve is the same as the 0.9/po curve. For G=l and pmzO.7, the (0.3, 0.4) and (0.6, 0.1) curves are the same as the 0.7/po curve. For G=4 and pmzO.9, all but the (6, 1) curve are the same as the 0.9/p. curve. For G=4 and pmz0.7, all of the curves are the same as the 0.71~~ curve. As G is increased, the throughput improvement due to Safe RAM becomes much larger. This is due to the fact that Safe RAM eliminates the delay involved in group commit. . As p. approaches pm, there is less room left for TPS improvement but the RT improvement increases. For the case when grouping is not used (G=l) , Figure 5.2 illustrates the effect of Safe RAM on response time l
l
tFor example if disk mirrorin were used with DebitCredit without caching (first case), &en Dr, Dw and D become: Dr Dw D mode of operation I 3 8 11 during normal operation while one of the disks is out 6 8 14 To support the same arrival rate while one of the disks is out, maximum utilization during normal operation must be reduced lo below 11/14=0.79 in order IO keep utilization while one of the disks is out below 1.0.
- 333 -
with throughput held constant. The RTo/s curves are shown in solid lines for pmz0.9. For pmz0.7, the portion of the curves to the right of the dashed line do not apply. Figure 5.4 illustrates RTo/s when grouping is used (G=4). The advantage of Safe RAM comes from the following: 9 Log writes can be put in a spooling queue in addition to the data writes, so that the single log write is taken This out of the response time’s critical path. advantage diminishes when Dr and p. increase (the foreground queue wait time dominates) or when D and G increase (the group delay dominates). . Response time is not delayed in order to exploit the grouped log writes. This advantage improves as G and D increase (the group delay dominates), and diminishes as Dr and p. increase (the foreground queue wait time dominates). It has been argued that a group commit timeout value is typically much shorter (e.g., 50 to 100 msec) than the required response time (e.g., 1 set), so that Safe RAM provides little advantage. However, in such systems, Safe RAM would allow a much larger G without impacting response time, so that more of the advantages of grouped log writes would be possible. Also, parallel systems often tend to centralize logging to exploit the maximum throughput advantage from group commit without increasing its response time penalty. Safe RAM allows more parallelism for logs, so that the maximum throughput advantage from group commit can be obtained without adding to transaction response time. Our most significant point is: Even with pessimistic assumptions, Safe RAM is cost-effective for systems that support reliable updates and have had to limit disk utilization to achieve adequate response times, provided that Dr is reasonably small. Safe RAM is expected to become increasingly cost-effective in the future because of the following: The CostRatio is expected to decrease in the future because of reduced DRAM standby power and cost per bit and reduced active disk power, even though we assumed that disk unit cost will decrease and UPS cost will be unchanged. . The continuous improvements in DRAM cost per bit will cause caching to substantially increase in the future, so that Dr will decrease. When viewing Figures 5.1 through 5.4, it is useful to recall the assumptions which we have made that are pessimistic for Safe RAM: . The CostRatios were inflated because we included the higher of the two CostRatios in the TPSs/o figures, 9 we assumed a single disk system, we only included disk in the base cost, we include a large memory size in the standby power requirements of the Integrated Safe, 9 we included the full UPS energy cost even though only a tiny percentage of the UPS energy is required to support Safe RAM, and l
l
l
l
1.8
1.8
, \ \ \ \ \\ \\
-
$1.6
(Dr,Dw)
-
s
1.0
1.4
-
1.2
-
1.0 0.2 Fig
0.3
0.4
0.5
0.6
P Through&t
5.1:
0.7
0.8
Improvement
5
0.9
, 0.2
(G=l)
Fig
\\
CostRatio.. I I 0.3 5.3:
0.4
I
I
0.5
0.6
P0 Throughput
\,
I
I
I
0.7
0.8
0.9
Improvement
(G=4)
I
(Dr,W
(Dr,Dw)
J 0.2 Fig
l
l
5.2:
0.3
0.4
Response
0.5
0.6
P0 Time
0.7
0.8
Improvement
0.2
0.9 (G=l)
9 we overestimated the size of the Safe. We assumed that the log disk’s delay without the Safe was a minimal ~/J.Ldue to low utilization (even though a log disk employing Safe RAM could tolerate a very high utilization) and regardless of how large G and D were (even though large G and/or D would cause multiple log writes). The group commit delay was based on burst service time instead of average inter-arrival time.
- 334 -
Fig
5.4:
0.3
0.4
Response
0.5
0.6
P0 Time
0.7
0.8
Improvement
0.9 (G-4)
The accumulative effect of these assumptions can be quite significant.
6 Some Related Issues This section describes several open issues concerning Safe RAM. We showed that a typical existing UPS has considerably more energy capacity than is required to realize Safe RAM. (The energy requirements of Safe
RAM could be even further reduced by writing the pages in the Safe to contiguous disk locations during power failure and making the appropriate updates to disk page-mapping tables.) This suggests that a UPS with less energy and lower cost would suffice to realize Safe RAM. In fact, a large-capacitance power supply might suffice. Otherwise, the excess energy could be used to keep memory alive during power outage, so that subsequent disk reads of the data that was in memory at the time of power failure are unnecessary. The most cost-effective amount of energy for such higher availability could be calculated using an analysis similar to the S-minute rule [Gra87] to trade off UPS energy cost for disk arm cost. Further, the excess energy could be used to keep the entire system alive during power outage to increase availability. An interesting variation of the Separate Safe physical realization is the Controller Safe, which includes the Safe within the disk controller. This realization would allow today’s systems which do not use group commit and which support reliable updates to plug in such a disk controller transparently to the rest of the system to achieve performance improvements. For the Integrated Safe realization with a large cache, a separate spooling queue for cache-resident data (i.e., fixed in memory) with lower priority than the disk-resident data (i.e., subject to LRU swapping) has two advantages. One advantage is a significant reduction in the size of the spooling queue, because the separate spooling queue for cache-resident data can consist of pointers to cache-resident pages instead of the pages themselves. A second advantage is more efficient buffer management. Cache-resident data requires cache space anyway, whereas disk-resident data needs to be written out as early as possible to avoid being allocated by the LRU mechanism, which would cause a disk I/O during the critical path of some later transaction.
7 Summary We argued the feasibility of Safe RAM using conventional technologies and estimated the additional cost required in both 1987 and 1993 using a physical realization called Separate Safe. We then described how Safe RAM can be used in conjunction with the most efficient conventional recovery techniques for Finally, we quantified the improved performance. performance effect of Safe RAM and described how, even with very pessimistic assumptions, Safe RAM is cost-effective today for systems that support reliable updates and have had to limit disk utilization to achieve adequate response times, provided that there are a reasonably small number of disk reads per transaction. Even though we assumed that disk unit cost will decrease and UPS cost will be unchanged, we showed how Safe RAM will be increasingly cost-effective in the future because caching will increase (due to DRAM cost per bit improvements) and because DRAM standby power and disk active power will decrease.
- 335 -
Acknowledgements Thanks to Jim Gray for his encouragement helpful suggestions.
and
References [Ano85] Anon. et al, “A Measure of Transaction Processing Power,” Datamation (April 1 1985). [Be1881 J. Bell, private communications concerning experience as a Field Engineer and a Quality Assurance Manager (19 8 8). [Cop881 G. Copeland, R. Krishnamurthy and M. Smith, “The Case For Safe RAM,” MCC Technical Report No. ACA-ST-080-88 (February 1988). [Dew841 D.J. Dewitt, R.H. Katz, F. Olken, L.D. Shapiro, M.R. Stonebraker and D. Wood, “Implementation Techniques for Main Memory Database Systems,” Proceedings of the ACM SIGMOD Conference on Management of Data, Boston (June 1984). [Fuj86] S. Fujii et al, “A 50-J.LA Standby lMx1/256Kx4 CMOS DRAM With High-Speed Sense Amplifier,” IEEE Journal of Solid-State Circuits, Vol. 21, No. 5 (October 1986). [Gaw85] D. Gawlick and D. Kinkade, “Varieties of Concurrency Control in IMS/VS Fast Path,” IEEE Quarterly Bulletin on Database Engineering, Vol. 8, No. 2 (June 1985). [Gra78] J.N. Gray, “Notes on Database Operating Systems, ” in Operating Systems: An Advanced Course, Springer-Verlag, New York (1978). [Gra87] J.N. Gray and F. Putzolu, “The 5 Minute Rule for Trading Memory for Disc Accesses and the 10 Byte Rule for Trading Memory for CPU Time,” Proceedings of the ACM SIGMOD Conference on Management of Data, San Francisco (May 1987). [Hae83] T. Haerder and A. Reuter, “Principles of Transaction-Oriented Database Recovery,” ACM Computing Surveys, Vol. 15, No. 4 (December 1983). [Kat78] J.A. Katzman, “A Fault-Tolerant Computing System,” Proceedings of the Eleventh Hawaii Conference on System Sciences (January 1978). [Kle76] L. Kleinrock, Queueing Systems, Volume 1: Theory, and Queueing Systems, Volume 2: Computer Applications, John Wiley & Sons, New York (1976). [Moh89] C. Mohan, D. Haderle, B. Linsay, H. Pirahesh and P. Schwarz, “ARIES: A Transaction Recovery Method Supporting Fine-Granularity Locking And Partial Rollbacks Using Write-Ahead Logging, ” IBM Research Report RJ6649 (January 1989). [Ohs871 T. Ohsawa et al, “A 60-ns 4-Mbit CMOS DRAM With Built-In Self-Test Function,” IEEE Journal of Solid-State Circuits, Vol. 22, No. 5 (October 1987). [Saw881 K. Sawada et al, “A 30-l.tA Data-Retention Pseudostatic RAM With Virtually Static RAM Mode,” IEEE Journal of Solid-State Circuits, Vol. 23, No. 1 (February 1988).
- 336 -