Proceedings of the 34th Hawaii International Conference on System Sciences - 2001
The Challenge of Accurate Software Project Status Reporting: A Two Stage Model Incorporating Status Errors and Reporting Bias Andrew P. Snow Department of Computer Information Systems Georgia State University, P.O. Box 4015 Atlanta, GA 30302-4015 (404) 651-0879
[email protected] Abstract Project managers perceive and report project status. Recognizing that their status perceptions might be wrong and that they may not faithfully report what they believe, leads to a natural question – how different is true software project status from reported status? Here, we construct a two-stage model which accounts for project manager errors in perception and bias that might be applied before reporting status to executives. We call the combined effect of errors in perception and bias, project status distortion. The probabilistic model has roots in information theory and uses discrete project status from traffic light reporting. The true status of projects of varying risk were elicited from a panel of five experts, and formed the model input. Key findings suggest that executives should be skeptical of favorable status reports, and that for higher risk projects executives should concentrate on decreasing bias if they are to improve the accuracy of project reporting.
1. Introduction In many cases, software project failures begin with inaccurate status reporting. The purpose of this study was to understand how reported status is impacted by: (1) the accuracy with which project managers can assess the true status of a software project, and (2) the faithfulness with which the perceived status is then communicated upward to executive management. Since both accuracy and faithfulness can affect the reported status of a project, the obvious research question is which of these variables has the greatest impact on the distortion of project status information received by senior executives. Ascertaining the true status of a software project is often something easier said than done. At the project
Mark Keil Department of Computer Information Systems Georgia State University, P.O. Box 4015 Atlanta, GA 30302-4015 (404) 651-3830
[email protected] manager level, the perception of project status is influenced by whatever project management systems are in place to track project status as well as the perceptions and opinions expressed by those working under the project manager’s direction. In many instances, a project manager may misperceive the true status of a project. Although this is a general problem that can occur with any type of project, the literature e.g., [2, 7, 12, 21] suggests that information technology (IT) projects may be particularly challenging in this regard. The intangible nature of software makes it difficult to obtain accurate estimates of the proportion of work completed, which may promote misperceptions regarding project status. If the project manager cannot always get an accurate picture of the true project status, then how can senior executives within a firm have any hope of obtaining accurate project status information? To make matters worse, project managers may sometimes censor themselves in reporting status, as they actually perceive it. If a project is perceived to be performing poorly, the project manager may withhold this information or misrepresent status to senior management. The net result is that senior managers may often be at the receiving end of status information that has been biased in some fashion. The case of the CONFIRM project (originally estimated at $55.7 million, and cancelled 3.5 years later with expenditures of $125 million) illustrates this point: “On May 1, 1992, AMRIS’ vice-chairperson circulated a letter internally stating that “some people who have been part of CONFIRM RS management did not disclose the true status of the project in a timely manner. This has created more difficult problems—of both business ethics and finance—than would have existed if those people had come forward with accurate information”[17]. The case of CONFIRM is especially interesting because individuals who were close to the project apparently knew
0-7695-0981-9/01 $10.00 (c) 2001 IEEE
1
Proceedings of the 34th Hawaii International Conference on System Sciences - 2001
that there were significant problems, yet senior management claims that it was completely unaware of the project’s true status. There can be no doubt that a significant portion of the $125 million could have been salvaged had top executives been aware of the actual status earlier. Examples such as this one underscore the need to understand not just the accuracy with which projects managers can detect the true status of a project, but also the faithfulness with which the perceived status is transmitted to senior management. The combined effects of project manager misperceptions (errors) and bias in reporting leads to what we call “distortion” in the project status information received by senior executives. We believe that both researchers and practitioners would benefit from a deeper understanding of the impacts of inaccurate project status reporting. It is in this spirit that we explore the challenge of accurate project status reporting using a two-stage model incorporating status errors and reporting bias.
2. Background The intangibility of software means that there are no visible milestones to measure progress as there are for a physical product [1]. According to Zmud [21], “this invisibility is compounded for large software, for which logical complexity cannot be maintained in one person’s mind, and for which development must be partitioned into a number of tasks assigned to different people.” In addition to the problem of intangibility of the software product, IT projects are widely believed to be more difficult to manage because of factors such as “continually changing technology, difficulty of fixing user requirements, and high staff turnover” [18, p. 441]. In addition to the challenges already mentioned, research suggests that software project managers have a tendency to anchor on their initial perceptions, in spite of subsequent pervasive evidence to the contrary [5]. This suggests that once project status is misperceived, it is difficult to correct such errors. Thus, the IT project environment represents a stark contrast with other, more traditional, project environments such as construction, in which project status can be more readily observed. A recent study by Sauer, Liu, and Johnston [18] comparing construction projects and IT projects suggests that “the performance difference across industries is real, that the degree of task certainty is different, and that some of the performance differences may be attributable to organization and management” [18, p. 440]. With complex software projects involving numerous programmers, there is often a tendency to try to obtain status information from each programmer on his/her
particular task, but this can be problematic [6]. Moreover, programmers may have a tendency to hide problems or embarrassing situations [1]. For these and other reasons, obtaining accurate status information on a project remains a challenge for most software project managers. Even when unit coding and testing proceed as planned, unforeseen problems frequently occur during systems integration when interfacing all software and hardware components. Thus, while formal project planning and control mechanisms can certainly be beneficial, the challenge of obtaining accurate status information still remains.
2.1 Traffic Light Reporting While there are a variety of different status reporting techniques in use today, one of the simplest and most useful approaches is known as “traffic light reporting.” Traffic light reporting is a documented method for project management and control that provides a simple and intuitive way of communicating project status [11]. The definitions of what constitute a “Green,” “Yellow,” or “Red,” state can obviously vary from one context to another. In the construction industry, for example, “Green” might be used to indicate that the project is basically on track, that whatever problems exist have less than a 3% impact on schedule or costs, and that the project manager can correct the problems by the next review cycle [11]. “Yellow” might be used to indicate that whatever problems exist are likely to have a 3-5% impact on schedule or costs, and that senior management involvement or resources may be required to correct the problems before the next review cycle [11]. “Red” might be used to indicate that whatever problems exist are likely to have more than a 5% impact on schedule or costs and that senior management involvement is needed to correct the problems before the next review cycle [11]. The exact origins of traffic light reporting are not known, but it is believed to have originated within the construction industry. Its use, however, has spread to other areas including software projects. Within the information technology area, traffic light reporting has been used to rate business partners in terms of their Y2K readiness [20], to communicate the status of individual project tasks for various process improvement projects [9], and to track the vital signs (e.g., scope, schedule, and budget) for IT projects [8].
2.2 Accuracy of Traffic Light Reporting Traffic light reporting provides a simple, but useful, vocabulary for discussing issues of error and bias in
0-7695-0981-9/01 $10.00 (c) 2001 IEEE
2
Proceedings of the 34th Hawaii International Conference on System Sciences - 2001
status reporting. For example, a project may be in “Red” state, but the project manager may inaccurately perceive it to be in a “Yellow” or “Green” state. We refer to such misperceptions as errors. Once the project manager has perceived the project to be in a certain state, there is no guarantee that s/he will faithfully report the perceived state of the project. Instead, the project manager’s reporting may be biased. For example, the project manager may perceive the project to be in a “Yellow” state but may report it as in a “Green” or “Red” state.
3. Research Questions and Two-Stage Model As indicated in the previous sections, past research has highlighted the difficulty in accurately determining the status of a software project. The software project manager must somehow assess whether cost, schedule, and functional/performance objectives are being met in an environment in which lack of project visibility and other factors make it difficult to perform an accurate assessment of true project status. Research has also pointed out that incorrect status is often reported to executives, with severe repercussions [15]. Overly optimistic reporting may cause the executive to continue support of a doomed project, or be surprised by a negative outcome. In some organizations the culture may not tolerate failure, resulting in “good-news” only reporting. The motivation of the project manager might be to live another day, and somehow pull-off success in spite of any current perceived project adversity. One could argue that there is another type of reporting bias, dubbed here as “chicken-little” reporting, where the project is always reported to be in bad shape (i.e., the sky is falling). This bias results from either the overly pessimistic or deliberate reporting of poor status. The motivations for this type reporting might be to acquire organizationally scare resources, or a desire to not oversell a perceived risky project. In this research, we assume that the former type of bias, good-news reporting, is more deleterious to an organization than chicken-little reporting, and therefore deserving of initial research focus. Perhaps an organization’s worst nightmare is an escalating commitment to a failing project [14]. Improper project status assessments and reporting contribute to such unfortunate situations.
3.1 Research Questions The executive view is of interest because of increased awareness of the importance of the organization’s role in individual software project success. The emergence of the Capability Maturity Model (CMM) focuses on
organizational capabilities, rather than on individual projects. So the problem for an organizational executive is to ponder the following questions regarding project status reports: • Does the project manager truly know the status of the software project? • Based upon the project manager’s perception of status, is the perceived status being accurately conveyed? • What are the combined effects of project manager’s status errors and bias in the status ultimately reported? • What distorts reported status the most, project managers’ status errors or reporting biases? • Are these effects different for different risk projects? Answers to these research questions might help organizations enjoy more success in software projects, and form the motivation for the research effort reported in this paper. Project reporting is as subjective as it is quantitative. Although we strive for more insightful metrics against which to measure progress, in the end judgments are made assessing functional/performance achievement against schedule and budget. This is a difficult assessment as in software, function and performance is not often measurable until final systems integration. As indicated earlier, some executives request periodic reporting based upon a discrete status scale, also known as “traffic light reporting,” wherein the project is reported to be in one of three states: “Green”, “Yellow”, or “Red”. In such a system, project managers distill all project factors into a discrete judgment on project status, for executive consumption. The executive receives a multi-project report, where each project status is reported as a color. We speculate that the executive acts on this information from an exception management perspective: the executive gives cursory attention to Green projects, asks questions of the Yellow projects, and scrutinizes the Red projects. How the executive reacts and deals with the Yellow and Red status reports probably affects the amount of reporting bias project managers apply to their perceived status in formulating their report. As indicated earlier, the construction literature defines status in a quantitative and qualitative way appropriate for construction projects, where cost and schedule, safety, and quality are assessed in coming to one overall discrete status for a project [10]. These aspects are inappropriate for software, as functionality and performance are the elements sacrificed when cost or schedule is overrun. For the purposes of this research, three project objectives are defined as budget, schedule, and functions/performance.
0-7695-0981-9/01 $10.00 (c) 2001 IEEE
3
Proceedings of the 34th Hawaii International Conference on System Sciences - 2001
The status definitions used are as follows: Green: All three objectives substantially met to date Yellow: Two objectives substantially met to date Red: Less than two objectives substantially met to date Other definitions are possible, such as including percent overrun parameters for cost or schedule. Also, percentage of functions or performance could also be incorporated.
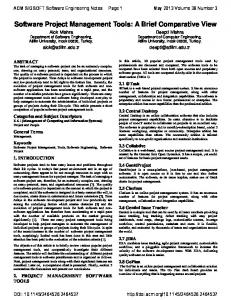
3.2 Two Stage Model Not only is discrete project status relevant, it is also convenient in that tractable models of project status reporting can be constructed. Project status is undoubtedly continuous over time, however periodic discrete state reporting offers an opportunity to consider Markov process and information theoretic approaches. Such an approach is depicted in Figure 1. In this model there are three project statuses, each of which is a random variable: True status (T), Perceived status (P), and Reported status (R). The true status is the actual project status, the perceived status is what the project manager believes to be the status, and the reported status is what the project manger tells the executive. The true status might be difficult for the project manger to ascertain, and subject to error. Likewise, the reported status is prone to any bias which, if present, the project manager applies to the perceived status. So in this model, true status is periodically reported, subject to misperceptions and bias. The degree to which the reported status is different from reported status we call reporting distortion. The selected model is a cascaded information channel, where the possible input alphabet (G,Y,R) is subjected, in turn, to two different noise channels. The input alphabet passes through an error channel, and the intermediately received alphabet then passes through a bias channel. Necessary assumptions for this model are: 1. Project manager errors and bias are independent 2. The discrete true project status probabilities are invariant 3. The error and bias channel characteristics are invariant Regarding Assumption 1, there is no reason to believe that a project manager’s tendency to make a mistake in status is related to how the perceived status is reported. Therefore, it is reasonable to assume that project manager errors and bias are independent. T
P ERROR (E )
R BIAS (B)
Figure 1. Two-Stage Status Reporting Model
Assumption 2 means that the chance of a project being in a particular state does not change over time. Clearly, such an assumption would not be expected to hold for the entire duration of a project. However, when we examine a portion of the lifecycle, it is reasonable to assume that the chance of a project being in a particular state is constant. In making such an assumption, we do not mean to suggest that project managers are passive observers of project state information. Rather, project managers operate in a dynamic environment [19] in which they monitor project status and take corrective actions. Under our model, the true state probabilities for a particular reporting period are influenced only by the actual state that a project was in during the previous reporting period (a first-order Markov process). This seems reasonable, considering an example: if a project is truly green, the next state is related to the fact that the project was most recently Green. Regarding Assumption 3, we again argue that for a portion of the life cycle, it is reasonable to expect error and bias levels to be constant. Clearly, over the entire duration of a project, the tendency for misperceptions and biasing may change. This is so because in the early stages of project, “much of the work is in unverified stages and the cumulative extent of its contribution to he final product is not clear” [19, p. 179]. The implication is that accurate project status is difficult to obtain and therefore misperceptions regarding true status are more likely to occur during early stages of a project as opposed to later stages of a project. Likewise, there is “a tendency of project staff to report favorable information . . . and to withhold unfavorable information” [19, p. 179] during early stages of a project—but such biasing becomes more difficult at end stages of a project because it becomes difficult for the project manager to hide negative information from executive management. However, even though the tendency for errors and biasing may change during the lifecycle of a project, it is unlikely that these changes will occur over the short run. In other words, if we were to restrict ourselves to examining the early phases of development, it is reasonable to assume that project visibility is unchanged throughout this period and that the probability of misperceiving true status is therefore constant. Likewise, any tendency for biasing during this phase of the project is likely to be a function of the organizational climate for reporting and the relationship between a project manager and his/her superiors, neither of which are likely to change over a short period of time. In addition to the assumptions explained above, cursory examination of our model raises the question of whether there are feedback loops from perceived to true status and from reported to perceived status. True state probabilities for a given period are independent of
0-7695-0981-9/01 $10.00 (c) 2001 IEEE
4
Proceedings of the 34th Hawaii International Conference on System Sciences - 2001
perceived state for that period. Likewise, perceived state probabilities for a given period are independent of reported state for that period. The intent of the model is to capture the impact of errors and bias for a given reporting period. Thus, the model is an information theory model, rather than a feedback and control model . In such a system, if we know the input alphabet probabilities (chances of the project being in Green, Yellow, and Red states), the error channel characteristics, and the bias channel characteristics, we may determine a number of things, including: • The probability the project is reported Green • The conditional probability, if reported Green the project is truly Red • The joint probability, the project is truly Red and reported Green These and other closed form analytical results are well known from information theory [13]. In the remainder of this section, we present the model in more detail. For instance, assume random variables T, P, and R take on value ti , p j , and rk , where indices of 1 are Green, 2 Yellow, and 3 Red. We may represent the perceived probabilities as: Pr(p1) = Pr(t1)Pr(p1|t1) + Pr(t2)Pr(p1|t2) + Pr(t3)Pr(p1|t3) Pr(p2) = Pr(t1)Pr(p2|t1) + Pr(t2)Pr(p2|t2) + Pr(t3)Pr(p3|t3) Pr(p3) = Pr(t1)Pr(p3|t1) + Pr(t2)Pr(p3|t2) + Pr(t3)Pr(p3|t3) where the conditional probabilities represent the error channel characteristics. These equations, known as channel equations, may be written in matrix form as P = TE. Similar equations may be written for the bias channel. We may also represent the reported probabilities as R = PB = TEB = TD , where D is the reduction of the error and bias matrices into a single equivalent distortion channel. The elements of D are the conditional probabilities Pr(rk |ti) for which channel equations may also be written. An example of a conditional probability is if the project is reported Yellow, what is the chance the project is Red, and so on. The implications of this model are that given the true frequency of discrete statuses (Green, Yellow, Red) and the error and bias conditional probabilities, we may find the reported frequency of these statuses. The model also allows important joint probabilities to be calculated: Pr( t i , rk ) = Pr(ti) Pr(rk |ti) which allows one to determine the probability of say the project being truly Red and reported as Green, and so on.
4. Research Methodology The software project management environment is one that is complex and challenging [1]. In many cases, significant insights can be gained by constructing models
that allow the researcher to simulate the complexities associated with the software project management environment [2, 3, 4]. In this research, we developed and tested an uncomplicated model based on information theory which allowed us to explore the ramifications of errors and bias in project status reporting. To insure that our results would be meaningful, we interviewed five software project risk experts to determine estimates for true status. In the remainder of this section, we describe our methodology in more detail.
4.1 Combined Effect of Error & Bias: Distortion The basic research model introduced earlier (see Figure 1) consisted of a two stage model incorporating both status errors and reporting bias. As noted earlier, true status is the actual project status, the perceived status is what the project manager believes to be the status, and the reported status is what the project manger tells the executive. The combined effect of status errors and reporting bias result in what we call “distortion”—or the discrepancy between true and reported status. The range of parameters to be investigated using the two-stage model is shown in Figure 2. LOW RISK
HIGH RISK
T
P
R
ERROR (E )
BIAS (B)
ERRORLESS
NO BIAS
ERROR-PRONE
COMPLETE BIAS
Figure 2. Sensitivity Range Investigated The discrete state probabilities (i.e., the chance of being in a Green, Yellow, or Red state) form the inputs to the model. Since these probabilities will likely vary depending upon the risk level of the project, we were interested in examining a range of risk types, including low, medium, and high risk projects. The parameter estimates for true project status (T) which constitute the inputs to the model were obtained from experienced software project risk experts. For each project risk type, the effects of errors in project management perception and project management reporting bias were investigated by performing sensitivity analyses. To test the model’s sensitivity to errors in perception (E), we created various error channels ranging from errorless to error-prone. To test the model’s sensitivity to bias in reporting (B), we created various bias channels ranging from no bias to complete bias.
0-7695-0981-9/01 $10.00 (c) 2001 IEEE
5
Proceedings of the 34th Hawaii International Conference on System Sciences - 2001
4.2 Data Collection To obtain the initial parameter estimates for true status (T), we conducted a field survey of five software project risk experts, each of whom had extensive experience in evaluating the risks associated with software projects. Subjects for the study were solicited through contacts at major management consulting organizations and systems integrators. Software project risk experts were chosen as subjects because of their role in monitoring and assessing the risk level associated with different software projects and because of their ability to gauge the accuracy with which typical software project managers can accurately perceive the true status of a project. We purposely sought out software risk experts rather than project managers to assess true state frequencies. Software project risk experts are a preferred source of information about project risk because they are likely to have more experience and be more objective in their assessment of risk than the average project manager. We wanted true status assessments based upon experience with many projects, rather than a few. This means that those with significant direct project management experience, experience managing project mangers, or experience auditing software projects would be in a better position to assess true status, partly because of exposure to many projects and different situations. Another reason for experts was our concern that if we asked project mangers for true status frequencies, they might actually be providing perceived status, because of errors! As part of the interview protocol, subjects filled out a questionnaire designed to gather such information as the subject’s software project management experience and his/her familiarity with traffic light reporting. The questionnaire was completed interactively with the researchers available to provide any clarification needed by the respondent. Table 1 presents the subject profiles for the respondents included in our study. The model inputs for the present study were collected through telephone interviews. Rather than specifying a precise sample size in advance, we followed the principle of purposive sampling recommended for research that is exploring new ground instead of testing established theories. In contrast to random sampling, purposive sampling calls for collecting data until meaningful patterns and relationships are detected and until “no new information is forthcoming from newly sampled units” [16, p. 202]. We were interested in knowing if the experts would tend to arrive at the same true state probability estimates and after 5 interviews we concluded that the estimates were relatively tightly clustered as evidenced by relatively low standard deviations across the sample.
Each interview lasted approximately one hour. All interviews were taped and later transcribed. The researchers also recorded notes during the interviews. At the outset of each interview, the subject was informed that the purpose of the study was to predict the true project status of low, medium, and high risk software projects. Subjects were told that for the purpose of discussion, projects were to be classified as either low, medium, or high risk. The amount of risk necessary to classify a project as a low, medium, or high risk project, however, was not defined for the subject, but was instead left to the subject’s discretion and opinion. Subjects were told to assume that project status was reported periodically. While the reporting period (e.g., weekly or monthly) was left undefined, subjects were told that it should be appropriate for the scope and duration of the project. Subjects were further told to assume that project status was discrete, namely Green, Yellow, or Red and that this was referred to as “traffic light” reporting. Subjects were given the definitions for Green, Yellow, and Red described earlier. Subjects were then introduced to the two-stage status reporting model described earlier (see Figure 1). Subjects were told that project managers may misperceive project status. For example, true project’s status might be “Green” but the project manager might perceive it to be in a “Yellow” state. Subjects were further instructed to assume that they were making true status predictions for many projects of the same risk type, rather than from a single project and that their status predictions would be constant for no more than 5-10 reporting periods. Table 1. Subject Software Experience Profiles
Subject Profile Years experience in development No. projects participated in Longest project participated (yr.) No. proj. mgr’s superv. at once No. projects personally audited
A
B
C
D
E
35
20
12
>30
20
>20
40
>200
30
2.5
12
15 to 20 2
5
2
20 to 30 >30
8
30
10
>100
5
30 to 40 >300
20
After five interviews were conducted in the manner described above, we had reached the point of diminishing marginal return in terms of new qualitative information and the parameter estimates provided by the subjects seemed to be converging. Qualitatively, the estimates provided by the experts seemed to be tightly clustered. Therefore, a
0-7695-0981-9/01 $10.00 (c) 2001 IEEE
6
Proceedings of the 34th Hawaii International Conference on System Sciences - 2001
decision was made to cease further data collection. The resulting true status predictions for low, medium, and high risk projects are presented and discussed in Section 5.
4.3 Error and Bias Channels The average parameter estimates obtained from the software project risk experts were used as inputs to the two stage model described earlier. A number of different error channels were then constructed to represent the errorless to error-prone channels, as depicted in Table 2. These are symmetric channels, which assume 0, 0.1, 0.3, and 0.5 chance of perceiving Green as Green, Yellow as Yellow, and Red as Red. The error channels were chosen to test a range of error probabilities. The 10% error channel was chosen to represent a low error probability and to discern whether such low probabilities would be significantly different from an environment in which project managers made no errors. At the other extreme, we selected a 50% error channel, representing a coin toss, as this would seem to represent a very high error rate. In addition, we assume it is three times more likely to make a one state error (e.g. Green to Yellow) than a two state error (e.g. Green to Red). Intuitively, two state errors are more improbable than single state errors. Bias channels were also constructed that range from no bias to total bias, as shown in Table 3. In the total bias case, we see that the project is always reported Green, irrespective of perceived status.
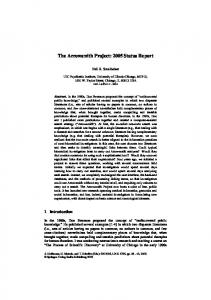
• The low risk project has just over a 50% chance of being truly in the Green state, and about an equal chance of being either Yellow or Red • The medium risk project has about the same chance of being truly Green, Yellow, or Red. • The high risk project is most likely to be truly in the Red state, followed by Yellow and Green, respectively. Table 2. Error Channels Perceived
True
True
True
True
G Y R G Y R G Y R G Y R
E-Channel
R 0 0 1 0.025 0.050 0.900 0.075 0.150 0.700 0.125 0.250 0.500
NONE
10%
30%
50%
Reported
Perceived
Perceived
Perceived
5.1 True Status of Varying Risk Projects Using the protocol outlined in the previous section, true status probabilities were elicited from expert software management subjects. The average elicited true status probabilities are shown in graphical form in Figure 3. These probabilities represent the chance that a project is truly in the Green, Yellow, or Red state during the early stages of the development phase of the software lifecycle. Based on this data, we observe the following:
Y 0 1 0 0.075 0.900 0.075 0.225 0.700 0.225 0.375 0.500 0.375
Table 3. Bias Channels G
Y
R
G
1
0
0
Y R G Y R G Y R G Y R G Y R G Y R
0 0 1 0.2 0.2 1 0.4 0.4 1 0.6 0.6 1 0.8 0.8 1 1 1
1 0 0 0.8 0.4 0 0.6 0.3 0 0.4 0.2 0 0.2 0.1 0 0 0
0 1 0 0 0.4 0 0 0.3 0 0 0.2 0 0 0.1 0 0 0
5. Results and Discussion In this section, we first present and discuss the true status data collected from the subjects. Next, we present and discuss the effect of different error and bias levels on what is reported. Then we present and discuss perceived and reported status of low, medium, and high risk projects. Lastly, we present and discuss the chances of Red projects actually being reported as Red.
G 1 0 0 0.900 0.050 0.025 0.700 0.150 0.075 0.500 0.250 0.125
Perceived
Perceived
Perceived
0-7695-0981-9/01 $10.00 (c) 2001 IEEE
B-Channel NONE
SLIGHT
MODEST
MODERATE
HEAVY
COMPLETE
7
Proceedings of the 34th Hawaii International Conference on System Sciences - 2001
PROBABILITY
ELICITED TRUE STATUS BY PROJECT RISK TYPE 0.6 0.4
GREEN YELLOW
0.2
RED 0 LOW
MEDIUM
HIGH
Figure 3. True Status Results These results are internally consistent in that we would expect high risk projects to be in a Red state more often than medium or low risk projects. Likewise, we would expect low risk projects to be in a Green state more often than medium or high risk projects.
• For high risk projects, project managers are overly optimistic in what they perceive to be the status • For low risk project and 30% error, the error is offset by slight bias, resulting in little reporting distortion These results suggest that reporting distortion is insensitive to a wide range in project manager perception errors, especially as the risk level of the project increases. This interesting result suggests that an executive manager should focus more on ways to reduce reporting bias, rather than on whether the project manager is right in perceiving status, in order to receive a more accurate report.
LOW RISK PROJECT: GREEN STATE 1 0.8
5.2 Effect of Perception Errors For each project risk type, the state probabilities of Figure 3 serve as the input to the model previously introduced in Figure 2. Channel equations were constructed and solved with matrix algebra, and as we show later, the results are self-verifying. Also for each project type, the model was solved for four different error channels, namely the errorless, 10% error, 30% error, and 50% error channels. In addition, each error channel was concatenated with bias channels ranging from no bias to complete bias channels, as described earlier. The remainder of this section presents selected results. To address the earlier posited research question regarding the effect of project management errors versus the effect of bias reporting on reported status, the Green status probabilities are shown for the low and high risk projects, Figures 4 and 5, respectively. On these graphs, B0 represents zero bias, and consequently represent perceived and reported status. B1-B5 represent the varying gradations of bias in Table 3. and represent reported status. From these results we conclude: • With increasing project risk, project manager errors affect reporting bias very little; for the high risk project, status errors do not affect what is reported. • The higher the risk project, the higher the amount of reporting distortion for each incremental increase in bias • At high levels of bias, project manager errors affect reporting very little, irrespective of project risk • For low risk projects, project managers are overly pessimistic in what they perceive to be the status
E0
0.6
E10
0.4
E50
E30
0.2 TRUE
B0
B1
B2
B3
B4
B5
Figure 4. Low Risk Green Project Status
HIGH RISK PROJECT: GREEN STATE
1 0.8
E0
0.6
E10 E30
0.4
E50
0.2 TRUE
B0
B1
B2
B3
B4
B5
Figure 5. High Risk Project Green Status
5.3 Effect of Project Risk Level on Perceived and Reported Status Discussions with experts indicate that the riskier the project, the more error-prone the project manager will be in perceiving project status. The true, perceived and reported status for low, medium, and high risk projects is shown in Figure 6. Here, we have assumed that a low risk project encounters a 10% error channel, a medium risk project a 30% error channel, and a high risk project a 50% error channel, which were introduced in the previous section. Future research will address quantitative expert assessments of errors for different project risks. From these results, we observe that:
0-7695-0981-9/01 $10.00 (c) 2001 IEEE
8
Proceedings of the 34th Hawaii International Conference on System Sciences - 2001
• Project manager perceptions for low and medium risk projects are pessimistic, while perception of high risk projects are optimistic • There is little difference in reported status for medium and high risk projects when bias is introduced The first observation suggests that low and medium risk projects may benefit from the project manager’s sense of pessimism regarding their status. Specifically, this pessimism may trigger more management attention on these projects. Conversely, project managers may be “lulled” into complacency with high risk projects.
These results indicate that Red projects are infrequently reported Red. This may explain why executives are often surprised when projects fail. Indeed, the results indicate that Red projects—those that should be on the executive’s radar screen—are most often reported Green! Interestingly, this type of reporting distortion can occur with only a modest amount of bias. These results strongly suggest that more attention should be given to creating environments where bad news can be reported.
PROJECT RISK COMPARISON (GREEN STATE) LOW E10, MEDIUM E30, HIGH E50
LOW RISK PROJECT - JOINT PROBABILITY WITH 10% ERROR
0.4
1
0.3
0.8 LOW
0.6
MEDIUM
0.4
RED,GRN
0.2
RED,YEL
0.1
RED,RED
HIGH
0
0.2
B0 TRUE
B0
B1
B2
B3
B4
B1
B5
Figure 6. Green Status for Different Risk Projects
B2 B3 CHANNEL
B4
B5
Figure 7. Reporting of Red Low Risk Project
5.4 Chances of Red Projects Being Reported Red Lastly, we present joint probabilities to investigate how a project is reported when it is actually in the Red state. For any channel, the chance of a project actually being in the Red state, and being reported as Green, Yellow, or Red all add up to the chance the project is truly Red (0.22 for low risk and 0.44 for high risk). The chance of a low and high risk project in the Red state being reported as Green, Yellow, or Red is shown in Figures 7 and 8, respectively. These results are self-verifying, as the probability at any point adds up to the truly Red probability. From such results the following observations are made about Red projects: • When the low risk project is Red, it is almost always perceived as Red. • When the high risk project is Red, it is perceived to be Red only about 50% of the time and Yellow about 40% • For each project type, when a project is Red and bias is slight (B1), it is most likely reported Yellow • With even slight bias (B1), there is less than one chance in four that the project is reported Red • For each project type, when a project is Red and bias is modest (B2), it is most likely reported Green and least likely to be reported Red • As the project risk increases, when the project is Red, the chance of being reported as Red decreases
HIGH RISK PROJECT - JOINT PROBABILITY WITH 50% ERROR 0.5 0.4 RED,GRN
0.3
RED,YEL
0.2 RED,RED
0.1 0 B0
B1
B2 B3 CHANNEL
B4
B5
Figure 8. Reporting of Red High Risk Project
6. Conclusions In conclusion, we have introduced a simple model to assess combined effects of project manager misperceptions and bias on project reporting. This combined effect, which we call reporting distortion, is demonstrated to be greater for higher risk projects. We also show that if the goal is accurate reporting, minimizing bias is more important than minimizing project manager misperceptions regarding status. This result is significant because much of the previous literature has focused on traditional project management and control techniques for obtaining accurate status information. What our model
0-7695-0981-9/01 $10.00 (c) 2001 IEEE
9
Proceedings of the 34th Hawaii International Conference on System Sciences - 2001
demonstrates is that more attention needs to be placed on the effect that bias has on reported status. In summary, our research and model results suggest the following: • Traffic light status reporting is commonly encountered in software development, but is little researched • Executives should be skeptical of favorable status reports early in the development cycle • Executives should assess the risk level of individual projects, because the accuracy in reporting decreases with increasing project risk • Both errors (i.e., project managers’ misperceptions of true status) and bias can lead to significant distortion in project status reporting • As the level of project risk increases, the impact of project manager bias completely swamps the impact of errors in explaining the distortion that occurs These results have promising implications for both researchers and practitioners, and offer new insights for improving software project management.
7. References [1] T. Abdel-Hamid and S.E. Madnick, Software Project Dynamics: An Integrated Approach, Englewood Cliffs, NJ: Prentice Hall, 1991. [2] T.K. Abdel-Hamid, "Understanding the '90% Syndrome' in Software Project Management: A Simulation-Based Case Study," The Journal of Systems and Software, vol. 8, no. 4, 1988, pp. 319-330. [3] T.K. Abdel-Hamid, "Investigating the Cost/Schedule Trade-Off in Software Development," IEEE Software, no. January, 1990, pp. 97-105. [4] T.K. Abdel-Hamid and S.E. Madnick, "Lessons Learned from Modeling the Dynamics of Software Development," Communications of the ACM, vol. 32, no. 12, 1989, pp. 1426-1438. [5] T.K. Abdel-Hamid, K. Sengupta, and D. Ronan, "Software Project Control: An Experimental Investigation of Judgment with Fallible Information," IEEE Transactions on Software Engineering, vol. 19, no. 6, 1993, pp. 603-612. [6] W.E. Boebert, "Software Quality Through Software Management," in J.D. Cooper and M.J. Fisher, ed., Software Quality Management, New York: Petrocelli Books, Inc., 1979.
[8] C.V. Brown, "Advantage 2000 at Owens Corning," in E. Wainright Martin, Carol V. Brown, Daniel W. DeHayes, Jeffrey A. Hoffer, and William C. Perkins, ed., Managing Information Technology, Upper Saddle River, NJ: Prentice Hall, 1998, pp. 640-658. [9] R. Burris, Get the Green Light!, The Wight Line, Vol. 7, No. 2, 1994, pp. 6-8. [10] M.T. Chen, "An Innovative Project Report," Cost Engineering, vol. 38, no. 4, 1996, pp. 41-45. [11] C. Coulter, "Multiproject Management and Control," Cost Engineering, vol. 32, no. 10, 1990, pp. 19-24. [12] T. DeMarco, Controlling Software Projects, New York: Yourdon Press, 1982. [13] R.W. Hamming, Coding and Information Theory, Second ed., Englewood Cliffs, NJ: Prentice Hall, 1986. [14] M. Keil, "Pulling the Plug: Software Project Management and the Problem of Project Escalation," MIS Quarterly, vol. 19, no. 4, 1995, pp. 421-447. [15] M. Keil and D. Robey, "Turning Around Troubled Software Projects: An Exploratory Study of the Deescalation of Commitment to Failing Courses of Action," Journal of Management Information Systems, vol. 15, no. 4, 1999, pp. 63-87. [16] Y.S. Lincoln and E.G. Guba, Naturalistic Inquiry, Beverly Hills: Sage Publications, 1985.
[17] E. Oz, "When Professional Standards are Lax: The CONFIRM Failure and Its Lessons," Communications of the ACM, vol. 37, no. 10, 1994, pp. 29-36. [18] C. Sauer, L. Liu, and K. Johnston, "Enterprise-Level Project Management Capabilities: A Comparison of the Construction and IT Services Industries," in Proceedings of International Conference on Information Systems (ICIS), Charlotte, NC, 1999, pp. 440-445. [19] K. Sengupta and T.K. Abdel-Hamid, "The Impact of Unreliable Information on the Management of Software Projects: A Dynamic Decision Perspective," IEEE Transactions on Systems, Man, and Cybernetics, vol. 26, no. 2, 1996, pp. 177-189. [20] B. Zerega, Sears Tackles Y2K Compliance With Partners, InfoWorld, Vol. 20, No. 29, 1998, pp. 16. [21] R.W. Zmud, "Management of Large Software Efforts," MIS Quarterly, vol. 4, no. 2, 1980, pp. 45-55.
[7] F.P. Brooks, The Mythical Man-Month: Essays on Software Engineering, Reading, MA: Addison-Wesley, 1975.
0-7695-0981-9/01 $10.00 (c) 2001 IEEE
10