which are free from the constraint of the BBB, are the pituitary gland and the choroid plexus. ... (matrix size = 128x128~25) and Tld,. Gd volume transfer constant ...
The Choroid Plexus as an Internal Reference for Quantitative in Brain Tumors
Permeability Studies
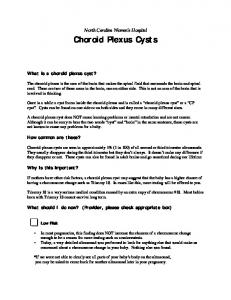
X.P. Zhu, A. Jackson, K.L. Li Division of Imaging Science and Biomedical Engineering (ISBE), Stopford Medical School, University of Manchester. Manchester, Ml3 9PT, UK, zxp@svl,smb,man.ac.uk Introduction One of major difficulties in using quantitative gadolinium enhanced MRI to measure endothelium permeability in brain tumors, where blood brain barrier (BBB) is disrupted, is lack of any internal reference in normal brain tissue. White and gray matter, which are commonly used to provide normal tissue data for perfusion measurements,such as relative blood volume [l], cannot be considered,where the BBB is not permeable to Gd contrast agent (CA). The only intra-cranial areas, which are free from the constraint of the BBB, are the pituitary gland and the choroid plexus. Equipped with epithelium of polar structure similar to kidney[2], the choroid plexus representsan area of selective enhancement,which is always, present within the cranial cavity and which is sufficiently far away from the base of skull to be free from pammagnetic artifacts. The purpose of this study is to examine the feasibility of using choroid plexus as an internal reference material in measuring endothelial permeability in brain tumors with quantitative dynamic MRI. Materials and Methods Six patients with cerebral gliomas were included in the study. All patients were scanned on two occasions with a time interval of 2-5 days. Imaging was performed on a 1.5T ACS Gyroscan NT-PT6000 (Philips Medical Systems).The imaging protocol for dynamic contrast enhanced studies consistedof three consecutive3D Tl-weighted field echo acquisitions (TR=4.3, TE=l.l) with an array of flip angles (a = Z”, 10” and 35’) to allow calculation of Tl maps. The third sequence was then repeated to produce a TlW dynamic data set (Tl& Contrast agent (CA) (0.1 mmol/kg of gadodiamide) was given as a bolus injection. T2* weighted dynamic data (T&J were then acquired using a multi-slice field echo (FE) echo-planar (T2*W-FEEPI) sequence with 60 dynamics acquisitions. A second bolus of 0.1 mmoukg of gadodiamide was given following the 10th dynamic acquisition. CA concentration maps C(x,y,z,i) were calculated from 3D Tl maps (matrix size = 128x128~25) and Tld,. Gd volume transfer constant k (permeability) maps and relative cerebral blood volume (rCBV,,) were generated based on the 4D C(x,y,z,t) data using a leakage profile model [3]. RCBVT2 maps based on susceptibility effect of gadodiamide were also generated from multislice &2*(x,y,z,t) maps (matrix size = 128x128~9, 1.86s), using r variate fitting technique suggestedby Rosen et al [4] with T2 dy Results The upper row of Fig. 1 shows transverse slices of 3D endothelial permeability maps of k from a patient with normal choroid plexus. The bright choroid plexus in both side of lateral ventricles are well depicted with high mean k values from the dark background where white and gray matter has very low permeability. The middle and lower rows of Fig. 1 show rCBV maps obtained from Tl W and T2*W dynamic series. The choroid plexus in the trigones of the lateral ventricles shows higher rCBV than gray and white matters, with values similar to veins.
Fig 2. Changes ink (left) and rCBV (right) between first and second scans
Values of k and rCBVnl, measuredfrom two scansare shown in Fig. 2. K and rCBVnn values were marginally correlated with patient age as shown in Tablel. The differences in mean k between the two scans in the reproducibility study are summarisedin Table 2. The overall differences in mean k and rCBVnn of choroid plexus between the two scanswere 12.1+ 9.0% and 12.2 f 9.0% respectively. Table 1. Correlation between k vs. age, rCBVnl, vs. age. k vs. age 1 Day2
Day 0 R=0.84, P < 0.025
rCBVrl, vs. age Day 0 R=O.71, 0.10 > P > 0.05
R=0.74, P < 0.05
Day 2 R=0.77, P < 0.05
Table 2. Variations of k and rCBVnn between two scans. Mean * sd (mid’) of k
Mean + sd (A.U.) of rCBVml,
Day 0 1 Day2 0.055i 0.017 1 0.062f 0.021 n = 6, f = 0.57, p > 0.05
Day 0 1 Day2 5.49+ 1.80 1 5.30+ 1.38 n=6,t=0.19,p>0.05
Discussion The capillaries of the choroid plexus are fenestrated, unlike those of the brain parenchyma,thus allowing a passageof contrast medium into the choroidal interstitium, which accounts for the enhancementof the choroid plexus normally observed with CT and MRI [3, 51. We have demonstrated that the transfer coefficients k for Gd-DTPA-BMA in choroid plexus (k = 0.059 f 0.012 min.‘, n = 12) are much higher than gray and white matter and are, similar to those measured in the
enhancedrims of high grade gliomas from our patient group [3]. High signal to noise ratio k maps have distinguished choroid plexus from other intra- and extra-cranial organs as a natural marker of leakage of contrast
agents into brain
using dynamic
contrast
enhanced MR
studies. However, contrast enhancementof choroid plexus may be affected by physiological and physio-pathological conditions, such as surgical procedure and chemotherapy [5, 61. We have also found the mean k values of individual choroid plexus measuredfrpm our patient group are also weakly correlated with patient age. It is not appropriate
to use a single k value to representpermeability of choroid plexus as a reference value for dynamic studies. More importantly, this study demonstrates that reproducible measurements of endothelial permeability of choroid plexus can be obtained using current MR techniques. The variations between two scans in an interval of 2-5 days are several times smaller than we would expect from the changes of permeability of tumors in anti-angiogenesistreatment. A similar precision in mean values of rCBV (ArCBV < 12.3%) have been obtained in this study. However, other intra-cranial tissues, such as gray and white matter which are less effected by the low spatial resolution of the parametric maps, can be and have already been used for calibration purpose in many clinical perfusion studies. References1) Hacklander T et al AJNR 1996; 17: 821; 2)Schaner ME, Advanced Drug Delivery Reviews 39:51-62,1999; 3) Li KL et al, submitted to ISMRM2000; 4) Rosen BR et al,. Magn Reson Med 1990; 29:553; 5) Souweidane NM et al, J. of Neuro-Oncologyl999; 43:167; 6) Knauth M et al, AJNR 1999; 20:1547.
Fig 1. Transverse sections from 3D k (upper), rCBV maps calculated from TlW (middle) and T2W (bottom) contrast enhanceddynamic series.
Proc. Intl. Sot. Mag. Reson. Med. 8 (2000)
1969