The Coastcolour project regional algorithm round robin exercise K. Ruddick*a, C. Brockmann†b, R. Doerfferc, Z. Leed, V. Brotase, N. Fomferrab, S. Groomf, H. Krasemannc, V. Martinez-Vicentef, C. Sae, R. Santerg, S. Sathyendranathf, K. Stelzerb, S. Pinnockh a
Management Unit of the North Sea Mathematical Models (MUMM), Royal Belgian Institute for Natural Sciences (RBINS), 100 Gulledelle, Brussels, Belgium b Brockmann Consult, Geesthacht, Germany c GKSS Forschungszentrum, Geesthacht, Germany d Geosystems Research Institute, Mississippi State University e University of Lisbon, Faculty of Sciences, Centro de Oceanografia, Lisbon, Portugal f Plymouth Marine Laboratory, Plymouth, United Kingdom g LISE Adrinord, Wimereux, France h European Space Agency ESRIN, Frascati, Italy
ABSTRACT The MERIS instrument delivers a unique dataset of ocean colour measurements of the coastal zone, at 300m resolution and with a unique spectral band set. The motivation for the Coastcolour project is to fully exploit the potential of the MERIS instrument for remote sensing of the coastal zone. The general objective of the project is to develop, demonstrate, validate and intercompare different processing algorithms for MERIS over a global range of coastal water types in order to identify best practices. In this paper the Coastcolour project is presented in general and the Regional Algorithm Round Robin (RARR) exercise is described in detail. The RARR has the objective of determining the best approach to retrieval of chlorophyll a and other marine products (e.g. Inherent Optical Properties) for each of the Coastcolour coastal water test sites. Benchmark datasets of reflectances at MERIS bands will be distributed to algorithm provider participants for testing of both global (Coastcolour and other) algorithms and site-specific local algorithms. Results from all algorithms will be analysed and compared according to a uniform methodology. Participation of algorithm providers from outside the Coastcolour consortium is encouraged. Keywords: MERIS, ocean colour, coastal waters, algorithm intercomparison, chlorophyll, inherent optical properties
1. INTRODUCTION This paper provides the motivation and a description of the tests that will be performed in the framework of the Coastcolour Regional Algorithm Round Robin (RARR) exercise. Firstly an overview is given of the Coastcolour project as a whole, and of the motivation, scope and objectives for the RARR component of this project. Next a detailed description is given of the tests that will be performed, with information on the various input datasets that will be provided and on the visualisation/intercomparison methods that will be used. Finally some general principles for participation are defined and a timetable is given for the activities, where participation is encouraged from the whole ocean colour community.
*
[email protected]; phone +32 2 773 2131 (for Coastcolour Round Robin enquiries)
†
[email protected]; phone +49 4152 889 301 (for general Coastcolour project enquiries) Remote Sensing of the Coastal Ocean, Land, and Atmosphere Environment, edited by Robert J. Frouin, Hong Rhyong Yoo, Joong-Sun Won, Aiping Feng, Proc. of SPIE Vol. 7858, 785807 · © 2010 SPIE · CCC code: 0277-786X/10/$18 · doi: 10.1117/12.869506 Proc. of SPIE Vol. 7858 785807-1
1.1 The MERIS instrument and the Coastcolour project The importance of the coastal zone for economic activities, and the anthropogenic stresses on the ecosystem, have been described and discussed widely throughout the past 20 years. Responding to this, the European Space Agency (ESA) designed the MERIS instrument1 with a specification covering measurements suitable for coastal zone management and research. Over the last 8 years, MERIS has delivered a unique global dataset of coastal zones at 300m spatial resolution, which deserves dedicated processing with internationally agreed algorithms, and provision of products targeted to specific user needs, properly documented and easily accessible. The European Space Agency has therefore launched the Coastcolour project to fully exploit the potential of the MERIS instrument for remote sensing of the coastal zone. The general objective of the Coastcolour project is to develop, demonstrate, validate and intercompare different processing algorithms for MERIS over a global range of coastal water types, identifying best practices, and promoting discussion of the results in an open, public form. The main results that are expected from the Coastcolour project are:
•
Internationally discussed protocols for coastal water ocean colour data processing including algorithm performance assessment;
•
A global set of MERIS 300m “Full Resolution (FR)” data of coastal zones at a regional scale, processed with best possible algorithms for Level 1, with best possible regional algorithms for water leaving reflectances and Inherent Optical Properties (IOPs), and demonstrating processing of regional higher level specific products; all products should include per pixel error/uncertainty estimates;
•
An international comparison (“Round Robin”) of coastal water algorithms, involving all relevant stakeholders and open to the scientific community;
•
A demonstration of MERIS capabilities for coastal water processing to the international ocean colour radiometry community, and an increase of usage of MERIS within and outside Europe;
•
Preparation of the future exploitation of MERIS and Sentinel 3 products for operational coastal water product applications and for climate change studies.
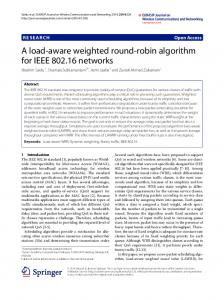
The product requirements for the project have been derived from a user consultation process. A map showing the geographical distribution of the Coastcolour user test sites is given in Figure 1 with a listing of the sites in Table 1. A list of the products requested by the Coastcolour users and which will be provided by the project is given in Table 2. All data will be made available from the project website (http://www.coastcolour.org/), where general information on the project can also be found.
Figure 1. Geographical distribution of the Coastcolour test sites at the time of writing (September 2010).
Proc. of SPIE Vol. 7858 785807-2
Table 1. List of Coastcolour test sites at the time of writing (September 2010).
1 North Sea, English Channel, Bay of Biscay, Celtic Sea 2 Baltic 3 Eastern Mediterranean & Black Sea 4 Morocco (Atlantic and Mediterranean coasts of Morocco) 5 Acadia 6 Chesapeake Bay 7 Oregon and Washington 8 Plumes & Blooms 9 Puerto Rico 10 Benguela 11 China, Korea, Japan 12 Great Barrier Reef 13 Red Sea 14 Indonesian Waters 15 Beibu Bay 16 Namibian Waters 17 Cape Verde 18 Lena Delta and New Siberian Islands 19 Kara Sea 20 Central California 21 French Guyana & Amazon Delta 22 South India 23 Antares-Ubatuba 24 Lake Erie & Lake St. Clair 25 Tasmania
Proc. of SPIE Vol. 7858 785807-3
Table 2. Summary of Coastcolour products.
Acronym
Product
RLw
Directional water leaving radiance reflectance
RLwn
Fully normalized water leaving radiance reflectance
a_total
Total absorption coefficient of all water constituents
b_total
Total scattering or backscattering coefficient
A_pig
Phytoplankton pigment absorption coefficient
A_ys
Yellow substance absorption coefficient
A_poc
Absorption by particulate organic matter
Chl.
Chlorophyll a concentration
TSM
Total suspended matter
kd
Spectral downwelling irradiance attenuation coefficient
Z90_max
Maximal signal depth
Z_eu
Euphotic layer depth
Z_SD
Secchi disc depth
FLH
Fluorescence line height
MCI
Maximum chlorophyll index
TFU
Turbidity in Formazine Units
biomass
Phytoplankton biomass in C units
blooms
Concentration of exceptional phytoplankton blooms
FL
Sun light induced fluorescence
PPP
Potential primary production
1.2 Ocean colour sensors The MERIS ocean colour sensor was launched on ENVISAT by the European Space Agency in 2002 and has been providing data, such as chlorophyll a concentration, for a wide range of applications for both scientific and coastal zone management users, see for example reviews of global monitoring of plankton blooms2 and Belgian coastal applications3. This sensor is part of a first generation of well-supported medium resolution (~1km) ocean colour sensors, which includes notably SeaWiFS (launched 1997) and MODIS-AQUA (launched 2002). Although these three sensors are similar in many respects (polar-orbit, spatial resolution, spectral bands) there are some interesting differences which can be advantageous for certain applications. The longer time series afforded by SeaWiFS allows the study of longer term trends, approaching those necessary for climate change studies4, particularly if combined with data from the Coastal Zone Color Scanner (CZCS, 1978-1986). The tilting mechanism of SeaWiFS5 allows avoidance of sunglint6 which contaminates data for nadir-viewing sensors. The wider swath of MODIS-AQUA (2330km comparable to that of SeaWiFS, but much wider than that of MERIS, 1150km) gives a higher frequency of data, which may be critical for applications in coastal zones where rapid processes must be observed (tidal dynamics, algae blooms) and where cloudiness may significantly reduce data availability. The short wave infrared bands of MODIS-AQUA provide new possibilities for atmospheric correction over turbid waters7
Proc. of SPIE Vol. 7858 785807-4
and the thermal infrared bands provide collocated Sea Surface Temperature information and the possibility of improved cloud detection for the ocean colour products. Particular features of MERIS are the additional spectral information and the enhanced spatial resolution (300m at nadir, “Full Resolution” or FR), possible for all spectral bands. Regarding spectral resolution, the 709nm band is of particular interest and can be used explicitly8 or implicitly9 as a normalisation band for red/near infrared chlorophyll a retrieval algorithms. The enhanced spatial resolution becomes particularly useful for near-shore applications, including within bays, estuaries, inland waters. Indeed coastal zone managers are often most interested in the waters closest to the coast because this is where human impacts and activities are most intense. For example, the European Union’s Water Framework Directive gives priority to monitoring of waters within 1 nautical mile of the coastline. 1.3 Ocean colour data processing A general concept for ocean colour data acquisition and processing is shown in Figure 2, starting from a complete and continuous description (spatial, spectral, directional) of the earth’s radiation field present in nature (NATURE) at the topof-atmosphere (TOA). This field is subsampled temporally, spatially, spectrally, directionally and radiometrically by an ocean colour sensor (SENSOR), yielding, after calibration and geolocation, level 1 (L1) TOA radiance data. The next important data processing step is atmospheric correction (ATMCOR), which yields level 2 radiometric (L2R) data at the bottom of atmosphere, e.g. in the form of a water-leaving reflectance or radiance product. This radiometric data can then be used as input to hydro-optical (WATER) retrieval algorithms to estimate level 2 water (L2W) products, such as chlorophyll a concentration, as needed typically for applications. While there are a few exceptions to this general scheme, e.g. estimation of water products directly from L1 data10, or the combination of atmospheric correction and hydro-optical algorithms11, this general concept has been adopted for the operational processing of, for example, SeaWiFs, MODIS-AQUA and MERIS. 1.4 Objectives, Scope and Precursors of the Coastcolour Regional Algorithm Round Robin The Coastcolour Regional Algorithm Round Robin (RARR) has the objective of determining the best approach to retrieval of chlorophyll a concentration and other marine products from MERIS for the Coastcolour coastal water test sites. The priority is to help users find the algorithm best-suited to their region/application. It is also hoped that the RARR may contribute to a better understanding of the performance of different processing algorithms for coastal waters in a longer-term perspective of maturation of such algorithms. However, it is recognised that the complexity of the coastal water optical inversion problem is such that it is unlikely that the high degree of convergence reached for open ocean water data processing12 will be achieved also for coastal waters. The atmospheric correction step is a critical problem for coastal water processing, where the difficulties of open ocean atmospheric correction - large Rayleigh scattering, highly variable aerosol scattering, low signal:noise in sunglint regions – are compounded by extra difficulties associated with non-zero near infrared water-leaving reflectance in turbid waters 13 and adjacency effects14. An intercomparison of atmospheric correction algorithms has been published recently by the IOCCG15. In order to focus resources on the priority of helping users find the best algorithm/product for their region and to encourage maximal participation from Algorithm Providers, the focus of the Coastcolour RARR is on the WATER algorithms rather than the ATMCOR algorithms. Finally it is noted that differences in the L2W products generated from different ocean colour sensors can originate from the hydro-optical algorithm, the atmospheric correction or the characteristics of the sensor/platform itself. The latter includes instrument radiometric calibration and sensitivity, spectral resolution, viewing geometry, overpass time, etc. Comparison of L2W products generated by different sensors, with different atmospheric correction and hydro-optical algorithms is likely to be inconclusive since it will be difficult to attribute differences in products to a specific element of the ocean colour data processing schematised in Figure 3. A full multi-sensor intercomparison will therefore not be attempted in the Coastcolour RARR, although such a multi-sensor intercomparison may well be carried out for individual test sites in the Coastcolour Validation/User Evaluation activities and certain aspects of multi-sensor comparison, particularly spectral band choice, could be investigated using the Coastcolour RARR simulated dataset.
Proc. of SPIE Vol. 7858 785807-5
Nature Subsampling (temporal, spatial, spectral, directional, radiometric)
Sensor
L1: Ltoa Removal of atmospheric effects
ATMCOR
L2R: Rrs Inversion of marine reflectance
WATER
L2W Figure 2 Schematic of a generic ocean colour data acquisition and processing chain, including an ocean colour sensor (SENSOR), an atmospheric correction algorithm (ATMCOR) and a hydro-optical (WATER) retrieval algorithm. L1:Ltoa denotes level 1 (top of atmosphere) data, L2R:Rrs denotes level 2 radiometeric data (e.g. Remote sensing reflectance) and L2W denotes level 2 water products such as chlorophyll a concentration or Inherent Optical Properties.
Proc. of SPIE Vol. 7858 785807-6
2. ROUND ROBIN DATASETS 2.1 Round Robin design In order to test different aspects of the algorithms, four distinct datasets are being compiled for use in the Coastcolour RARR, called respectively: a) matchup, b) in situ, c) simulated and d) image datasets. The input/output for each of these datasets is summarised in Table 3 and schematised in Figure 3. A detailed description of the purpose and nature of each dataset is given in the following subsections. Table 3 Summary of RARR dataset input and reference output.
RARR Dataset a) Matchups b) In situ c) Simulated d) Images
L1 input MERIS MERIS
a) Matchups
Input
L2R output ref. (In situ, if available)
b) In situ
Nature
Input
L2R input MERIS In situ Simulated MERIS
L2W output ref. In situ In situ Simulation input (none)
d) Images
Nature
Nature
SENSOR
SENSOR
SENSOR
L1: Ltoa
L1: Ltoa
ATCOR
ATCOR
L2R: Rrs
c) Simulated
(Output)
WATER
L2W
Input
Input
ATCOR
Input
L2R: Rrs
L2W
L2R: Rrs
WATER
WATER
Output
L1: Ltoa
Output
L2W
Output
Figure 3: Input/Output schematic for the 4 RARR datasets.
2.2 Matchup dataset The first “matchup” dataset will consist of L1 and L2R Full Resolution 5*5 pixel block inputs from the MERIS sensor as processed by both the standard MEGS processor and the Coastcolour processor. This dataset will be limited to pixels for which an in situ data value for one of the L2W products is available within a time window of ±1 hour around the acquisition moment and for which the corresponding MERIS L2 data is flagged as WATER (not CLOUD or LAND) for all 25 pixels considered. Simultaneous availability of in situ L2R radiometric data is a bonus but not essential, since the primary purpose of this dataset is to test the hydro-optical algorithm and not the atmospheric correction. For the latter, the MERMAID database16 is a more appropriate tool. The outputs to be compared consist of the L2W products for which in situ data are available. This data could be limited to chlorophyll a concentration for some locations/regions or could consist of a number of the products listed in Table 2 for locations/regions where such in situ data is available. Neither the in situ, nor the MEGS/Coastcolour MERIS L2W output products (from MEGS and from Coastcolour) will be distributed at the moment of distribution of the Round Robin Data Package. This avoids a focus on these algorithms at the time of algorithm preparation (“blind test”) and leaving more openness for alternative algorithms.
Proc. of SPIE Vol. 7858 785807-7
2.3 In situ The second “in situ” dataset will consist of L2R (radiometry) inputs from in situ measurements. This dataset does not require corresponding satellite data and is hence much less restrictive in terms of time and year of measurement and cloudiness conditions. It is recognised that marine reflectance data acquired under cloudy conditions is different from marine reflectances acquired under the cloud-free conditions encountered in MERIS data because of a quite different directional distribution of downwelling radiance. Marine reflectance models17, 18 used as basis for WATER algorithms are typically designed for clear sun conditions. However, the effects of cloudiness on marine reflectance data at low to moderate viewing angles is thought to be limited to a few % (with high spectral correlation) – see e.g. Figure 10 of ref 1919. A major difficulty with this input dataset is the combination of L2R data from data providers working with different instruments, protocols, quality control procedures and correspondingly different or even unknown measurement uncertainties. The in situ data available for this dataset is also limited as in situ L2R input data is required for all MERIS bands 1-9 (412-709nm), since the Coastcolour processor uses all these bands. In fact, use of the 709nm information present with MERIS is thought to be important to achieve the full potential of this instrument for turbid coastal waters. Unfortunately in situ radiometry is particularly difficult at 709nm because of the low marine reflectance signal and the particularly large uncertainties associated with vertical extrapolation of underwater radiometric measurements. The input datasets will thus be limited to essentially a few abovewater radiometric measurements from a limited number of data providers. As with the matchup dataset, the outputs to be compared consist of the L2W products for which in situ data are available. This data could be limited to chlorophyll a concentration for some locations/regions or could consist of a number of the products listed in Table 2 for locations/regions where such in situ data is available. The in situ data for available L2W parameters, to be used subsequently as an output reference for algorithm intercomparison, will not be distributed at the time of distribution of the Round Robin Data Package. This helps avoid the tendency to tune algorithms to this reference data and consequent loss of independency. 2.4 Simulated A third “simulated” dataset will consist of L2R inputs for the MERIS sensor as simulated by the HYDROLIGHT radiative transfer model v5.0. This data set is similar to the Synthetic Data Set documented in IOCCG Report 5 20. This dataset will consist of 5000 L2R spectra generated for input data for a vertically homogeneous, infinitely deep water column for a range of conditions of: Non-algae particle (concentration and spectral variation of scattering), Chlorophyll a concentration, CDOM absorption coefficient spectrum. All Hydrolight input files will be supplied ensuring that algorithm participants have full access to the conditions (e.g. inherent optical property spectra) underlying this simulated data set. The HYDROLIGHT simulations will be performed with 1nm spectral resolution. Results will be interpolated to sensor bands MERIS bands 1-14 except 11 (412-885nm except the oxygen absorption band 760nm) and also for SeaWiFS and MODIS-AQUA bands in order to facilitate usage of this dataset in a more general multi-sensor perspective. The MERIS L2W output products will not be distributed at the moment of distribution of the Round Robin Data Package. However, the simulated dataset L2W inputs (chlorophyll a, etc.) will be distributed with the RRDP. Since these will be later used as a reference for the L2W outputs, the tests of simulated data are not blind. 2.5 Images A fourth “image” dataset will consist of MERIS-FR L1 and L2R images, one from each test site. There is no output reference dataset in this case. The purpose of this dataset is to provide a qualitative set of test data covering a wide range of realistic conditions, including sub-optimal conditions such as thin clouds, sunglint, high waves, etc. In particular it may be interesting to consider performance across transects of varying marine and/or atmospheric properties, even in the absence of in situ data. Any or all of the Coastcolour L2W output products listed in Table 2 may be generated from the L1 and L2R input data.
Proc. of SPIE Vol. 7858 785807-8
3. INTERCOMPARISON METHODOLOGY A harmonised presentation of results will be made by Coastcolour for each dataset as described in the following subsections. 3.1 Matchup dataset For the matchup dataset the main analysis will focus on scatterplots of L2W products comparing an individual algorithm against the in situ reference output data, one scatterplot per product and per algorithm (or with grouping of algorithms if this remains legible). For each scatterplot a Reduced Major Axis (RMA) regression analysis will be performed with calculation of the following statistical parameters: r2 coefficient, root-mean-square difference, slope and offset. The regression analysis will be performed in log space since the L2W products are expected to be log-normally distributed in nature. An example of such an analysis is provided in Figure 4.
Figure 4 Example of scatterplot of chlorophyll a concentration estimated from marine reflectance (y-axis) and as measured in situ (x-axis) and regression parameters (prepared by Y. Park).
It is recognised that algorithm or measurement errors may be combination of relative errors (e.g. inappropriate choice of chlorophyll-specific phytoplankton absorption coefficient for a chlorophyll a algorithm), which are well-represented by a log regression, and absolute errors (e.g. detection limit for chlorophyll a estimation in high non-algal particle waters, detection limit for Total Suspended Matter measurement by glass fibre filter technique), which are not. To account for this, both algorithm estimates and measurements below a pre-defined detection limit will be set equal to that detection limit for statistical calculations. In addition to the scatterplots the regression analysis for all algorithms for each product will be presented in tabular form. This table will distinguish between algorithms which process L1 and L2R data. In the case of matchups where marine reflectance has been measured at sea a further series of scatterplots for each wavelength will be made for in situ vs retrieved marine reflectance for any ATMCOR algorithms which are used to process L1 data. As for the L2W products, the statistical analyses will be summarised in a tabular form. It is noted, however, that the Coastcolour RARR is focussed mainly on the L2W products and the L2R outputs are included mainly to determine whether differences in the L2W can be attributed to the ATMCOR or the WATER algorithm.
Proc. of SPIE Vol. 7858 785807-9
3.2 In situ reflectance dataset Scatterplots and associated regression parameters will be presented for this dataset in a similar way to that for the match up dataset of section 3.1, except of course that only L2W products are output. 3.3 Simulated dataset Scatterplots and associated regression parameters will be presented for this dataset in a similar way to that for the match up and in situ reflectance datasets of section 3.1 and 3.2. Algorithms adapted to the bands of sensors other than MERIS can be included here if desired by the Algorithm Providers. 3.4 Images For each image and for each algorithm the following graphical outputs will be provided for each L2W product generated by the algorithm (and for each L2R reflectance band for ATCOR algorithms):
•
A graphical image (e.g. format PNG) file, showing the parameter map.
•
A histogram plot superimposed with the histogram plots from the Coastcolour processor.
•
A scatterplot (intensity coloured since the number of points will be high) of the target algorithm compared to the Coastcolour algorithm with RMA regression statistics.
3.5 Harmonised interpretation of results The Coastcolour Round Robin Data Analysis Work Package Manager (WPM) will gather all graphical and tabular results and provide a general interpretation of the degree of convergence/difference between algorithms as an early draft of the first part of the Round Robin Result Assessment (RRRA). The Algorithm Providers will be asked to provide to the WPM a short conclusion on the performance of their own algorithm as seen in the harmonised analysis. These reports will be added to the RRRA without editing, exception for style and language modifications. The RRDA WPM will then distribute the draft RRRA to all Coastcolour stakeholders (consortium partners, Data Providers, Algorithm Providers, user partners, Science Team, ESA project supervisor) for comment. The RRDA WPM will endeavour to achieve a consensus report in agreement with all authors and in consultation with the Science Team. In the case of minority opinions or lack of consensus on certain aspects these aspects may be moved to an Annex with authorship distinct from the main report. Such Annexes are expected to be short, typically less than one page, or may be longer documents external to the Coastcolour report but referenced by it.
4. ORGANISATION This section describes how the RARR participation will be organised. 4.1 Round Robin participation Participants in the RARR can be classed as Data Providers (DP) or Algorithm Providers (AP) or both. Data Providers are scientists who contribute in situ data for use as input in dataset b (In situ) or reference output in datasets a) (Matchups) or b) (In situ). A single, contact DP will be named for each in situ data following a “Principal Investigator” approach. In situ data will be protected via the Coastcolour Data Policy which data users will be required to sign. Algorithm Providers are scientists who contribute an algorithm for processing these datasets. One contact scientist name is required for each AP. To enable a meaningful analysis to be made of algorithm performance a minimal requirement is application of the algorithm to datasets a) (Matchups), c) (Simulated) and at least one image from dataset d) (Images). It is understood that some algorithms may require spectral bands not available from the dataset b) (In situ). To enable their integration in the RARR, Algorithm Providers are expected to:
Proc. of SPIE Vol. 7858 785807-10
•
Provide to the Coastcolour consortium their algorithm in a reproducible format along with final submission of results in April 2011. The best reproducible format is as a BEAM plug-in, although this may be difficult to achieve for many participants. In that case other methods of specifying the algorithm can be accepted, e.g. a detailed description of the calculations made or formula(e) employed, provided that sufficient information is available to reproduce results and hence to understand fully how algorithm results are related to the algorithm calculations.
•
A first submission of algorithm and results in January 2011 is highly recommended to ensure that any questions regarding formats, datasets, performance problems can be dealt with before the results are finalised. Support will be provided to convert algorithms into the required format for Coastcolour processing.
•
Provide reference documentation in January 2011 describing the algorithm design and calibration and any previous applications of the algorithm. Any aspects that may affect independence of the tests (e.g. previous tuning/validation of the algorithm with part of the RRDP) should be mentioned to allow a correct scientific analysis. This documentation can be short (1-2 pages) and may make reference to published documents. Typically part of this documentation may be included in the final Round Robin Result Assessment, after consultation with the AP.
•
Provide a report to the Coastcolour team in April 2011 describing algorithm performance with sample results from the RARR datasets. It is highly recommended to provide a partial, draft report in January 2011 with a first submission of results to enable any questions regarding formats, datasets, performance problems can be dealt with before the results are finalised.
Algorithms that do not meet these requirements of traceability and reproducibility will not be included in the harmonised RARR data analysis. Non-public algorithms or algorithms where reference documentation is insufficient or not public (e.g. submitted papers) may still receive the RARR Data Package and perform their own tests on it without being included in the harmonised analysis. 4.2 Distribution of Round Robin Data Package – timing and access rights The Round Robin Data Package (RRDP), consisting of the 4 input datasets described in section 2, a product User Guide and the Round Robin Protocol (this document), will be distributed from the Coastcolour web site by FTP in October 2010 with two levels of access: (i) Anonymous public access - The MERIS and simulated datasets will be available by anonymous FTP access. (ii) Password-protected access- The full RRDP, including in situ data which is not the intellectual property of the Coastcolour consortium, will be available by password-protected FTP access to RARR participants that sign an agreement regarding restrictions on usage of the in situ data. Help will be provided via a dedicated email address to participants encountering problems or requiring assistance in use of the RRDP. 4.3 Submission of results Results will be submitted to Coastcolour for one or more of the datasets as follows:
•
Optional submission of algorithm and results in January 2011 with possible draft report of the Algorithm Provider
•
Final submission of algorithm and results in April 2011 with Algorithm Provider report.
4.4 Authorship and revision policy Authorship of the final RRRA will be offered to all who, in the sense of the American Physics Union ethical guidelines [http://www.aps.org/policy/statements/02_2.cfm], have made a “significant contribution to the concept, design, execution or interpretation of the research study”. This includes Algorithm Providers, Data Providers, Coastcolour partners contributing to the RARR and potentially other external contributors.
Proc. of SPIE Vol. 7858 785807-11
Algorithm Providers have the right to modify algorithms until final submission in April 2011. However, any modification of an algorithm from its standard implementation should be documented to ensure transparency of the analysis. After final submission in April 2011, Algorithm Providers no longer have the right to change their algorithm, but do have the right to withdraw the results of their algorithm from the final RRRA, whose authorship will be adapted accordingly. 4.5 Schedule A summary of the timing for the RARR is given in Table 4. Table 4 Timing for RARR activities.
Activity
Timing
Public Distribution of RARR Data Package Widespread Publicity of RARR and Support for APs Optional submission of preliminary results by APs Final submission of algorithm and results by APs Distribution of draft Regional Round Robin Report to stakeholders Discussion of results at final user consultation meeting Finalisation of Regional Round Robin Report
Oct 2010 Oct-Dec 2010 Jan 2011 Apr 2011 Jul 2011 Oct 2011 Dec 2011
5. CONCLUSIONS This paper describes the Regional Algorithm Round Robin that will be carried out in the framework of the Coastcolour project. By comparing the performance of different ocean colour data processing algorithms on the 4 datasets (matchup, in situ, simulated and image) described here, it is hoped to gain understanding into the ways that differences between algorithm give differences between results. This should help users in the various regions to select the best available algorithm/product for their region and may lead to a greater degree of consensus or convergence within the ocean colour community as regards algorithm design for coastal waters. The activity is not limited to Coastcolour partners/users but is open to participation from Algorithm Providers from the whole community subject to the constraint that only fully reproducible algorithms will be included in the harmonised analysis. On completion of the activity, results will be present to the ocean colour community in a harmonised report.
ACKNOWLEDGEMENTS The European Space Agency Data User Element is acknowledged for funding of the Coastcolour project. Coastcolour consultants, Science Team and users are thanked for constructive comments.
REFERENCES [1] [2] [3] [4]
Rast, M., Bézy, J. L., and Bruzzi, S., “The ESA Medium Resolution Imaging Spectrometer, MERIS - a review of the instrument and its mission,” International Journal of Remote Sensing, 20(9), 1681-1702 (1999). Gower, J., King, S., and Gonclaves, P., “Global monitoring of plankton blooms using MERIS MCI,” International Journal of Remote Sensing, 29(21), 6209-6216 (2008). Ruddick, K., Park, Y., Astoreca, R. et al., "Application of the MERIS algal pigment products in Belgian waters", Proceedings of the 2nd MERIS/(A)ATSR workshop ESA SP 666, (2008). Gregg, W. W., and Conkright, M. E., “Decadal changes in global ocean chlorophyll,” Geophysical Research Letters, 29(15), (2002).
Proc. of SPIE Vol. 7858 785807-12
[5] [6] [7] [8] [9] [10] [11] [12] [13] [14] [15] [16] [17] [18] [19] [20]
Hooker, S. B., McClain, C. R., and Holmes, A., “Ocean Color Imaging: CZCS to SeaWiFS,” Marine Technology Society, 27(1), 3-15 (1993). Gregg, W. W., and Patt, F. S., “Assessment of tilt capability for spaceborne global ocean color sensors,” IEEE Transactions on Geoscience and Remote Sensing, 32(4), 866-877 (1994). Wang, M., and Shi, W., “The NIR-SWIR combined atmospheric correction approach for MODIS ocean color data processing,” Optics Express, 15(24), 15722-15733 (2007). Gons, H. J., Rijkeboer, M., and Ruddick, K. G., “Effect of a waveband shift on chlorophyll retrieval from MERIS imagery of inland and coastal waters,” Journal of Plankton Research, 27(1), 125-127 (2005). Schiller, H., and Doerffer, R., “Neural network for emulation of an inverse model operational derivation of Case II water properties from MERIS data,” International Journal of Remote Sensing, 20(9), 1735-1746 (1999). Gower, J., and King, S., "Intense plankton blooms and Sargassum detected by MERIS." Proceedings of the 1st MERIS/(A)ATSR workshop ESA SP 597, (2005). Schroeder, T., Behnert, I., Schaale, M. et al., “Atmospheric Correction algorithm for MERIS above Case-2 waters,” International Journal of Remote Sensing, 28(7), 1469-1486 (2007). O'Reilly, J. E., Maritorena, S., Mitchell, B. G. et al., “Ocean color chlorophyll algorithms for SeaWiFS,” Journal of Geophysical Research, 103(C11), 24937-24953 (1998). Moore, G. F., Aiken, J., and Lavender, S. J., “The atmospheric correction of water colour and the quantitative retrieval of suspended particulate matter in Case II waters: application to MERIS,” International Journal of Remote Sensing, 20(9), 1713-1734 (1999). Santer, R., and Schmechtig, C., “Adjacency effects on water surfaces: primary scattering approximation and sensitivity study,” Applied Optics, 39(3), 361-375 (2000). International Ocean Colour Coordinating Group (IOCCG), "Atmospheric correction for remotely-sensed ocean colour products", IOCCG/SCOR, (2010). Barker, K., Mazeran, C., Lerebourg, C. et al., "MERMAID: the MEris MAtchup In-situ Database", Proceedings of the 2nd MERIS/(A)ATSR workshop ESA SP 666, (2008). Gordon, H. R., and Morel, A. Y., "Remote Assessment of Ocean Color for Interpretation of satellite visible imagery", Springer-Verlag, New York (1983). Morel, A., and Gentili, B., “Diffuse reflectance of oceanic waters II. Bidirectional aspects,” Applied Optics, 32, 6864-6879 (1993). Park, Y., and Ruddick, K., “Model of remote-sensing reflectance including bidirectional effects for case 1 and case 2 waters,” Applied Optics, 44(7), 1236-1249 (2005). International Ocean Colour Coordinating Group (IOCCG), "Remote sensing of Inherent Optical Properties: fundamentals, tests of algorithms and applications", IOCCG, (2006).
Proc. of SPIE Vol. 7858 785807-13