V. Robu, H. La Poutré, S. Bohte is agent-based ... example, the identities of the bidders; for which keyword combinations their ads were shown (i.e. the ..... However, using this technique, Ebay is taken as one advertiser ..... henceforth denoted by Q. Intuitively, any edge that in a given partition, has both ends in the same ...
The Complex Dynamics of Sponsored Search Markets? Valentin Robu? ? ? , Han La Poutr´e, and Sander Bohte CWI, Center for Mathematics and Computer Science Kruislaan 413, NL-1098 SJ Amsterdam, The Netherlands {robu, hlp, sbohte}@cwi.nl
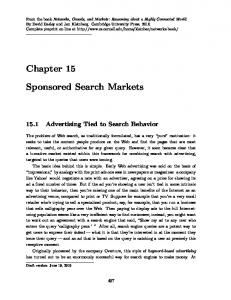
Abstract. This paper provides a comprehensive study of the structure and dynamics of online advertising markets, mostly based on techniques from the emergent discipline of complex systems analysis. First, we look at how the display rank of a URL link influences its click frequency, for both sponsored search and organic search. Second, we study the market structure that emerges from these queries, especially the market share distribution of different advertisers. We show that the sponsored search market is highly concentrated, with less than 5% of all advertisers receiving over 2/3 of the clicks in the market. Furthermore, we show that both the number of ad impressions and the number of clicks follow power law distributions of approximately the same coefficient. However, we find this result does not hold when studying the same distribution of clicks per rank position, which shows considerable variance, most likely due to the way advertisers divide their budget on different keywords. Finally, we turn our attention to how such sponsored search data could be used to provide decision support tools for bidding for combinations of keywords. We provide a method to visualize keywords of interest in graphical form, as well as a method to partition these graphs to obtain desirable subsets of search terms.
Keywords: complex systems, sponsored search, keyword advertising, collaborative filtering, power laws, community detection
1 Introduction Sponsored search, the payment by advertisers for clicks on text-only ads displayed alongside search engine results, has become an important part of the Web. It represents the main source of revenue for large search engines, such as Google; Yahoo!; and Microsoft’s Live.com, and sponsored search is receiving a rapidly increasing share of advertising budgets worldwide. But the problems that arise from sponsored search also present exciting research opportunities, for fields as diverse as economics, artificial intelligence and multi-agent systems. In the field of multi-agent systems, researchers have been working for some time on topics such as designing automated auction bidding strategies in uncertain and competitive environments (e.g. [4, 21]). Another emergent field which studied such topic ??? ?
Currently in the Intelligence, Agents, Multimedia Group, University of Southampton, UK. This work was performed based on a Microft Research “Beyond Search” award. The authors wish to thank Microsoft Research for their support.
Electronic copy available at: http://ssrn.com/abstract=1433030
2
V. Robu, H. La Poutr´e, S. Bohte
is agent-based computational economics (ACE) [15], where significant research effort has focused on the dynamics of electronic markets through agent-based simulations. One particular topic of research for the ACE community is how order and macro-level market structure can emerge from the micro-level actions of individual users. However, most existing work has been based on simulations, as there are few sources of largescale, empirical data from real-world automated markets. In this context, empirical data made available from sponsored search provides an excellent opportunity to test the assumptions made in such models in a real market. In this paper, which is based on large-scale Microsoft sponsored search data, we provide a detailed empirical analysis of such data. To do this, we make use of several techniques derived from computational economics, and especially complex systems theory. Complex systems analysis (which we briefly review below) has been shown to be an excellent tool for analyzing large social, technological and economic systems, including web systems [19, 11, 6].
1.1 The data set The study provided in this paper is based on a large dataset of sponsored search queries, obtained from the website Live.com1. The search data provided consists of two distinct data sets: a set of sponsored search dataset (URLs returned are allocated to advertisers, through an auction mechanism) and an organic search dataset (standard, unbiased web search). The sponsored search data consists of 101,171,081 distinct impressions (i.e. single displays of advertiser links, corresponding to one web query), which in total received 7,822,292 clicks. This sponsored dataset was collected for a roughly 3-month period in the autumn of 2007. The organic search data set consists of 12,251,068 queries, and was collected in a different 3-month interval in 2006 (therefore the two data sets are chronologically disjoint). It is important to stress that in the results reported in this paper are based mostly on the sponsored search data set2 . Furthermore, the sponsored search data we had available only provides partial information, in order to protect the privacy of Microsoft Live.com customers and business partners. For example, we have no information about financial issues, such the prices of different keywords, how much different advertisers bid for these keywords, the budgets they allocate etc. Furthermore, while the database provides an anonymized identifier for each user performing a query, this does not allow us to trace individual users for any length of time. Nevertheless, one can extract a great deal of useful information from the data. For example, the identities of the bidders; for which keyword combinations their ads were shown (i.e. the impressions); for which of these combinations they received a click; the position their sponsored link was in when clicked etc... Insights gained from analyzing this information forms the main topic of this paper. 1 2
This data was kindly provided to us by Microsoft research through “Beyond Search” award The only exception is a plot on the distribution number of clicks vs. display rank in Sect. 3, included for comparison reasons.
Electronic copy available at: http://ssrn.com/abstract=1433030
The Complex Dynamics of Sponsored Search Markets
3
2 Complex systems analysis applied to the web and economics Complex systems represents an emerging research discipline, at the intersection of diverse fields such as AI, economics, multi-agent simulations, but also physics and biology [2]. The general topic of studies in the field of complex systems is how macro-level structure can emerge from individual, micro-level actions performed by a large number of individual agents (such as in an electronic market). For web phenomena, complex systems techniques have been successfully used before to study phenomena such as collaborative tagging [11, 10] or the formation of online social groups [1]. One of the phenomena that are indicative to such complex dynamics is the emergence of scale-free distributions, such as power laws. The emergence of power laws in such a system usually indicates that some sort of complex feedback phenomena (e.g. such as a preferential attachement phenomena) is at work. This is usually one of the criteria used for describing the system as “complex” [2, 6]. Research in disciplines such as econophysics and computational economics discusses how such power laws can emerge in large-scale economic systems (see [6, 19] for a detailed discussion). 2.1 Power laws: definition A power law is a relationship between two scalar quantities x and y of the form: y = cxα
(1)
where α and c are constants characterizing the given power law. Eq. 1 can also be written as: log y = α log x + log c (2) When written in this form, a fundamental property of power laws becomes apparent; when plotted in log-log space, power laws appear as straight lines. As shown by Newman [19] and others, the main parameter that characterizes a power law is its slope parameter α. (On a log-log scale, the constant parameter c only gives the “vertical shift” of the distribution with respect to the y-axis.). Vertical shift can vary significantly between different phenomena measured (in this case, click distributions), which otherwise follow the same dynamics. Furthermore, since the logarithm is applied to both sides of the equation, the size of the parameter α does not depend on the basis chosen for the logarithm (although the shifting constant c is affected). In the log-log plots shown in this paper, we have chosen the basis of the logarithm to be 2, since we found graphs with this low basis the more graphically intuitive. But, in principle, the same conclusions should hold if we choose the logarithm basis to be, e.g. e or 10.
3 Influence of display rank on clicking behavior The first issue that we studied (for both sponsored and organic search data) is how the position that a URL link is displayed in influences its chances of receiving a click. Note that this particular issue has received much attention in existing literature [8]. To briefly explain, Microsoft’s Live.com search interface (from which the data was collected), is structured as follows:
4
V. Robu, H. La Poutr´e, S. Bohte Relative ad position vs. no of clicks (log2−log2 scales)
Relative position of clicked links vs. no of clicks (log2−log2 scales)
23
24 22 Number clicks the link receives
Number of clicks the link receives
22 21 20 19 18
20 18 16 14 12 10 8
17 6
16 0
0.5 1 1.5 2 2.5 Display rank (position) of sponsored link (or ad)
3
4
0
1
2
3
4
5
6
Relative position of clicked link (normal search link, not sponsored)
Fig. 1. Distribution of clicks received by a URL, relative to its position on the display, for sponsored and organic search. A(left-side, sponsored search): There are up to 8 sponsored advertiser links displayed: 3 on the top of the page, and 5 in a side bar. B(right, organic search): There are usually 10 positions displayed per page, with multiple result pages appearing as plateaus.
– For sponsored search there are up to 8 available slots (positions) in which sponsored URL links can be placed. Three of these positions (ranked as 1-3) appear at the top of the page, above the organic search results, but delimited from those by a different background. In addition, the page can display up to 5 additional links in a side bar at the right of the page. – The “organic” search results are usually returned as 10 URL links/page (a user can opt to change this setting, but very few actually do). All the sponsored links are allocated based on an auction-like mechanism between the set of interested advertisers (such a display, in any position is called in “impression”). However, the advertisers only pay if their link actually gets clicked - i.e. “pay per click” model. The exact algorithm used by the engine to determine the winners and which advertiser gets which position is a complex mechanism design problem and not all details are made public. However, in general, it depends on such factors as the price the bidder is willing to pay per click, the relevance of the query to her set of terms, and her past performance in terms of “clickthrough rate” (i.e. how often links of that user were clicked in the past, for a given keyword). By contrast, in organic search, returned results are ranked simply based on relevance to the user’s query. 3.1 Results on display position bias and interpretation Results for the position bias on click distribution are plotted in Fig. 1: part A (left side) for sponsored search and part B (right side) for the organic search. Note that both of these are cumulative distributions: they were obtained by adding the number of clicks for a link in each position, irrespective of the exact context of the queries or links that generated them. Furthermore, both are drawn in the log-log space.
The Complex Dynamics of Sponsored Search Markets
5
There are two main conclusions to be drawn from these pictures. For the sponsored search results (Fig. 1.A), the distribution across the 8 slots seems to resemble a straight line, with a slope parameter aprox. α = 2. However, such a conclusion would be too simplistic: there is, in fact, a difference between the slope between the first 3 positions (up to log2 3, on the horizontal axis), and the last 5 positions. The slope for the first 3 positions is around α1 = 1.4, while for the last 5 is around α2 = 2.5. The most likely reason for this drop comes from the way the Live.com search interface is designed. The first 3 slots for sponsored search links are shown on the top of the page, above the organic search results, while the last 5 are shown in a side bar on the right of the page. Fig. 1.B corresponds to the same plot for organic search results, the main effect one notices is the presence of several levels (thresholds), corresponding to clicks on different search pages. We stress that, since this is a log-log plot, the drop in attention between subsequent search pages is indeed very large - about two orders of magnitude (i.e. the top-ranked link on the second search page is, on average, about 65 times less likely to be clicked than the last-ranked link on the first page). The distribution of intrapage clicks, however, at least for the first page of results, could be roughly approximated by a power law of coefficient α = 1.25. All this raises of course the question: what do these distributions mean and what kind of user behaviour could account for the emergence of such distributions in sponsored search results? First, we should point out that the fact that we find power law distributions in this context is not completely surprising. Such distributions have been observed in many web and social phenomena (to give just one example, in collaborative tagging systems, in the work by one of the co-authors of this paper [11] and others). In fact, any model of “top to bottom” probabilistic attention behaviour, such as a user scanning the list of results from top to bottom and leaving the site with a certain probability by clicking one of them could give rise to such a distribution. Of course, more fine-grained models of user behavior are needed to explaining click behavior in this context (an example of such a model is [8]). But for now we leave this issue to further research, and we look at the main topic of this paper which is examining the structure of the sponsored search market itself.
4 Market structure at the advertiser level In this Section, we look at how sponsored search markets are structured, from the perspective of the participants (i.e. advertisers that buy search slots for their URLs). More specifically, we study how relative market shares are distributed across link-based advertisers. We note that in many markets, an often cited rule, also informally attributed to Pareto, is that 20% of participants in a market (e.g. customers in a marketplace) drive 80% of the activity. Here, we call this effect the “market concentration”. In a sponsored search market, the main “commodity” which produces value for market participants (either advertisers and the search engine) is the number of clicks. Therefore, the first thing that we plotted (first, using normal, i.e. non-logarithmic axes) is the cumulative share of different advertisers (see Fig. 2. A. - left side graph). From
6
V. Robu, H. La Poutr´e, S. Bohte Number of impressions and number of clicks received (log −log scale)
Cumulative share of the click market of highest rated advertisers (%)
2
80 No. of times the URL of the advertiser shown / clicked
70
60
Percentage of total clicks
2
25
50
40
30
20
10
0 0
1000
2000
3000
Advertiser rank by no. of clicks
4000
5000
Impressions Clicks 20
15
10
5
0 0
2
4 6 8 10 Rank of the advertiser (log2 scale)
12
14
Fig. 2. A (left-side): Cumulative percentage distribution of the number of clicks advertisers in the market receive, wrt. to their rank position, considering the top 5000 advertisers in the market (normal scales). B (right): Log-log scale distributions of the number of impressions, respectively number of clicks, received by the top 10000 advertisers in the market. Note that both distributions follow approximately parallel power laws, but the click distributions levels off in a “long tail” after the first 4000 advertisers, while the impression distribution has a much longer tail (not all appearing in the figure).
this graph, one can already see that just the top 500 advertisers get roughly 66% (or about two-thirds) of the total 7.8 million clicks in the available data set3 . Since in our data, there are at least 10000 distinct advertisers (most likely, there are many more, but we only considered the top 10000), this means that a percentage of less than 5% of all advertisers have a two-thirds market share. This suggests that sponsored search markets are indeed very concentrated, perhaps even more so than “traditional” real-world markets. 4.1 Distribution of impressions vs. distribution of clicks for the top advertisers Next, we studied the detailed distribution of the numbers of impressions (i.e. displayed URLs) and clicks on these impressions, for the top 10000 distinct advertisers. Results are shown in Fig. 2.B. (right-hand side graph), using a log-log plot. The main effect that one can see from Fig. 2.B. is that the distribution of impressions and the distribution for clicks received by the advertisers form two approximately parallel, straight lines in the log-log space (i.e. they are two power laws of approximately the same slope coefficient α). There is one important difference, though, which is the size of the “long tail” of the distribution. The distribution of the number of clicks (lower line), levels off after about 4000-5000 positions. Basically, in data terms, this means 3
Note that an advertiser was taken, following the available data, by the domain URL of the sponsored link. This is a reasonable assumption, in this case. For example, Ebay uses many sponsored links to different products. However, using this technique, Ebay is taken as one advertiser, regardless of how many different items its URLs point to.
The Complex Dynamics of Sponsored Search Markets Ranking of advertisers by number of clicks received (log −log scale) 2
2
18
16
14
12
10
8
6 0
Ranking of advertisers by number of clicks received, in total and for different positions 20 Total clicks Position 1 18 Position 2 Position 3 16 Position 4 Position 5 14 Position 6 Position 7 12 Position 8
Number of times links of the advertiser were clicked
No. of times the links were clicked (all positions)
20
2 4 6 8 10 12 Rank of the advertiser by total number of times her links were clicked
7
10 8 6 4 2 0 0
2 4 6 8 10 12 Rank of the advertiser by the number of times her links were clicked
Fig. 3. Distribution of advertiser market share, based on their ordered rank vs. the number of clicks their links receive (log-log scales). The left-hand side plot (part A) gives the total number of clicks an advertiser received for all impressions of her links, regardless of the position they were in. The right-hand side (part B) gives the number of clicks received, both in total, but also when her ads were displayed on a specific position on the page (among the 8 ranked slots of the sponsored search interface).
that advertisers beyond the top 5000 each receive a negligible number of clicks, at least in the dataset we examined. The reason for this may be that their ads almost always appear in the lower display ranks, or simply that they bid on a set of rarely used (or highly specialised) search keywords. By contrast, the distribution of impressions still continues for many more positions (although we only represent the top 10000 distinct advertiser IDs here, as the rest do not play any significant role in the click market).
4.2 Distribution of market share per display rank position The previous Section examined the power law distributions of the number of clicks each advertiser gets in aggregate (i.e. over all display ranks his/her links are shown in). Here, we look how an advertiser’s market share distribution is affected when broken down per display rank (an issue we already touched on in Sect. 3). However, we first make a slight restriction in the number of advertisers we consider. As shown in Sect 4.1 above, there is a power law distribution in the clicks received by the top 4000 advertisers, advertisers ranked beyond this position each receive a negligible number of clicks. Therefore, in this Section, we restrict our attention to the top 4000 advertisers. As these 4000 advertisers receive over 80% of all 7.8 million clicks in the data set (see Fig. 2.A), we do not risk loosing much useful information. Results are shown in Fig. 3. First, in Fig. 3.A. we show again, more clearly, the power law distribution of the number of clicks for the top 4000 advertisers. Note that this is a “wide” distribution, in the sense that it covers 4000 positions and several orders of magnitude. On the right-hand side graph (Fig. 3.B), we show the same graph, but
8
V. Robu, H. La Poutr´e, S. Bohte
now, for each advertiser, we also break down the number of clicks received by the position his/her sponsored URL was in when it was clicked. Surprisingly, perhaps, the smooth power law shape is not followed at the level of the display rank - in fact, for the lower levels the variance becomes so great that the distribution breaks down, at the display rank level. We hypothesize the most likely reason for this variance is the way each individual advertiser does the bidding for the preferred keywords at different points in time, or the way he specifies the way his keyword budget could be used in different periods. For example, some advertisers may have a short-running sale campaign, when they will bid aggresively for the preffered keyword, hence getting the top spot. By contrast, others may prefer to have longer-running ads, even if they don’t get the top spot every time. Some anecdotal evidence from online marketing suggests that even just the repeated display of a link of a certain merchant on the screen may count: if a user sees an ad repeatedly in his/her attention space, that may establish the brand as more trustworthy. In Fig. 3.B, by loking the the top 4 advertisers in this dataset, one can already see that users ranked 2 and 3 utilize a rather different strategy than “the trend” represented by users 1 and 4. While their total numer of clicks does follow, approximately the power law, they seem to get, proportionally speaking, more clicks on the top-ranked slot on the page than the rest. While, in order to preserve the privacy of the data, we cannot mention who these companies are, it does seem that users 2 and 3 are actually “aggregators” of advertising demand. By this, we mean online advertising agencies or engines (or automated services offered by the platform itself) that aggregate demand from different advertisers and do the bidding on their behalf. Apparently, this allows them to capture, proportionally, more often the top slot for the required keyword. Unfortunately, however, we cannot investigate this aspect further, since the dataset provided does not contain any information about bidding, budgets or financial information in general. In the following and last Section of this paper, we turn our attention to a somewhat different problem: how could we use insights gained from analyzing this query data to provide a bidding decision support for advertisers taking part in this market.
5 Using click data to derive search term recommendations The previous Sections of this paper used complex systems analysis to provide a highlevel examination of the dynamics of sponsored search markets. In this Section, we look at how such query log data could be used to output recommendations to individual advertisers. Such an approach should lead to answers to questions such as: What kind of keyword combinations look most promising to spend one’s budget on, such as to attract a maximum number of relevant user clicks? While the previous analysis of power-law formation was done at a macro-level, in this Section we take a more local perspective. That is, we do not consider the set of all possible search terms, but rather a set that is specific to a domain. This is a reasonable model: in practice, most advertisers (which are typically online merchants), are only concerned with a restricted set of keywords which are related to what they are actually trying to sell. For the analysis in this paper, we have chosen as a domain 50 keywords related to the tourism industry (i.e. online bookings of tickets, travel packages and such). The
The Complex Dynamics of Sponsored Search Markets
9
reason for this is that much of this activity is already fast moving online (e.g. a very substantial proportion of, for example, flight tickets and hotel reservations are now carried out online). Furthermore - and perhaps more important - there are low barriers of entry and the field is not dominated by one major player. This contrasts, for example, other domains, such as the sale of Ipods and accessories, where Apple Stores can be expected to have a dominant position on the clicks in the market.
5.1 Deriving distances from co-occurrence in sponsored click logs Given a large-scale query log, one of the most useful pieces of information it provides is the co-occurence of words in different queries. Much previous work has observed that the fact that two search keywords frequently appear together in the same query gives rise to some implicit semantic distance between them [11]. In this paper, we take a slightly different perspective on this issue, since, in computing the distances, we only use those queries which received at least one sponsored search click for the text ads (i.e. URLs) displayed alongside the results. We argue this is a subtle but very important difference from simply using co-occurence in organic search logs. The fact that queries containing some combination of query words lead to a click on a sponsored URL implies not only a purely semantic distance between those keywords, more important for an advertiser, the fact that users searching on those combinations of keywords have the possible intention of buying things online. Formally, let N (Ti , Tj ) denote the number of times two search terms Ti and Tj appear jointly in the same query, if that query received at least one sponsored search click. Let N (Ti ) and N (Tj ) denote the same number of queries leading to a click, in which terms Ti , respectively Tj appear in total (regardless of other terms they co-occur with). The cosine similarity distance between terms Ti and Tj is defined as: N (Ti , Tj ) Sim(Ti , Tj ) = p N (Ti ) ∗ N (Tj )
(3)
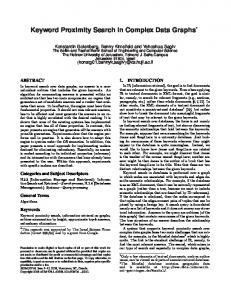
Note that cosine similarity is not the only way to define such a distance, but it is a very promising one in many online application settings, such as shown in previous work by these authors and others [11, 16, 23, 22]. 5.2 Constructing keyword correlation graphs The most intuitive way to represent similarity distances is through a keyword correlation graph. The results from our subset of 50 travel-related terms are shown in Fig. 4. In this graph, the size of each node (representing one query term) is proportional to the absolute frequency of the keyword in all queries in the log. The distances between the nodes are proportional to the similarity distance between each pair of terms, computed Eq. 3, where the whole graph is drawn according to a so called “spring embedder”type algorithm. In this type of algorithm, edges can be conceived as “springs”, whose strength is indirectly proportional to their similarity distance, leading to cluster of edges similar to each other to be shown in the same part of the graph.
10
V. Robu, H. La Poutr´e, S. Bohte
fun{6.5%}
flight{8.8%}
ticket{11.6%}
Oahu{6.1%}
Hawaii{5.1%} deal{2.9%}
entertainment{4.6%} cheap{29.1%} tickets{4.6%} party{9.9%}
warm{6.5%}
great{3.9%} nightlife{1.3%}
tour{3.3%}
holidays{2.5%}
minute{13.7%} trip{10.7%}
relaxation{4.6%} last{7.9%}
weather{4.8%}
offer{3%} island{3.7%}
hotel{8.2%}
vacation{8.7%} package{4.1%} show{2.6%}
tropical{6.8%}
beach{5.4%}
sea{6.7%}
luxury{7.1%}
sand{6%}
destination{5.9%}
sunrise{5.1%}
visit{4%}
holiday{15.4%} exotic{5.6%}
sunset{4.6%}
ocean{6.7%}
cruise{8.6%} resort{3.8%}
romantic{6%} diving{5.3%}
getaway{3.2%}
sun{4.4%} swimming{10.6%} view{3.9%} hiking{7.1%} mountain{5.2%}
climbing{6.3%}
Fig. 4. Visualization of a search term correlation graph, for a set of search terms related to the tourism industry. Each search term is assigned one colored dot. The size of the dots gives its relative weight (in total number of clicks received), while the distances between the dots are obtained through a spring-embedder type algorithm and are proportional to the co-occurrence of the two search terms in a query. Each dot is marked with its success rate (percentage of the total number of impressions associated with that query word that received a click).
There are several commercial and academic packages available to draw such complex networks. The one we think is most suitable - and which was used for graph Fig. 4 - is Pajek (see [3] for a description). Note that not all edges are considered in the � � 50 final graph. Even for 50 nodes, there are = 1225 possible pairwise similarities 2 (edges), one for each potential keyword pair. Most of these dependencies are, however, spurious (they represent just noise in the data), and our analysis benefits from using only the top fraction, corresponding to the strongest dependencies. In the graph shown in Fig. 4, containing 50 nodes, only the top 150 strongest dependencies were considered in the visualization. 5.3 Graph correlation graphs: results There are several conclusions that can be drawn from the visualization in Fig. 4 constructed based on the Live.com sponsored search query logs. First, notice that each node was labelled not only with the term or keyword it corresponds to, but also with the aggregate click-through rate (CTR), specific for that keyword. Basicallly, this is the
The Complex Dynamics of Sponsored Search Markets
11
percentage of all the queries that used the term which generated at least one click to a sponsored search URL displayed with that query. Note that these click-through rates may, at a first glance, seem on the low side: in general only a few percent of all queries actually lead to a click on an sponsored (i.e. advertiser) link. Nevertheless, as a search engine receives millions of queries in a rather short period of time, even a 5%-10% click-through rate can be quite significant. Note that some keywords (such a “cheap”) have a higher click-through rate than others. The reason for this may be that people searching for “cheap” things (e.g. cheap airline tickets, cheap holiday packages, hotel rooms etc.) may already have the intention to buy something online, and therefore are more likely to [also] click on sponsored links. However, the most interesting effect to observe in Fig. 4 are the term clusters that emerge in different parts of the graph, from the application of the spring-embedder visualization algorithm. For example, the leftmost part of the graph has 4 terms related to weather, such as “warm”, “tropical” and “exotic”. On the top left part of the graph, one can find terms such as “entertainment”, “nightlife”, “party” and “fun”, while very bottom part includes related terms as such “climbing”, “hiking” and “mountain”. The top-right part includes commercial terms such as: “ticket”, “tickets”, “flight”, “cheap”, “last”, “minute”. The central part of the graph includes terms such a “beach”, “sand”, “sea”, “resort”, “ocean”, “island” etc. Additionally, pairs of terms one would naturally associate do indeed appear close together, such as “romantic” and “getaway” and “sunset” and “sunrise” and “ocean”. In the following, we discuss an algorithm that can detect such clusters automatically. More precisely, we would like an algorithm that selects combinations of tags that look promising in attracting queries and clicks. 5.4 Automatic identification of sets of keywords In this Section, we show how keyword graphs could be automatically partitioned into relevant keyword clusters. The technique we use for this purpose is the so called “community detection” algorithm [20], also inspired by complex systems theory. In network or graph-theoretic terms, a community is defined as a subset of nodes that are connected more strongly to each other than to the rest of the network (i.e. a disjoint cluster). If the network analyzed is a social network (i.e. vertexes are people), then “community” has an intuitive interpretation. However, the network-theoretic notion of community detection algorithm is broader, has been succesfully applied to domains such as networks of items on Ebay [12], publications on arXiv, food webs [20] etc. Community detection: a formal discussion Let the network considered be represented a graph G = (V, E), when |V | = n and |E| = m. The community detection problem can be formalized as a partitioning problem, subject to a constraint. Each v ∈ V must be a assigned to exactly one group (i.e. community or cluster) C1 , C2 , ...CnC , where all clusters are disjoint. In order to compare which partition is “optimal”, the metric used is modularity, henceforth denoted by Q. Intuitively, any edge that in a given partition, has both ends in the same cluster contributes to increasing modularity, while any edge that “cuts across”
12
V. Robu, H. La Poutr´e, S. Bohte
Algorithm 1 GreedyQ Partitioning: Given a graph G = (V, E), |V | = n, |E| = m returns partition < C1 , ...CnC > 1. Ci = {vi }, ∀i = 1, n 2. nC = n 3. ∀i, j, eij initialized as in Eq. 5 4. repeat 5. < Ci , Cj >= argmaxci ,cj (eij + eji − 2ai aj ) 6. ∆Q = max S ci ,cj (eij + eji − 2ai aj ) 7. Ci = Ci Cj , Cj = ∅ //merge Ci and Cj 8. nC = nC − 1 9. until ∆Q ≤ 0 10.maxQ = Q(C1 , ..CnC )
clusters has a negative effect on modularity. Formally, let eij , i, j = 1..nC be the Pfraction of all edge weights in the graph that connect clusters i and j and let ai = 12 j eij be the fraction of the ends of edges in the graph that fall within cluster i. The modularity Q of a graph |G| with respect to a partition C is defined as: Q(G, C) =
X
(ei,i − a2i )
(4)
i
Informally, Q is defined as the fraction of edges in the network that fall within clusters, minus the expected value of the fraction of edges that would fall within the same cluster, if all edges would be assigned using a uniform, random distribution. As shown in[20], if Q = 0, then the chosen partition c shows the same modularity as a random division. A value of Q closer to 1 is an indicator of stronger community structure - in real networks, however, the highest reported value is Q = 0.75. In practice, [20] found (based on a wide range of empirical studies) that values of Q above around 0.3 indicate a strong community structure for the given network. In our case, the edges that we considered in the graph (recall that only the strongest 150 edges are considered) have a weight, defined as shown in Eq. 3 above. For the purpose of the clustering algorithm, this weight has to be normalized by the sum of all weights in the system, thus we assign initial values to eij as: eij = P
1 simij ij simij
(5)
5.5 The graph partitioning algorithm The algorithm we use to determine the optimal partition is the “community identification” algorithm described in [20], formally specified as Alg. 1 above. Informally described, the algorithm runs as follows. Initially, each of the vertexes (in our case, each keyword) is assigned to its own individual cluster. Then, at each iteration of the algorithm, two clusters are selected which, if merged, lead to the highest increase in the
The Complex Dynamics of Sponsored Search Markets
13
Cluster 1 Cluster 2 Cluster 3 Cluster 4 Cluster 5 Cluster 6 Cluster 7 Cluster 8 Cluster 9 beach party package weather getaway diving cruise show last luxury entertainment vacation exotic romantic swimming sunrise tickets minute hotel nightlife holidays tropical sunset ticket visit island fun destination warm cheap resort Hawaii deal flight sun Oahu tour mountain offer ocean great hiking climbing sea sand Keywords eliminated to increase modularity: holiday, holidays, relaxation, trip. Fig. 5. Optimal partition of the set of travel terms in semantic clusters, when the top 150 edges are considered. The partition was obtained by applying Newman’s automated “community detection” algorithm to the graph from Fig 4. This partition has a clustering coefficient Q=0.59.
modularity Q of the partition. As can be seen from lines 5-6 of Alg. 1, because exactly two clusters are merged at each step, it is easy to compute this increase in Q as: ∆Q = (eij + eji − 2ai aj ) or ∆Q = 2 ∗ (eij − ai aj ) (the value of eij being symmetric). The algorithm stops when no further increase in Q is possible by further merging. Note that it is possible to specify another stopping criteria in Alg. 1, line 9, e.g. it is possible to ask the algorithm to return a minimum number of clusters (subsets), by letting the algorithm run until nC reaches this minimum value. Furthermore, this algorithm is computationally efficient, since it is basically linear in the size of the graph (number of keywords considered), hence it can be applied even to very large datasets. 5.6 Discussion of graph partitioning results The results from the graph partitioning algorithm, showing the partition maximises the modularity Q for this setting, is shown in Fig. 5. Note that this is not the only possible way to partition this graph - if one would consider a different number of strongest dependencies to begin with (in this case we selected the top 150 edges, for 50 keywords), or a different stopping criteria, one may get a somewhat different result. Furthermore, note that some keywords, which were very general and could fit in several clusters (shown below the figure), were pruned in order to improve modularity, through a separate algorithm not shown here. Still, the partition results shown in Fig. 5 match well what our intuition would describe as interesting combinations of search terms, for such a setting. There is one large central cluster, of terms that all have reasonably strong relations to each other, and a set of small, marginal clusters on the side. The large cluster in the middle could be further broken by the partition algorithm, but only if we force some other stop criteria than maximum modularity (such as a certain number of distrinct clusters). The partition in Fig. 5 fits well with what can be graphically observed in Fig. 4: actually, most of the clusters obtained automatically after partition can be identified on
14
V. Robu, H. La Poutr´e, S. Bohte
different parts of the graph. This does not have to be a one-to-one mapping, however, because in a 2D drawing, the layout of the nodes after “spring embedding” may vary considerably and, furthermore, there are keywords which could fit well into 2 clusters, and were assigned to one as that had a slightly higher modularity.
6 Discussion 6.1 Contribution of the paper & related work Our work can be seen as related to several other directions of research. Similar techniques to the ones used in this paper have been succesfully applied to analyze large-scale collaborative tagging systems [11] and preference networks for Ebay items [12]. The amount of work which is specifically geared to sponsored search auctions, especially empirical studies, has so far been rather limited (probably not least due to lack of extensive datasets in this field). Much of the previous work, e.g. [8] looks mostly at the bias introduced by a link’s display rank on clicking behaviour (such as discussed in Sect. 3 of this paper). Another important direction of work uses existing intuitions about user clicking behaviour to design different allocation mechanisms for this problem - the work of [5] is a good example of this approach. By comparison to our work, the approach taken by [5] studies mostly at mechanism design issues arising from computational advertising, rather than perform an empirical examination of such markets. One paper that is related in scope to ours, since it also provides an empirical study of search engine advertising markets is [9]. This work takes, however, a different perspective on this problem, also due to the different type of data the authors had available. By contrast to our work, the data that [9] use comes from a single, large-scale advertiser. This means they do get access to more detailed information (including financial one) and can say more about actual bidding behaviour. By comparison, the data available to us for this study does not contain any detailed financial information, but, unlike [9] it allows us to have a global level view of the whole market (from the perspective of the search engine, not just a single advertiser). This provides very important insights about the structure of sponsored search markets. Finally, there exists previous work that has applied similar co-occurence-based techniques to organic search logs or tagging systems [7, 11]. However, our focus in this paper is different: we do not aim to to merely deduce what is the semantic distance between keywords in the general sense, but what kind of combinations of keywords are financially interesting for a sponsored search advertiser to bid on. This is the reason why the size of the nodes and distances computed in Fig. 4 are built using only queries which lead to an actual click on a sponsored ad. Basically, this is equivalent to filtering only the “opinion” (expressed through queries) of the subset of users that are likely to buy something online, rather than all search engine users. To our knowledge, this is the first paper to use sponsored search click data in this way. 6.2 Future work This work, being somewhat preliminary, leaves many aspects open to future research. On such aspect would be is the issue of externalities: how the presence of links by competing advertisers influences the clickthrough rates of other bidders. As the competition
The Complex Dynamics of Sponsored Search Markets
15
is basically on customers’ attention space, externalities play an important role in the efficacity of sponsored search impressions. Another very interesting topic would be to study the structure of sponsored search markets (in terms of advertiser market share etc.) not only at the global, macro-level, but at the level of individual sets of keywords. In fact, sponsored search can be seen not only as one market, as a network of markets, since most advertisers are interested in (and bid on) a specific set of keywords related to what they are selling. For example, we could apply community detection algorithms to partition not only sets of search keywords, but also sets of bidders (advertisers) interested in those keywords. This should allow us to derive more in-depth insights into the structure of sponsored search. Finally, exploring how specialized mechanisms such as priced options [13, 14, 18, 17] could improve the allocation of attention space in sponsored search markets represents another promising line for further work. Acknowledgements The authors thank Microsoft Research for their support, in the framework of a ‘Beyond Search” award. We also wish to thank Nicole Immorlica and Renato Gomes (Nortwestern University) for many useful discussions in the preliminary stages of this work.
References 1. A. Baldassarri, A. Barrat, A. Cappocci, H. Halpin, U. Lehner, J. Ramasco, V. Robu, and D. Taraborelli. The berners-lee hypothesis: Power laws and group structure in flickr, 2008. Proc. of Dagstuhl Seminar on Social Web Communities, Dagstuhl DROPS 08391. 2. Y. Bar-Yam. The dynamics of complex systems. Westview Press, 2003. 3. V. Batagelj and A. Mrvar. Pajek - A program for large network analysis. Connections, 21:47–57, 1998. 4. S. M. Bohte, E. Gerding, and J. L. Poutr´e. Market-based recommendation: Agents that compete for consumer attention. ACM Trans. Internet Technology, 4(4):420–448, 2004. 5. C. Borgs, J. Chayes, N. Immorlica, K. Jain, O. Etesami, and M. Mahdian. Dynamics of bid optimization in online advertisement auctions. In WWW ’07: Proc. 16th Int. Conf. World Wide Web, pages 531–540. ACM Press, 2007. 6. T. Carter. A short trip through entropy to power laws, 2007. Complex Systems Summer School, Santa Fe Institute, NM. 7. R. L. Cilibrasi and P. M. B. Vitanyi. The google similarity distance. IEEE Trans. on Knowl. and Data Eng., 19(3):370–383, 2007. 8. N. Craswell, O. Zoeter, M. Taylor, and B. Ramsey. An experimental comparison of click position-bias models. In Proc of. WSDM ’08, pages 87–94. ACM Press, 2008. 9. A. Ghose and S. Yang. Analyzing search engine advertising: firm behavior and cross-selling in electronic markets. In WWW ’08: Proc. of the 17th Int. Conf. on World Wide Web, pages 219–226. ACM Press, 2008. 10. H. Halpin, V. Robu, and H. Shepherd. The dynamics and semantics of collaborative tagging. In Proc. of the 1st Semantic Authoring and Annotation Workshop (SAAW’06), 2006. 11. H. Halpin, V. Robu, and H. Shepherd. The complex dynamics of collaborative tagging. In Proc. 16th Int. World Wide Web Conference (WWW’07), pages 211–220. ACM, 2007. 12. R. K.-X. Jin, D. C. Parkes, and P. J. Wolfe. Analysis of bidding networks in eBay: Aggregate preference identification through community detection. In Proc. AAAI Workshop on Plan, Activity and Intent Recognition, 2007.
16
V. Robu, H. La Poutr´e, S. Bohte
13. A. I. Juda and D. C. Parkes. An options-based method to solve the composability problem in sequential auctions. In Agent-Mediated Electronic Commerce VI, pages 44–58. Springer, 2006. 14. A. I. Juda and D. C. Parkes. The sequential auction problem on ebay: An empirical analysis and a solution. In Proc. 7th ACM Conf. on Electr. Commerce, pages 180–189. ACM Press, June 2006. 15. K. L. Judd and L. Tesfatsion. Handbook of computational economics II: Agent-Based computational economics. Handbooks in Economics Series, North-Holland, the Netherlands, 2005. 16. G. Linden, B. Smith, and J. York. Amazon.com recommendations: item-to-item collaborative filtering. In IEEE Internet Computing 7(1), pages 76–80, 2003. 17. L. Mous, V. Robu, and H. La Poutr´e. Can priced options solve the exposure problem in sequential auctions? In ACM SIGEcom Exchanges 7(2). ACM Press, 2008. 18. L. Mous, V. Robu, and H. La Poutr´e. Using priced options to solve the exposure problem in sequential auctions. In Agent-Mediated Electronic Commerce (AMEC’08). Springer LNAI (to appear), 2008. 19. M. Newman. Power laws, pareto distributions and zipf’s law. Contemporary Physics, 46:323–351, 2005. 20. M. E. J. Newman. Fast algorithm for detecting community structure in networks. Phys. Rev., E 69, 066133, 2004. 21. V. Robu and H. La Poutr´e. Designing bidding strategies in sequential auctions for risk averse agents. In Agent-Mediated Electronic Commerce,, pages 76–89. Springer LNBIP 13, 2007. 22. V. Robu and H. L. Poutr´e. Learning the structure of utility graphs used in multi-issue negotiation through collaborative filtering. In Proc. of the Pacific Rim Workshop on Multi-Agent Systems (PRIMA’05), 2005. 23. V. Robu, D. Somefun, and J. A. L. Poutr´e. Modeling complex multi-issue negotiations using utility graphs. In Proc. of the 4th Int. Conf. on Autonomous Agents & Multi Agent Systems (AAMAS), Utrecht, The Netherlands, 2005, pages 280–287. ACM Press, 2005.