The DecideIT Decision Tool M. DANIELSON ¨ Orebro University, Sweden L. E KENBERG Stockholm University and Mid Sweden University, Sweden J. J OHANSSON Mid Sweden University, Sweden A. L ARSSON Mid Sweden University, Sweden
Abstract The nature of much information available to decision makers is vague and imprecise, be it information for human managers in organisations or for process agents in a distributed computer environment. Several models for handling vague and imprecise information in decision situations have been suggested. In particular, various interval methods have prevailed, i.e. methods based on interval estimates of probabilities and, in some cases, interval utility estimates. Even if these approaches in general are well founded, little has been done to take into consideration the evaluation perspective and, in particular, computational aspects and implementation issues. The purpose of this paper is to demonstrate a tool for handling imprecise information in decision situations. The tool is an implementation of our earlier research focussing on finding fast algorithms for solving bilinear systems of equations together with a graphical user interface supporting the interpretation of evaluations of imprecise data. Keywords decision analysis, interval probabilities, utility theory, decision tools
1 Introduction The idea of using computers to support decision making has been around almost as long as computers have been available for humans in usable form. The past decades have witnessed a tremendous development in the graphical user interface, which facilitates the use of more advanced computational techniques to 204
Danielson et al.: The DecideIT Decision Tool
205
a wider group of users. As a consequence, several decision analytic tools have emerged during the last decade. Decision software based on classical decision theory, such as Standard & Poor’s DPL (www.dpl.adainc.com), Palisades’ PrecisionTree (www.palisade.com), and TreeAge’s DATA (www.treeage.com), have successfully been commercialised and are used by various professional decision analysts and decision makers to aid them in their work. However, most classical decision models and software based on them consist of some straightforward set of rules applied to precise numerical estimates of probabilities and values. Matrix, tree, and influence diagram models have proliferated, but since they mostly handle precise numeric figures, sensitivity analysis is often not easy to carry out in more than a few dimensions at a time. The requirement to provide numerically precise information in such models has often been considered unrealistic in real-life decision situations, and a number of models with representations allowing imprecise statements have been suggested. Some of them use standard probability theory while others contain some specialised formalism. Most of them focus more on representation and probabilistic inference, and less on evaluation [15], [21], [22], [23], [24]. The purpose of this paper is to present a new decision tool currently being developed, called DecideIT. It allows the decision maker to be as deliberately imprecise as he feels is natural and provides him with the means of expressing varying degrees of imprecision in the input sentences, facilitating both the use of decision trees and influence diagrams as decision models. The application takes advantage of a set of algorithms defined as the DELTA method [4], [5], [8], [9], combined with a user-friendly interface which provides an intuitive graphical representation of evaluation results. Pre-release versions of DecideIT have been used in a number of various areas and situations, such as contract formulations [1], investment decisions [7], and insurance policies and flood management [10]. DecideIT is currently in a beta-stage of the development phase and will be distributed by Doctor Decide (www.doctordecide.com). Academic licenses will be available for a symbolic fee.
2 The DELTA Method The main concern of the DELTA method is evaluation of decision problems, with probability and utility intervals to express numerically imprecise information. The method originates from research on handling decision problems involving a finite number of alternatives and consequences [16]. Interval sentences are of the form: “The probability of ci j lies between the numbers ak and bk ” and are translated into pi j ∈ [ak , bk ]. Comparative sentences are of the form: “The probability of ci j is greater than the probability of ckl ”. Such a sentence is translated into an inequality pi j ≥ pkl . The conjunction of constraints of the types above together with ∑ j pi j = 1 for each alternative Ai
206
ISIPTA ’03
involved is called the probability base (P). The value base (V ) consists of similar translations of vague and numerically imprecise value estimates. A collection of interval constraints concerning the same set of variables is called a constraint set. For such a set of constraints to be meaningful, there must exist some vector of variable assignments that simultaneously satisfies each inequality, i.e., the system must be consistent. The orthogonal hull is a concept that in each dimension signals which parts are incompatible with the constraint set, thus it consists of consistent value assignments for each variable. Definition 1: Given a consistent constraint set X in {xi }i∈I , I = {1, . . . , n}, and a function f , X max( f (x)) =de f sup(a|{ f (x) > a} ∪ X is consistent). Similarly, X min( f (x)) =de f inf(a|{ f (x) < a} ∪ X is consistent). Definition 2: Given a consistent constraint set X in {xi }i∈I , I = {1, . . . , n}, the set of pairs {hX min(xi ),X max(xi )i} is the orthogonal hull of the set and is denoted hX min(xi ),X max(xi )in . The orthogonal hull greatly simplifies the computational effort and can be pictured as the result of wrapping the smallest orthogonal hyper-cube around the constraint set. For the probability base P, such a wrapping of a consistent system yields feasible interval probabilities, in the sense that none of the lower and upper bounds of the probability assignments are inconsistent [24].
2.1 Strength of Alternatives An information frame contains the probability and value bases. In an information frame, an alternative Ai is represented by its consequence set Ci = {ci1 , . . . , cihi }. Definition 3: Given an information frame h{C1 , . . . ,Cn }, P,V i the strength, δi j , denotes the expression E(Ci ) − E(C j ), i.e., ∑k pik · vik − ∑k p jk · v jk , over all consequences in the consequence sets Ci and C j . To analyse the strength of the alternatives, PVmax(δi j ) is calculated. This means that we choose the feasible solutions to the constraints in P and V that are most favourable to E(Ci ) and demeaning to E(C j ). This means that if there are no dependencies1 between the alternatives, PVmax(δi j ) =PVmax(E(Ci ))−PVmin(E(C j )) and PVmin(δi j ) =PVmin(E(Ci ))−PVmax(E(C j )). The concept of strength expresses the maximum differences between the alternatives under consideration. It is however used in a comparative way so that formally the maximum and minimum is calculated. In this way, we get a measure about the proportions of the information frame, where the respective alternatives are dominant. When applying the hull 1 cf.
[4] for details when there are various dependencies between the alternatives.
Danielson et al.: The DecideIT Decision Tool
207
cut operation (see section 2.2), we also receive a measure of the stability of these differences. This is, however, not enough. Sometimes, the decision maker wants to put more emphasis on the maximal difference (displaying a difference-prone behaviour). At other times, the minimal difference is of more importance. This is captured in the medium difference. Definition 4: Given an information frame h{C1 , . . . ,Cn }, P,V i, let α ∈ [0, 1] be a real number. The α-medium difference of δi j in the frame is PV[α]mid(δi j ) = α ·PVmax(δi j ) + (1 − α) ·PVmin(δi j ). The α can be considered a precedence parameter that indicates if one boundary should be given more weight than the other. It is, consequently, a measure of difference in strength between the consequence sets. This view duality is a key to understanding the selection process. This is further discussed in [6]. For the pairwise evaluation of our alternatives, [4] suggests the two algorithms PBOpt and VBOpt. The first algorithm (probability bilinear optimisation) can handle any statement except comparisons between value variables from different Ci ’s, and is described as follows. Definition 5: Given an information frame h{C1 , . . . ,Cn }, P,V i, let Ci be the set {ci1 , . . . , cihi }. Then VEimax is pi1 · ai1 + . . . + pihi · aihi , where ain , 1 ≤ n ≤ hi , is sup(b|{b = vin } ∪ {ai(n−1) = vi(n−1) } ∪ . . . ∪ {ai1 = vi1 } is consistent with V ).
Further, VEimin is pi1 · ai1 + . . . + pihi · aihi , where ain , 1 ≤ n ≤ hi , is inf(b|{b ≥ vin } ∪ {ai(n−1) = vi(n−1) } ∪ . . . ∪ {ai1 = vi1 } is consistent with V ). Let C j be the set {c j1 , . . . , c jh j }. Then V δi j is VEimax −V E min j . The idea behind this is to transform a bilinear expression into a linear expression with the property of having the same extremal value under specific conditions. Under conditions satisfied by a majority of information frames, max δ i j = maxV δi j and min δi j = minV δi j . When comparisons between value variables from different Ci ’s are important, the VBOpt algorithm should be considered instead. VBOpt is a twin algorithm to PBOpt, working essentially in the same way, but for other preconditions [4].
2.2 Cutting the Orthogonal Hull A problem with evaluating interval statements is that the results could be overlapping, i.e., an alternative might not be dominating2 for all instances of the feasible values in the probability and value bases. A suggested solution to this is to further investigate in which regions of the bases the respective alternatives are dominating. For this purpose, the hull cut is introduced in the framework. The hull cut 2 Alternative
i dominates alternative j iff PVmin(δi j ) > 0.
208
ISIPTA ’03
can be seen as generalised sensitivity analyses to be carried out to determine the stability of the relation between the consequence sets under consideration. The hull cut avoids the complexity in combinatorial analyses, but it is still possible to study the stability of a result by gaining a better understanding of how important the interval boundary points are. If dominance is evaluated on a sequence of ever-smaller sub-bases, a good appreciation of the strength’s dependency on boundary values can be obtained. This is taken into account by cutting off the dominated regions indirectly using the hull cut operation. This is denoted cutting the bases, and the amount of cutting is indicated as a percentage p, which can range from 0 % to 100 %. For a 100 % cut, the bases are transformed into single points, and the evaluation becomes the calculation of the ordinary expected value. Definition 6: X is a base with the variables x1 , . . . , xn , π ∈ [0, 1] is a variable referred to as the cut level. hai , bi in is the orthogonal hull, and k = (k1 , . . . , kn ) is a consistent point in X. A π-cut of X is to add the interval statements {x i ∈ [ai + π · (ki − ai ), bi − π · (bi − ki )] : i = 1, . . . , n} to the base X. k is called the contraction point. If no consistent contraction point is given explicitly by the decision maker, DecideIT suggests one by minimising the distance to the orthogonal hull midpoints. The choice of the calculated contraction point is motivated by being the centroid in the (non-explicit) second-order belief distributions over the intervals [12]. Intuitively, the hull cuts in DecideIT are based on values closer to the centre of the interval being more reliable, i.e., there is an underlying assumption that the second-order distributions have a mass concentrated to the centre. Since the belief in peripheral values is somewhat less, the interpretation of the cut is to zoom in on more believable values that are more centrally located. The centroid of a distribution is exactly this point where this geometrical property of the distribution can be regarded as concentrated. Furthermore, it has very attractive properties from computational as well as intuitive view-points [12]. By co-varying the cutting of an arbitrary set of intervals, it is possible to gain much better insight into the influence of the structure of the information frame on the solutions. Contrary to volume estimates, hull cuts are not measures of the sizes of the solution sets but rather of the strength of statements when the original solution sets are modified in controlled ways. Both the set of intervals under investigation and the scale of individual hull cuts can be controlled.
2.3 Risk Constraints and Security Levels It is reasonable to extend the framework based on the principle of maximising the expected utility with other decision rules. A number of rules have been suggested,
Danielson et al.: The DecideIT Decision Tool
209
see, e.g., [14], [18] and [20], but these are mostly applicable to decisions under strict uncertainty. A more general approach is to introduce risk constraints that provide thresholds beyond which a strategy is undesirable. However, when the information is numerically imprecise, the meaning of such thresholds is not obvious. In [11] it is suggested that the interval limits together with stability analyses should be considered in such cases. In DecideIT, such thresholds are referred to as security levels, and the exclusion of undesirable consequence sets takes the following form, S(Ci , r, s) = (
∑
vi j ≤r
pi j ≤ s)
where r denotes the lowest acceptable value and s the highest acceptable probability of ending up with a lower value than r. This means that the sum of the probabilities, where the consequences violate the security level r, must not exceed s. When dealing with interval statements it is not obvious what r and s represents, but one approach is to study the worst and best case by using lower and upper bounds. The contraction points can be used to study the normal case. The concept of security levels is of general use when implementing risk constraints, as suggested in [8].
3 The Tool The decision tools currently available on the market (e.g., DPL, PrecisionTree, DATA etc.) have set a useful de facto standard for how users may interact with the software, and construct models of their decision problems. Therefore, DecideIT has about the same look-and-feel as these tools.
210
ISIPTA ’03
Figure 1: Screenshot of DecideIT holding an influence diagram that has been converted to a decision tree.
Currently, three types of nodes may be used in the application: decision nodes, chance nodes, and consequence nodes. Work is carried out on deterministic nodes for influence diagrams.
3.1 Decision Trees A decision tree is graphically illustrated on the screen, showing explicitly the probabilities and values for all nodes. Interaction with the model is performed through the GUI. Editing probabilities, values, and other properties of a certain node is performed through a node property frame.
Figure 2: Entering imprecise probabilities, using a probability template for the outcome leading to E6 . For the outcome C12 , we explicitly set the contraction point to 0.55.
Danielson et al.: The DecideIT Decision Tool
211
3.2 Influence Diagrams Influence diagrams are, when evaluated, transformed into a corresponding symmetric decision tree using a conversion algorithm that creates a total ordering of all connected nodes in the diagram, barren nodes discarded. This conversion algorithm traverses along the directed arcs, and orders the nodes according to a set of rules. In some cases, when only the topology of the graph is not enough to order the nodes, a node placed to the left is converted before a node to the right. It is also possible to convert an influence diagram into an instance of a decision tree, and continue the modelling work on this tree. Editing the properties of a node in an influence diagram is analogous to the same procedure for a decision tree. There is, however, some differences between the node property frames of the two models. In an influence diagram, the user gets an overview of the conditional expansion order when editing properties of a conditionally dependent chance node.
Figure 3: Entering conditional probabilities for a conditionally dependent chance node in an influence diagram.
Reversal of arcs is possible between two chance nodes in an influence diagram, who shares a common information state and have no other directed path between them. Thus, according to Shachter, the two chance nodes must inherit each other’s conditional predecessors before reversal of an arc between them [19]. Bayes’ theorem is invoked, and to determine the lower bound we maximise the denominator and minimise the numerator, and vice versa for the upper bound. This means that as of today reversal of arcs in DecideIT simply employ the intuitive concept of conditional probability, and a re-flip of the arc will not restore the values for interval probabilities as they do in the precise case. One solution is to implement the Fertig and Breese algorithm [13], but since we do not wish to lose the upper bounds this solution seems less interesting. There does not exist one superior algorithm for this problem taking both lower and upper bounds in account [2],
212
ISIPTA ’03
[3].
Because of this drawback, development of DecideIT will focus on employing the canonical concept of conditional probabilities [24], but this is a matter of further research regarding the computational aspects. The user of DecideIT may however choose not to let the software automatically suggest any new conditional probabilities when flipping an arc.
3.3 Probability and Value Statements In a chance node in a tree or influence diagram, it is possible to set comparative statements between the probabilities of different outcomes. These statements are then added to the constraint sets. Value statements are set in an analogous fashion.
Figure 4: Setting a comparative probability statement, that the probability of the outcome leading to C5 is at least 0.05 higher than the probability of ending up with C3 .
Note that by using this feature, it is possible to handle qualitative probabilities and utilities in a common framework together with the interval approach. Such statements let both decision trees and influence diagrams handle both quantitative and qualitative information, as a step towards evaluation of more qualitative models defined in [17].
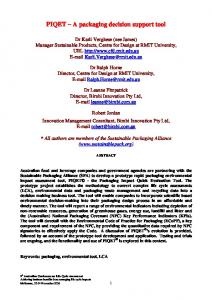
3.4 Presentation of Evaluation Results Results are presented as a graph. Along the x-axis we have the cut in per cent ranging from 0% to 100%, and along the y-axis the possible differences of the expected values between a pair of alternatives. It is also possible to compare one alternative against an average of a set of alternatives. In Figure 5, the upper line is max(δ13 ), the middle is PV [0.5]mid(δ13), and the lower is min(δ13 ). The shrinking area depicts the expected value under different degrees of cutting. As can be seen, the higher cut level that is used, the more equal the alternatives seem to be, according to the principle of maximising the expected utility. For a 100% cut, where the results from the algorithms coincide with the ordinary expected value, the result implies that A3 is the better alternative. However, taking impreciseness in account, it may not be that simple.
Danielson et al.: The DecideIT Decision Tool
213
Figure 5: Pairwise comparison of two alternatives, using the DELTA method. After about 75% cut, we see that PV [0.5]mid(δ13 ) < 0.
3.5 Security Levels In Figure 6, we investigate at which cut level a given security level will hold in the worst case3 . An all-green (light grey) alternative can then from this perspective be considered as completely safe.
Figure 6: A security analysis with a security level of -100 as the lowest acceptable value and 0.02 as the highest acceptable probability.
A3 does not violate the security levels for any cut level and seems to be the desired course of action for a risk avoidant decision maker. This is represented by green (brighter) in the figure above. After a 70% cut level, A2 does not violate the given security level. If the decision maker is eager for choosing A 1 or A3 , the security analysis imply that A1 is more risky than A3 , leaving the decision maker to seriously consider choosing A3 over A1 . 3 It
is possible to investigate best and normal cases as well.
214
ISIPTA ’03
3.6 Preference Ordering Among Consequences In complex decision situations with large sets of consequences, it might be timeconsuming to identify the preference ordering of consequences, and DecideIT offers a graphical overview of such a relation on a set of consequences. The ordering is easily determined by checking whether vi j − vkl > 0 is consistent with the value base. If not, vi j is before vkl in the partial ordering. Thereafter, obvious transitive relationships are removed.
Figure 7: Preference order among consequences, where C1 is the most preferred consequence.
3.7 Critical Values Even though the concept of hull cut is a general form of sensitivity analysis, a model may be further investigated through identifying the most critical elements of a decision problem. By varying each event’s probability and utility values within their intervals, it is possible to identify the elements with highest impact on the expected value. This feature lets a decision maker identify where to put his efforts in the information gathering procedure in order to make more safe decisions.
Danielson et al.: The DecideIT Decision Tool
215
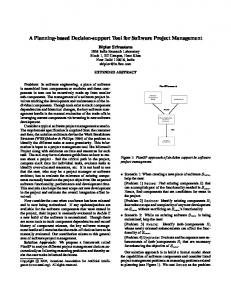
Figure 8: Identifying the critical elements of a decision problem, illustrated as a tornado diagram.
For probability variation, the event E6 has the highest impact on the expected value. By varying the probabilities for this uncertain event, the expected value may differ 397.9 value units. For value variation, the impreciseness in the value of consequence C6 affects the expected value the most.
4 Concluding Remarks Based on our earlier research on fast algorithms for solving bilinear problems, we have presented a tool integrating various procedures for handling vague and numerically imprecise probabilities and utilities. The tool has been tested in several real-life applications, and provides means for evaluating decision situations using alternative evaluation principles beside the conventional pointwise maximisation of the expected utility. The latter has turned out to be too limited in many situations. Thus, we also suggest that the alternatives should be further investigated with respect to their relative strengths and also to the number of values consistent with the given domain. Furthermore, the alternatives can also be evaluated relative to a set of security parameters considering how risky they are. To refine the evaluations, we have also shown how hull cut procedures can be introduced in the model. These indicate the effects of choosing different degrees of reliability of the input data. In this way, it is possible to investigate critical variables and the stability of the evaluations. The result of such an analysis often point out reasonable strategies, but also what aspects are crucial to consider for a reliable and stable result.
216
ISIPTA ’03
References [1] N-P. Andersson, L. Ekenberg, and A Larsson. A Bayesian Approach to Operational Decisions in Transportation Businesses. In Proc. of 15th International FLAIRS Conference, 514–518, AAAI Press, 2002. [2] A. Cano and S. Moral. A Review of Propagation Algorithms for Imprecise Probabilities. In Proc. of 1st International Symposium on Imprecise Probabilities and their Applications, 1999. [3] F.G. Cozman. Computing Posterior Upper Expectations. In Proc. of 1st International Symposium on Imprecise Probabilities and their Applications, 1999. [4] M. Danielson and L. Ekenberg. A Framework for Analysing Decisions Under Risk. In European Journal of Operational Research, vol. 104/3, 474– 484, 1998. [5] M. Danielson. Generalized Evaluation in Decision Analysis. To appear in European Journal of Operational Research, 2003. [6] M. Danielson and L. Ekenberg. Symmetry in Decision Evaluation. In Proc. of 14th International FLAIRS Conference, 575–579, AAAI Press, 2001. [7] M. Danielson, L. Ekenberg, J. Johansson and A. Larsson. Investment Decision Analysis – A Case Study at SCA Transforest. To appear in Proc. of The 2003 International Conference on Information and Knowledge Engineering, CSREA Press, 2003. [8] L. Ekenberg. Risk Constraints in Agent Based Decisions. In A. Kent & J.G. Williams (Eds) Encyclopaedia of Computer Science and Technology, vol. 23/48, 263–280, Marcel Dekker nc., 2000. [9] L. Ekenberg, M. Boman, and J. Linneroth-Bayer. General Risk Constraints. In Journal of Risk Research 4/1, 31–47, 2001. [10] L. Ekenberg, L. Brouwers, M. Danielson, K. Hansson, A. Riabacke, J. Johansson, and A. Vari. Simulations and Analysis of Three Flood Management Strategies. International Institute for Applied Systems Analysis (IIASA), 2003. [11] L. Ekenberg, M. Danielson, and M. Boman. Imposing Risk Constraints on Agent-Based Decision Support. In Decision Support Systems, vol. 20/1, 3– 15, 1997. [12] L. Ekenberg and J. Thorbi¨ornson. Second-Order Decision Analysis. In International Journal of Uncertainty, Fuzziness and Knowledge-Based Systems, vol. 9/1, 13–38, 2001.
Danielson et al.: The DecideIT Decision Tool
217
[13] K.W. Fertig and J.S. Breese. Probability Intervals Over Influence Diagrams. In IEEE Transactions on Pattern Analysis and Machine Intelligence 15, 280–286, 1993. [14] L. Hurwicz. Optimality Criteria for Decision Making under Ignorance. Cowles Commission Discussion Paper, vol. 370, 1951. [15] H.E. Kyburg. Semantics for Interval Probabilities. In Proc. of 15th International FLAIRS Conference, 253–257, AAAI Press, 2002. [16] P-E. Malmn¨as. Towards a Mechanization of Real Life Decisions. In Logic and Philosophy of Science in Uppsala, 231–243, 1994. [17] S. Renooij and L. van der Gaag. Decision Making in Qualitative Influence Diagrams. In Proc. of 11th International FLAIRS Conference, 410–414, AAAI Press, 1998. [18] L. Savage. The Theory of Statistical Decision. In Journal of the American Statistical Association, vol. 46, 55–67, 1951. [19] R.D. Shachter. Evaluating Influence Diagrams. In Operations Research 34, 871–882, 1986. [20] A. Wald. Statistical Decision Functions, John Wiley and Sons, 1950. [21] P. Walley. Statistical Reasoning with Imprecise Probabilities, Chapman and Hall, 1991. [22] P. Walley. Imprecise Probabilities. From The Imprecise Probabilities Project, http://ippserv.rug.ac.be, 1997. [23] K. Weichselberger and S. P¨ohlman. A Methodology for Uncertainty in Knowledge-Based Systems, Springer-Verlag, 1990. [24] K. Weichselberger. The Theory of Interval-Probability as a Unifying Concept for Uncertainty. In Proc. of 1st International Symposium on Imprecise Probabilities and their Applications, 1999. ¨ ¨ Mats Danielson is with the Department of Informatics / ESI at Orebro University, Orebro, Sweden. E-mail:
[email protected] Love Ekenberg is with the Department of Computer and Systems Sciences at Stockholm University and KTH, Stockholm, Sweden, and the Department of Information Technology and Media at Mid Sweden University, Sundsvall, Sweden. E-mail:
[email protected] Jim Johansson is with the Department of Information Technology and Media at Mid Sweden University, Sundsvall, Sweden. E-mail:
[email protected] Aron Larsson is with the Department of Information Technology and Media at Mid Sweden University, Sundsvall, Sweden. E-mail:
[email protected]