Meeting of Globalization, Investment and Services Trade in Milan, the 2009 SAET Conference in. Ischia and the 2009 ETSG Conference in Rome for insightful ...
ISSN 2042-2695
CEP Discussion Paper No 980 May 2010 The Determinants of Vertical Integration in Export Processing: Theory and Evidence from China Ana Fernandes and Heiwai Tang
Abstract Using detailed product-level export data for China and a variant of the Antràs and Helpman (2004) model that includes investments in component search, we examine the sectoral determinants of foreign direct investment (FDI) versus foreign outsourcing in export processing trade. We exploit the coexistence of two regulatory export processing regimes in China, which specify who owns and controls the imported components for export processing. We find that in the regime that Chinese plants own the imported components, the share of exports from vertically integrated plants is increasing in the intensity of headquarter inputs across sectors, and is decreasing in the contractibility of inputs. These results are consistent with the property- rights theory of intra-firm trade. However, in the regime that foreign firms own the imported components, no significant relationship is found between the prevalence of vertical integration, headquarter intensity and input contractibility across sectors. The positive relationship between productivity dispersion and the export share of integrated plants across sectors, as suggested by the existing literature, is found only in the regime that foreign firms own the imported components. These results are consistent with our model, which considers ownership of imported components as an alternative to asset ownership to alleviate the hold-up problem by the export-processing plant. Keywords: Intrafirm trade, vertical integration, export processing, outsourcing JEL Classifications: F14, F23, L14, L33
This paper was produced as part of the Centre’s Globalisation Programme. The Centre for Economic Performance is financed by the Economic and Social Research Council.
Acknowledgements We are grateful to Pol Antràs, Fabrice Defever, Giovanni Facchini, Giordano Mion, Emanuel Ornelas, Larry Qiu, Steve Redding, Shang-Jin Wei, Stephen Yeaple and seminar participants at Clark, Colby, LSE, Nottingham, Sussex and Trinity College Dublin, as well as conference participants at the First Meeting of Globalization, Investment and Services Trade in Milan, the 2009 SAET Conference in Ischia and the 2009 ETSG Conference in Rome for insightful discussions and comments. We thank Randy Becker, Joseph Fan, Nathan Nunn and Peter Schott for kindly sharing with us their data. We also thank Nuffield Foundation and Hong Kong Research Grants Council for financial support. Fernandes thanks the Centre for Economic Performance at the London School of Economics where part of this research was conducted. Ana Fernandes is a Lecturer in Economics at the University of Sussex. In 2009 she was an Associate of the Centre for Economic Performance, London School of Economics. Heiwai Tang is an Assistant Professor of Economics at Tufts University, Massachusetts.
Published by Centre for Economic Performance London School of Economics and Political Science Houghton Street London WC2A 2AE All rights reserved. No part of this publication may be reproduced, stored in a retrieval system or transmitted in any form or by any means without the prior permission in writing of the publisher nor be issued to the public or circulated in any form other than that in which it is published. Requests for permission to reproduce any article or part of the Working Paper should be sent to the editor at the above address. © A. Fernandes and H. Tang, submitted 2010
1
Introduction
Using detailed product-level trade data from China’s Customs and a variant of the Antràs and Helpman (2004) model that includes investments in component search, this paper studies the relative prevalence of FDI versus outsourcing in export processing trade. Although there is a large and growing theoretical literature that applies the theory of the …rm to study the determinants of intra…rm trade, empirical evidence is relatively scant and exclusively focuses on the developed world.1 By exploiting the coexistence of the two export processing regimes in China, which designate by law the owner of the imported materials, we add to the empirical literature on validating the predictions of the theory on incomplete contracting, organizational structure and international trade. In particular, we use data of the input suppliers in a developing country to examine the sectoral determinants of FDI and arm’s-length trade according to the property-rights theory of the …rm.2 Our results complement the existing empirical literature that has so far provided empirical evidence from the headquarter’s side in developed countries. Export processing has been an important part of China’s recent economic development. It accounted for more than half of its exports in recent years.3 Chinese export processing plants have been governed under two regulatory regimes since the early 1980s, which are referred to as pure-assembly and import-and-assembly. The main di¤erence between the two regimes lies in the allocation of control rights and ownership of the imported inputs. Speci…cally, under the pure-assembly regime, a foreign …rm supplies components to a Chinese plant who processes them into …nished products. The foreign …rm retains ownership of the imported inputs throughout the production process. Under the import-and-assembly regime, on the other hand, an assembly plant in China imports inputs of its own accord. The assembly plant owns the inputs and reserves the option of using the imported inputs for export processing for other foreign clients. We exploit this special regulatory feature in China, which allows us to observe who owns and controls the imported materials in a joint production relationship, to better understand the prevalence of FDI versus foreign outsourcing. The premise is that di¤erent allocation arrangements of control rights and ownership of imported inputs across the two trade regimes can a¤ect the organizational choices by the foreign clients, and thus shape the pattern of trade across industries. To guide our empirical analysis on the organizational structure of international trade and deepen our understanding of export processing, we extend the Antràs and Helpman (2004) North-South trade model with heterogeneous …rms to incorporate investment decisions in imported component search. The extension involves the …nal-good producer in the North searching for inputs internationally under pure-assembly; whereas the assembly plant in the South conducting the search under import-and-assembly. When the terms of investments cannot be fully speci…ed in contracts ex ante, both parties of the joint production unit anticipate Nash bargaining over the surplus from 1
Seminal work includes McLaren (2000), Antràs (2003, 2005), Grossman and Helpman (2002, 2003, 2004, 2005), Antràs and Helpman (2004, 2008). See Helpman (2006) for a summary of the theoretical literature, and Hummels et al. (2001) for the evidence of the tremendous growth of trade in intermediate inputs. More recent studies include Conconi et al. (2008) and Ornelas and Turner (2009), among others. 2 We take the property-rights approach to study the determinants of vertical integration. The determinants of multinational …rm boundaries can be analyzed by other theories of the …rm. Existing research has applied the incentive-systems approach of Holmstrom and Milgrom (1994), and the authority-delegation approach of Aghion and Tirole (1997) to study the general equilibrium patterns of foreign integration and outsourcing. For the incentivesystems approach, see Grossman and Helpman (2004), among others. For the authority-delegation approach, see Marin and Verdier (2008, 2009) and Puga and Tre‡er (2003), among others. 3 To promote export-led growth, the Chinese government o¤ers tari¤ exemption on imported materials for exportprocessing plants, as long as the entire output is exported. See section 2 for more details.
2
the relationship, and underinvest in their corresponding activities as in the classic hold-up situation à la Grossman and Hart (1986). When ownership over imported inputs o¤ers the owner a higher outside option to use the inputs or the associated intangible asset with a third party when bargaining fails, the optimal production mode may involve allocating ownership of both the imported inputs and the plant’s assets to the party whose investments are more important for production. Our heterogeneous-…rm model predicts the coexistence of vertical integration and outsourcing in both import-and-assembly and pure-assembly regimes in a sector for which headquarter investments are su¢ ciently important. Under import-and-assembly, the export share of integrated …rms is increasing in headquarter intensity across sectors, consistent with the predictions by Antràs (2003). Under pure-assembly, the relationship between sectoral headquarter intensity and the prevalence of integration is ambiguous. The reason is that when expected hold-up by the assembly plant intensi…es, a foreign client can choose to either own imported inputs or the plant to alleviate the hold-up problem. The optimal organizational structure depends on whether the relative gain of owning assets is larger than that of owning imported inputs or not. Under these circumstances, when headquarter investments become more important, some …rms switch from import-and-assembly to outsourcing under pure-assembly, while some …rms under pure-assembly switch from outsourcing to integration. The net impact on the composition of organizational structures in the pure-assembly regime would depend on the sensitivity of the two "switching" margins to the change in headquarter intensity. We examine these theoretical predictions using detailed product-level trade data collected by China’s Customs. In particular, for each trade regime, we regress the share of exports from vertically integrated plants in total exports at the HS 6-digit level on various measures of the intensity of headquarters inputs. For the import-and-assembly regime, we …nd a positive relationship between the share of integrated plants’ exports and the intensity of headquarters inputs (skill, R&D and capital-equipment). The results are robust when we restrict exports only to the U.S. and to di¤erent country groups based on income levels, as well as when country …xed e¤ects are controlled for. For exports under the pure-assembly regime, no signi…cant relationship is found between the degree of headquarter intensity and integrated plants’exports. For the same regime, we …nd evidence that productivity dispersion and the export share of integrated plants are positively correlated across sectors. These results are consistent with the baseline case of our model when only the most productive …rms integrate with assembly plants under pure-assembly. In the incomplete contracting framework, besides headquarter intensity, the extent to which investments are contractible is also important for foreign …rms’integration decisions. Antràs and Helpman (2008) consider partial contractibility of investments based on their original model (Antràs and Helpman, 2004), and obtain ambiguous predictions of an improvement in contractibility of investments on the propensity to integrate. We thus examine the e¤ects of contractibility of investments across sectors, and …nd that in industries with higher values of headquarter intensity, an increase in contractibility of the supplier’s inputs is associated with a lower share of exports from integrated plants under import-and-assembly. Once again, we …nd no signi…cant relationship under pure-assembly. Our paper is closely related to Feenstra and Hanson (2005) who investigate theoretically and empirically the prevalence of di¤erent ownership structures of export processing plants in China based on the property-rights theory of Grossman and Hart (1986). They …nd that the most common
3
outcome is to have foreign factory ownership but Chinese control over input purchases. They reconcile these …ndings with a model, which predicts that allocating ownership of assets and imported components to di¤erent parties tends to be optimal when value-added in processing activities is higher. They also explore the regional variation in China to show that this split ownership structure is most common in southern coastal provinces where export markets are thicker and courts are relatively e¢ cient. We instead focus on a strand of the literature that studies the relationship between industry characteristics, productivity heterogeneity and the relative prevalence of vertical integration (Antràs, 2003, Antràs and Helpman, 2004, 2008). This literature so far abstracted from the discussion on control rights of imported components, which are particularly relevant for export processing in developing countries. We thus extend the model by Antràs and Helpman (2004) to include investments in component search for assembly and examine the model’s predictions using Chinese data. Moreover, our theoretical prediction of higher pro…tability of concentrated ownership in more headquarter-intensive sectors is consistent with the multi-task framework of Holmstrom and Milgrom (1994), who postulate that it is optimal to assign incentive-complementary tasks to the same agent in a relationship. Using data from a developing country, our paper complements the existing empirical studies on the determinants of arm’s-length trade versus FDI in developed countries. Antràs (2003), Yeaple (2006), Bernard, Jensen, Redding and Schott (2008), and Nunn and Tre‡er (2008a,b) are important precursors in this literature. They examine the e¤ect of headquarters inputs, productivity dispersion and contractibility of inputs on U.S. intra…rm imports as a share of total U.S. imports. Bernard et al. (2008) also include interactions between industry factor intensity and country factor abundance and a new measure of product contractibility based on the importance of intermediaries in international trade. Nunn and Tre‡er (2008b) in a recent paper explore the varying degree of relationship speci…city of di¤erent kinds of physical capital and use new data to account for the fact that a share of U.S. intra…rm imports are shipped from foreign parents of U.S. subsidiaries. Recent studies examine empirically the e¤ects of …rm-level characteristics on the propensity to integrate. Defever and Toubal (2007) and Corcos et al. (2008) provide evidence from France, while Kohler and Smolka (2009) provide evidence from Spain. These studies …nd empirical support for the predictions of productivity ranking across production modes that involve di¤erent ownership arrangements.4 In these empirical studies, imports within multinationals’boundaries are assumed to be shipped from foreign subsidiaries to the headquarters. However, it has been argued that a signi…cant share of the intra…rm imports originates from the foreign headquarters of the U.S. subsidiaries, especially from rich countries (Nunn and Tre‡er, 2008b). Our paper considers exports from export processing assembly plants who produce solely for sales in countries where the headquarters are located. By focusing on exports from the subsidiaries to the multinational headquarters, we hope to obtain cleaner results to validate the existing theoretical models, which have so far placed sourcing decisions by the headquarters in the North at the center of analysis. The paper is organized as follows. Section 2 discusses brie‡y the background of export processing in China. Section 3 develops the theoretical framework for our empirical investigation. Section 4 4 Defever and Toubal …nd that the most productive …rms tend to outsource, while Corcos et al. …nd that the least productive ones outsource. Their …ndings are both consistent with Antràs and Helpman (2004), but require di¤erent assumptions about the ranking of …xed costs associated with di¤erent organizational structures.
4
describes our data source. Section 5 empirically examines our theoretical predictions. The last section concludes.
2
Export Processing in China
In hopes of obtaining foreign technology, boosting employment and economic growth, China implemented various policies to promote exports and foreign direct investments since the early 1980s when economic reforms started. One of the key policies is to provide tax incentives to encourage export processing trade, which has been regulated by China’s Customs under two regimes: pureassembly and import-and-assembly.5 Since then, export processing has been a main driver of the impressive growth of China’s foreign trade. Table 1 shows that export processing accounted for about 55 percent of the volume of total exports from China in 2005, and more than 80 percent of foreign-invested enterprises’exports. Among export processing trade, import-and-assembly is more prevalent. As Table 2 shows, 78 percent of export processing exports was from the import-andassembly regime, under which the Chinese assembly plants retain ownership over imported inputs. Of these import-and-assembly exports, 76 percent was exported from the foreign-invested plants. Of the pure-assembly exports, on the other hand, foreign a¢ liates accounted for about 44 percent. In short, foreign ownership is more prevalent in the import-and-assembly regime, compared to pure-assembly, as pointed out by Feenstra and Hanson (2005). Chinese assembly plants and their foreign clients play di¤erent roles under the two regimes. Under pure-assembly, a foreign …nal-good producer supplies a Chinese assembly plant with intermediate inputs from abroad. The plant then assembles these inputs into …nal products, which are shipped to the foreign client for sales abroad. It is important to note that under this regime, the foreign client owns the inputs throughout the production process. To obtain a license from China’s Customs for trading under this regime, the terms of the transactions need to be speci…ed in written contracts, and to be presented to the Chinese authority in advance for approval.6 Under import-and-assembly, the Chinese plant plays a more active role. Instead of passively receiving materials from the foreign client, an assembly plant searches for intermediate inputs for assembly processing. Importantly, the assembly plant retains ownership of the imported inputs throughout the production process. Di¤erent from a pure-assembly plant, it may purchase the same kind of inputs and use them with multiple foreign …rms. To obtain permission to trade under this regime, assembly plants need to maintain a higher standard of accounting practices and warehouse facilities, relative to a pure-assembly plant. Application for operating a plant under import-andassembly is generally more di¢ cult. Plants are required to make investments in warehouse facilities, inventory and accounting systems (Feenstra and Hanson, 2005). There are several important di¤erences between the two regimes that matter for both our model and empirical analysis. The …rst di¤erence is related to the responsibilities of the Chinese plant, and therefore its investments in human capital. Under pure-assembly, the main role of a Chinese manager is routine assembling. Under import-and-assembly, the plant manager is responsible for 5
Since imports are duty-free, …rms have a great incentive to apply to operate their production units under either of the regimes. Therefore, China’s customs is particularly restrictive about the use of imported materials by the Chinese export-processing plants. Monthly reports need to be delivered to the customs to show that imported materials are used solely for export processing. 6 Readers are referred to Naughton (1996) and Feenstra and Hanson (2005) for a more detailed description about the two regulatory regimes.
5
purchasing materials from abroad and arranging them to be shipped to China. After the shipment, she needs to manage the inventory, and maintain a high standard of warehouse facilities and accounting systems. The second di¤erence is about the ownership of materials. Under pure-assembly, the Chinese plant has no ownership of imported inputs and her outside option is low. Under import-andassembly, the plant owns the imported inputs, and can use the inputs for multiple foreign clients. Her outside option is therefore relatively higher. The third di¤erence has to do with the approval standard. Since import-and-assembly plants are allowed to use domestic inputs together with the imported ones for production, getting approval is generally more di¢ cult. Certain accounting procedures have to be consistently maintained, as value-added taxes can potentially be rebated for inputs that are used entirely for exports. Importantly, transition from one regime to another is quite costly under these circumstances.
3
A Theoretical Model
3.1
Model Setup
To guide our empirical analysis that involves four production modes, we extend the North-South trade model with heterogeneous …rms by Antràs and Helpman (2004). Speci…cally, we include investment decisions for component search activities in processing trade. At a conceptual level, ownership of components should have similar "incentivizing" e¤ects provided by asset ownership. Our theoretical model aims at providing a formal analysis of the determinants of the organizational structure of multinational production when ownership of imported inputs and the plants’ assets are to be chosen. Consider an environment in which all consumers have the same constant elasticity-of-substitution preferences over a number of di¤erentiated products. A …rm that produces a brand of a di¤erentiated product faces the following demand function q = Dp
1 1
;
0
SO = (1 ). SV = [ (1 Notice that for a given organization mode, A obtains a larger de facto bargaining power under import-and-assembly because of her experience and business network acquired from searching for components. Solving the maximization problems of H and A gives operating pro…ts of the joint production unit as Sk = D Sk wN Sk (see appendix), where k and are as above, and Sk is the …xed cost associated with organization mode k under import-and-assembly, and Sk
=
1 1
Sk wN Sk
3.2.3
h
h
+ (1 wS
1
Sk ) a
1 S
1
Sk
h m
: 1
Sk
Choosing Optimal Production Modes
If …xed costs are all identical, the model predicts that all foreign …rms choose outsourcing in assembly-intensive sectors (high a ), and integration in headquarter-intensive sectors (high h ).11 However, we observe di¤erent organizational forms across sectors from the data. Moreover, in practice, di¤erent organizational modes appear to be associated with di¤erent set-up costs. We now consider …xed costs of production that vary across production modes. We assume that H has to incur an identical …xed cost of entry (in terms of North’s labor). Conditional on productivity that is su¢ cient to guarantee non-negative expected operating pro…ts, H chooses a trade regime (N or S) and an organizational form (V or O) for its operation. We denote by fk the …xed costs for organizational form k, where k 2 fV; Og. The ranking of fk is nontrivial. On the one hand, more management e¤ort is needed to monitor overseas employees in an integrated …rm. On the other hand, there may exist economies of scope over managerial activities under vertical integration. Following Antràs and Helpman (2004), we assume that managerial overload from managing overseas employees o¤sets the cost advantage arising from the economies of scope of these activities (i.e., fV > fO ). We denote by gl the …xed costs for operations under trade regime l, where l 2 fN; Sg. We assume that pure-assembly is associated with a higher …xed cost compared with import-and-assembly (i.e., gN > gS ). This assumption requires that establishing a logistic and transport network between the assembly plant and its overseas supplier involves a signi…cant …xed cost.12 Moreover, we assume 11
If we derive the optimal
lk
that maximizes joint surplus (solving h
d lk d lk
= 0 for l 2 fN; Sg ; k 2 fV; Og) we obtain
the folowing. Under import-and-assembly, SV > SO > S for an assembly-intensive sector, which implies h for an assembly-intensive sector, which implies SO > SV . Similarly, under pure-assembly, N V > N O > N NO > NV . 12 Similar to the discussion about the …xed costs for di¤erent organizational forms, economies of scale can lower the transportation costs of components that come directly from the headquarter, instead from multiple suppliers. We assume that these economies of scale are not su¢ cient to o¤set the cost saving from decentralization of component purchasing.
9
that overhead costs of transporting tangible goods are higher than those associated with managing a subsidiary (i.e., gN > fV ) for our baseline analysis. Denoting the …xed costs of production mode kl by kl = fk + gl + , our assumptions imply the following ranking of total …xed costs:13 NV
>
NO
>
SV
>
SO :
(2)
Conditional on staying in the market, H chooses the production mode to maximize expected operating pro…ts of the joint production unit before investments by each party as follows: D;
a
;
h
=
max
l2fN;Sg;k2fV;Og
lk
D;
a
;
h
.
Recall that through asset ownership, vertical integration always enhances the e¤ective share of surplus in a given regime (i.e., N V > N O and SV > SO ). Across regimes, the ranking of the de facto shares is non-trivial. If …ring the manager is very costly (low ) or if component ownership can substantially enhance the owner’s outside option (high ), N O > SV . In developing countries, the export processing plant’s manager usually plays a crucial role in managing and coordinating local sta¤, and component ownership is an important determinant of the owner’s outside option. Supporting these claims, Feenstra and Hanson (2005) argue that the predominance of outsourcing under import-and-assembly in China (see Table 2) is a result of high shares of value-added of processing activities conducted by workers there, which make split ownership over the plant and imported components the optimal sourcing mode. Based on these arguments, we focus on the following ranking of the 0 s as our baseline case:14 NV
>
NO
>
SV
>
SO .
(3)
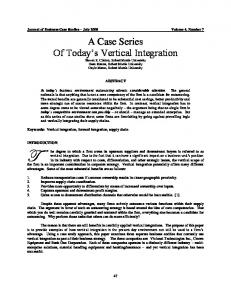
The …nal-good producer’s choices depend on ’s and the …xed costs ’s associated with di¤erent production modes. Let us now turn to the discussion of the ranking of ’s. As outsourcing provides A with a higher incentive to invest, and is associated with a lower …xed cost, outsourcing is always the preferred organization mode within each trade regime in an assembly-intensive sector. Since the …xed cost for outsourcing under pure-assembly is higher than that under import-and-assembly (i.e., N O > SO ), H would consider pure-assembly if and only if …nal-good producers command a su¢ ciently large cost advantage over component search (i.e., N O > SO ). Readers are referred to the appendix for a formal analysis on the conditions under which this inequality holds. Importantly, in an assembly-intensive sector, if N O > SO , more productive …rms would choose pure-assembly whereas the less productive ones would choose import-and-assembly because of the latter’s lower …xed costs. Figure 1, which plots …rm pro…ts against …rm productivity term 1 , illustrates such a scenario under the ranking of …xed costs speci…ed in (2). On the other hand, if assembly plants command a su¢ ciently large cost advantage over component search, SO > N O , import-and-assembly is the only prevalent production mode. 13
We assume that the total …xed costs for each production mode are the sum of various …xed costs. One can argue that economies of scope can also arise from producing in an integrated …rm under pure-assembly, and that N V < SV and N V < N O . To simplify analysis, we do not explore these possibilities in this paper. 14 It is important to note that our testable hypotheses are independent of the assumption that N O > SV . We make this assumption to obtain more tractable comparative statics.
10
π
πNO(Θ) πSO(Θ)
πSV(Θ)
N
SO
-w φ
ΘSO
Θ π (Θ)
ΘNO
NV
-wNφSV -wNφNO -wNφNV
Figure 1: An assembly-intensive sector when
NO
SO
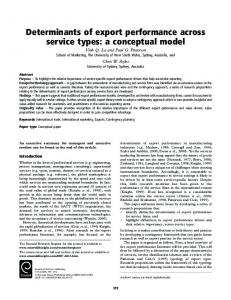
In a headquarter-intensive sector, both integration and outsourcing can be optimal organization modes. Since control and ownership over the components give H extra incentive to invest in headquarter services, pure-assembly is associated with a higher than import-and-assembly. Inequality (3) is then translated into N V > N O > SV > SO . Together with the ranking of …xed costs speci…ed in (2), four production modes can coexist, as depicted in Figure 2. There are four productivity cuto¤s determining the ranges of heterogeneous …rms operating in di¤erent production modes. Firms with productivity term 1 below SO exit, those with productivity parameter between SO and SV outsource under import-and-assembly, those with productivity parameter between SV and N O integrate under import-and-assembly, those with productivity parameter between N O and N V outsource under pure-assembly, and …nally those with productivity parameter above N V integrate under pure-assembly. See the appendix for the expressions of these cuto¤s. To guide our empirical analysis, we now derive the expressions of the export share of integrated plants under each trade regime. To obtain closed-form expressions of these shares, we follow Helpman, Melitz and Yeaple (2004) to assume that is distributed Pareto with shape parameter min , with a cumulative distribution function equal to G ( ) = 1 , where > 2 and min > 0. Since no …rms choose integration in an assembly-intensive sector, the market share of integrated exports is 0.
In a headquarter-intensive sector, the export value from each of the four production modes is positive under the benchmark case. In particular, total export volume of a headquarter-intensive sector is X = D[
SO V
(
SO ;
SV )
+
SV V
where V (A; B) =
(
Z
SV ;
NO)
+
B
dG ( ) =
A
11
NOV
A1
(
NO;
NV )
B1
;
+
NV V
(
N V ; 1)]
π πNV(Θ) πNO(Θ) πSV(Θ)
πSO(Θ) ΘSO -wNφSO
ΘNO
ΘSV
Θ
ΘNV
-wNφSV -wNφNO
-wNφNV
Exit
SO
NO
SV
NV
Figure 2: A headquarter-intensive sector
where
=
min
1
:
Under import-and-assembly, the export share of integrated assembly plants can be expressed as (see appendix for details): 2
6 XSV =6 41 + XSV + XSO
1
1
SO
SV SO
1
SV
1
SV SO
NO SO
3 7 7 5
1
.
(4)
In su¢ ciently headquarter-intensive sectors when all four production modes exist, lV = lO > 1 and is increasing in h for l 2 fN; Sg (see Antràs, 2003). Similarly, with the assumption that > 1 and is increasing in h for l 2 fN; Sg. As such, under import-andN O > SV , N O = SV assembly, the market share of integrated assembly plants exports is increasing in h . This positive relationship is consistent with the main prediction of Antràs (2003). Under pure-assembly, the export share of integrated assembly …rms is given by (see appendix for details): " XN V = 1+ XN V + XN O
NO NV
"
NO NV
1
1
##
1
.
(5)
It is shown in the appendix that under pure-assembly, the relationship between the export share of integrated assembly plants and headquarter intensity is ambiguous. The main determinant of the sign of the relationship is the respective change in the productivity cuto¤s N O and N V . To understand the intuition of the ambiguity, consider a hypothetical exercise that production 12
technology of a sector becomes more headquarter-intensive. On the one hand, the relatively more productive headquarters in the North who used to integrate with their assembly plants under import-and-assembly would switch to outsourcing under pure-assembly. On the other hand, the relatively more productive …nal-good producers in the North who used to outsource their production under pure-assembly would switch to integration within the same regime. Thus, the composition of export shares of the two organization modes under pure-assembly relies on the sensitivity of the margins of production modes to an increase in headquarter intensity of production. In particular, if the e¢ ciency gains (due to changes in the incentives to invest) by obtaining ownership of the plant’s assets are greater than the loss of giving up control rights of imported materials when h increases, the export share of integrated plants would increase (see appendix for details). This ambiguous relationship between the share of integrated plants’ exports and headquarter intensity of inputs under pure-assembly is speci…c to our model, which considers ownership of imported components as an alternative to asset ownership to alleviate the hold-up problem by the export-processing plant. We summarize the relationship between headquarter intensity and the prevalence of vertical integration across sectors by the following testable hypothesis.
Hypothesis 1: Headquarter Intensity and the Prevalence of FDI Given the ranking of …xed costs of production as speci…ed in (2), the share of exports of vertically integrated plants is higher in the more headquarter-intensive sectors under the import-and-assembly regime. Such relationship is ambiguous under the pure-assembly regime, and is absent in an assembly-intensive sector. Our model predicts that in a headquarter-intensive sector, …rms operating under pure-assembly are more productive than those under import-and-assembly. Moreover, only the most productive …rms …nd it pro…table to integrate with their assembly plants under pure-assembly, which involves the highest …xed cost among the four production modes. Regarding di¤erences in heterogeneity across sectors, our model therefore predicts that when the distribution of …rm productivity becomes more dispersed away from the lowest productivity in a sector (i.e., when decreases), the share of integrated plants’exports become more prevalent under pure-assembly, but not necessarily under import-and-assembly. See appendix for a proof. The second hypothesis that we will test in this paper is as follows:
Hypothesis 2: Productivity Dispersion and the Prevalence of FDI Given the ranking of …xed costs of production as speci…ed in (2), in a headquarter-intensive sector, a higher sectoral productivity dispersion is associated with a larger export share of integrated plants’exports under the pure-assembly regime. Such relationship is ambiguous under the import-and-assembly regime, and is absent in an assembly-intensive sector.
4
Data
To examine the determinants of vertical integration in di¤erent trade regimes in China, we use trade data from the Customs General Administration of the People’s Republic of China.15 The data report values in US dollars for imports and exports of over 7,000 products in the HS 6-digit 15
We purchased these data from Mr. George Shen from China Customs Statistics Information Center, Economic Information Agency, Hong Kong.
13
classi…cation (example of a product: 611241 - Women’s or girls’swimwear of synthetic …bres, knitted or crocheted), from and to over 200 destinations around the world, by type of enterprise (out of 9 types, e.g. state owned, foreign invested, sino-foreign joint venture), region or city in China where the product was exported from or imported to (out of around 700 locations), customs regime (out of 18 regimes, e.g. "Processing and Assembling" and "Processing with Imported Materials").16 In this paper we use data for processing trade which is classi…ed according to the special customs regimes "Processing and Assembling" (pure-assembly) and "Processing with Imported Materials" (import-and-assembly). Regular trade is classi…ed by China Customs Statistics according to the regime "Ordinary Trade". Our key dependent variable is the share of vertical integration in total processing exports of a HS 6-digit product in each trade regime (pure-assembly or import-and-assembly). Let p denote product and j industry. V and O represent vertical integration and outsourcing, respectively. Our lV =(X lV + X lO ), is the value of processing exports in trade regime l from dependent variable, Xpj pj pj foreign owned assembly plants as a share of total processing exports in the regime. The Chinese government considers two types of foreign-invested enterprises, fully foreign-owned enterprises and Sino-foreign equity joint ventures, in which according to the Chinese law a foreign partner has no less than 25% of ownership stake. We consider both of these types of enterprises as "foreign owned". Our key independent variables are a number of measures of headquarter intensity. Following the existing empirical literature on the determinants of intra…rm trade, such as Antràs (2003), Yeaple (2006), Bernard et al. (2008) and Nunn and Tre‡er (2008a,b), we use skill and capital intensities as our proxies for the importance of headquarter services in production. The measures of industry factor intensity are constructed using data from the Bartelsman and Gray (1996) data base, averaged across the period 2001-2005.17 Following Nunn and Tre‡er (2008a,b), we use U.S. factor intensities of production, assuming that they are correlated with the corresponding factor intensities in other countries. For each 4-digit SIC industry we use information on total capital, capital-equipment, capital-structures (plant), wages of production workers and non-production workers, and total expenditures on materials. Using this information we construct the measure of skill-intensity, ln(Hj =Lj ); as the log of non-production worker wages divided by total worker wages. Capital intensity (total capital, ln(Kj =Lj ), capital-equipment, ln(Ej =Lj ), and capital-plant, ln(Pj =Lj )) are measured as the natural log of the corresponding capital expenditures divided by total wages. Material intensity, ln(Mj =Lj ), is measured as the log of the cost of materials divided by total workers wages. To check robustness of the results, we construct measures of capital and skill intensity using Chinese plant-level data from the Census of Industrial Firms conducted by the Chinese National Bureau of Statistics in 2004. Due to data limitation, the de…nitions of these factor intensity measures are di¤erent from the US-based benchmark measures. Capital intensity is de…ned as the log ratio of the real value of capital to the real value of output in each sector. Human capital is the log of the share of high-school graduates in the workforce of each sector. We also include R&D intensity to proxy for headquarter’s inputs. The data used to construct R&D intensity are from the Orbis database, which has information for around 60 million companies worldwide. The database is constructed by Bureau van Dijk Electronic Publishing. We measure 16 The data also report quantity, quantity units, customs o¢ ces (ports) where the transaction was processed (97 in total), and transportation modes. 17 We are grateful to Randy Becker from the U.S. Bureau of the Census for providing us with an updated version of the database.
14
R&D intensity, ln(RDj =Qj ), by the natural log of global R&D expenditures divided by …rm sales in each industry. The data are from the most recent year for which …rm level data on R&D are available (either 2006 or 2007). A total of 370 691 plants reported positive R&D expenditure in those two years. To check robustness of our results, we also compute R&D and advertisement intensities using data from the Chinese National Bureau of Statistics’s Survey of Industrial Firms for 2005. R&D intensity is measured by the log average ratio of R&D expenditure to value-added across …rms in each sector. Advertisement intensity is measured by the log average ratio of advertisement expenditure to value-added across …rms in each sector. To capture the contractibility of inputs, we use the sectoral measures from Nunn (2007), which equal the proportion of an industry’s intermediate inputs that are relationship-speci…c and therefore more susceptible to contracting problems. Because we want a measure that is increasing in the completeness of contracts, we use one minus the fraction of inputs not sold on exchanges and not reference-priced. The measures are constructed using information from 1997 US I-O table and Rauch (1999) classi…cation of di¤erentiated and homogeneous products. We also use the measure of industry productivity dispersion from Nunn and Tre‡er (2008a) for 2005. The construction of this measure follows Helpman et al. (2004).18 We use the US productivity dispersion measure, assuming that decisions on the organizational form of the production unit are usually made by headquarters in developed countries. We believe that the US-based measure is a good proxy for productivity dispersion in other developed countries. To check robustness of the results regarding productivity dispersion, we compute the standard deviation of export revenue across Chinese export processing plants in each sector, using …rm-level exports data for 2005 from China’s Customs.
5
Empirical Analysis
In this section, we use detailed product-level export data for China in 2005 to examine the prevalence of FDI versus outsourcing across industries in the two trade regimes of export processing.
5.1
Examining the E¤ects of Headquarter Intensity
To test Hypothesis 1, we start by estimating the following cross-industry regression at the HS 6-digit product level, for each trade regime separately: lV Xpj lV Xpj
+
lO Xpj
=
+
H
ln
Hj Lj
+
K
ln
Kj Lj
+
M
ln
Mj Lj
+
pj ,
(6)
where p stands for product, j stands for industry, and V and O represent vertical integration and outsourcing, respectively. The dependent variable is the share of Chinese exports of a HS 6-digit product in industry j under trade regime l that are from foreign a¢ liates. To proxy for headquarter intensity, we use the measures of skill-intensity ln(Hj =Lj ) and capital-intensity ln(Kj =Lj ) 18
Using …rm sales as a measure of …rm productivity, they construct estimates of the dispersion of …rm productivity using standard deviation of …rm sales across all …rms within an industry. Given the lack of …rm-level data, Nunn and Tre‡er (2008a) construct sales of "notional" …rms using U.S. export data from the U.S. Department of Commerce. They de…ne an industry as an HS6 product and the sales of a notional …rm as the exports of an HS10 good exported from U.S. location l to destination country c. Their measure of productivity dispersion within an industry is the standard deviation of the log of exports of a good from location l to country c. We are grateful to Nathan Nunn for sending us the data for the measure of productivity dispersion of US …rms.
15
described in the previous section.19 Since we are interested in studying the decisions of integration by multinational …rms in the two trade regimes under which the control rights of components are allocated to di¤erent parties, we use material intensity ln(Mj =Lj ) as a proxy for the importance of components in production. is a constant and the error term j is assumed to be uncorrelated with the regressors. To check robustness, we use R&D intensity ln(RDj =Qj ) as an alternative measure of headquarter intensity.20 Hypothesis 1 says that exports from vertically integrated plants account for a larger share of exports in more headquarter-intensive sectors under the import-and-assembly regime, but not necessarily under pure-assembly. Thus, the predicted signs of H and K are positive for the import-and-assembly sample. Estimates of equation (6) for both trade regimes are shown in Table 3. We regress the share of integrated plants’exports in total exports on a number of measures of headquarter intensities. An industry is de…ned as a SIC-87 4-digit category. Mapping of HS 6-digit categories to SIC 4-digit industries is discussed in detail in the appendix. Because our regressors of interest only vary across SIC 4-digit industries, the standard errors are clustered at the SIC 4-digit level to take into account the correlation between observations (HS 6-digit level) within the same SIC category. In columns (1) through (4), we report results for the import-and-assembly regime. The standardized beta coe¢ cients on skill intensity are positive and statistically signi…cant at the 1% level. The impact is also economically meaningful. These coe¢ cients suggest that a one standard-deviation increase in skill intensity is associated with between 0.121 and 0.137 standard-deviation increases in the share of integrated plants’exports, which correspond to 2 to 3 percentage-point increases. These results con…rm the main …ndings by Bernard et al. (2008), Nunn and Tre‡er (2008a,b) and Yeaple (2006), who …nd a positive relationship between skill intensity and the share of intra…rm trade across U.S. manufacturing industries. The size of the coe¢ cients is at the same magnitude of those reported by Nunn and Tre‡er (2008a) for the U.S. For import-and-assembly exports, the coe¢ cients on capital intensity are negative and statistically signi…cant, in contrast with the theoretical predictions of existing theories. Similar to a recent study by Nunn and Tre‡er (2008b), we explore the varying degree of relationship speci…city of di¤erent kinds of physical capital. In Antràs (2003), it is assumed that investments by either party of a trade relationship are completely relationship-speci…c. If the two parties disagree to continue the relationship, the value of the inputs outside the relationship is 0. However, if capital is partially relationship-speci…c, its value outside the relationship is positive, and is decreasing with the speci…city of the capital. Nunn and Tre‡er (2008b) argue that equipment and machinery tend to be more relationship-speci…c, while buildings and plants can be resold and reused for the production of other goods and thus are associated with a higher outside value. Based on this argument, we should expect to …nd di¤erent results for di¤erent types of capital. To this end, instead of adding an overall measure of capital intensity, we include equipment-capital (more relationship-speci…c) intensity, ln(Ej =Lj ), and plant-capital (less relationship-speci…c) intensity, ln(Pj =Lj ) separately in the regressions. In column (3), we …nd that only the coe¢ cient on plant intensity is negative and statistically signi…cant. The coe¢ cient on equipment intensity, on the other hand, is positive but statistically insigni…cant. 19 We also use total employment of each sector as the denominator of each measure of factory intensity instead of total worker wages. Our results are insensitive to the use of these alternative measures. 20 Although conceptually R&D intensity is potentially a better measure, there are issues related with data availability and quality and therefore we use it for robustness checks.
16
Columns (2) and (4) report results when we include R&D intensity as an alternative measure of headquarter inputs. R&D intensity and skill intensity are highly correlated and therefore are not included as regressors simultaneously. Column (2) shows that the coe¢ cient on R&D intensity is positive and statistically signi…cant at the 10% level, and suggests that a one standard-deviation increase in R&D intensity is associated with a 0.069 standard-deviation increase in the share of integrated plants’ exports. The coe¢ cient on R&D intensity is no longer statistically signi…cant when we include equipment-capital and plant-capital intensities separately in column (4). Results for pure-assembly are reported in columns (5) to (8). We …nd in general no statistically signi…cant relationships between the measures of headquarter intensity and the share of integrated plants’exports across sectors, with the exceptions of R&D intensity for which we …nd negative and statistically signi…cant coe¢ cients at the 5% level (columns (6) and (8)). These results are consistent with our theoretical prediction that the relationship between the prevalence of integrated plants’ exports and headquarter intensity is ambiguous for pure-assembly exports. With …rm heterogeneity, the export shares of …rms from the outsourcing and vertical integration modes under pure-assembly both increase when headquarter intensity rises. The share of integrated plants’exports under pureassembly, thus, can rise or fall. Since we are using export shares aggregated across di¤erent importing countries within the same product, the above results may mask substantial di¤erences in importing country characteristics, as well as di¤erences in the relationship between China and these countries, such as di¤erences in distance, institutional and factor endowments. To this end, we repeat the analysis by using unilateral export value in a HS 6-digit product category to each importing country as the unit of observation. Since our focus is on the sectoral determinants of the export share of integrated plants, we control for country …xed e¤ects to parse out the e¤ects of unobserved countries’characteristics. We therefore estimate the following regression: lV Xpjc lV Xpjc
+
lO Xpjc
= dc +
H
ln
Hj Lj
+
K
ln
Kj Lj
+
M
ln
Mj Lj
+
pjc ,
(7)
where c stands for importing country and dc is a set of country …xed e¤ects. The dependent variable is the share of Chinese exports of a HS 6-digit product (p) to country c under trade regime l that are from foreign a¢ liates. Table 4 reports the results. For the import-and-assembly regime (columns (1) to (4)), we …nd a positive and signi…cant relationship between the share of integrated plants’ exports and all measures of intensity of headquarter inputs (skill, R&D and capital-equipment). The coe¢ cients suggest that a one standard-deviation increase in skill intensity is associated with between 0.168 and 0.191 standard-deviation increases in the share of integrated plants’ exports, while a one standard-deviation increase in R&D intensity is associated with about a 0.1 standarddeviation increase in the share of integrated plants’exports. These coe¢ cients are all statistically signi…cant at the 1% level. We again obtain negative coe¢ cients on capital intensity, but in column (3), we obtain a positive and statistical signi…cant coe¢ cient on the intensity of equipment, the more relationship-speci…c type of capital, and a negative and statistically signi…cant coe¢ cient on plant intensity, the type of capital that is less relationship-speci…c. These results support the theoretical prediction that a higher intensity of headquarter inputs, particularly those that are more relationship-speci…c, increases the export share of integrated plants under import-and-assembly. A higher material intensity is found to have a negative impact on the integrated plants’export share (signi…cant at the 5% level in column (3)). Although our theoretical model does not formally discuss the relationship between material intensity and the propensity to vertically integrate, we can 17
still use insights from the property-rights approach to explain the relationship. Under import-andassembly, the control rights over materials are allocated to the assembly plant. Since integration e¤ectively grants a bigger share of expected revenue to the headquarter, it weakens the plant’s incentive to invest in input-search activities. The distortion e¤ects are bigger in more materialintensive sectors, making integration a less preferred organization mode. For pure-assembly (columns (5) to (8)), we …nd negative and signi…cant coe¢ cients on skill intensity and on R&D intensity. While these results should not be taken as a rejection of existing theories on intra…rm trade, they are consistent with our theoretical prediction that the mass of …rms switching from import-and-assembly to pure-assembly outsourcing can be larger than that switching to integration under pure-assembly. In other words, ownership of imported materials can serve as a relatively less costly way to alleviate the hold-up problem by the assembly plant, compared with integration. So far, we have examined exports from China to the rest of the world, regardless of whether the importing countries are developed or not. To obtain a set of empirical results mapping the predictions of a North-South trade model, we should focus on Chinese exports to developed countries. To this end, we conduct regression analyses over samples of low-income countries, high-income countries, and a few selected countries. The results are reported in Table 5. For the import-andassembly regime, we …nd positive and statistically signi…cant coe¢ cients on skill intensity across all country samples. If we restrict exports to low-income countries (column (1)), the magnitude of the coe¢ cient (0.222) is bigger than that for high-income countries (0.125). To address the concern that the US-based factor intensity measures do not re‡ect the intrinsic properties of production, and are speci…c only to the U.S., we focus on exports only to the U.S. in column (3). The results are similar to those in Table 4. In particular, we …nd a signi…cantly positive relationship between capital-equipment intensity and the share of integrated plants’exports. Columns (4) and (5) report consistent results using the samples of exports to Japan and highincome European countries, respectively. In column (6) we exclude exports to Hong Kong from the sample to address the concern that some foreign-owned plants may have their headquarters in Hong Kong, who serve as intermediaries to re-export …nal products to foreign clients. The results are very similar to those when the full sample of countries is used. The lower part of the table reports results for the pure-assembly regime. The results for di¤erent country groups are consistent with those when the full sample is used in column (7) of Table 4. In short, empirical results for Hypothesis 1 are robust to the use of di¤erent country samples. The factor intensity measures we used so far are constructed using data from U.S. manufacturing …rms, based on the assumption that the ranking of these measures is stable across countries. Although this approach has been widely adopted in previous empirical studies,21 we use factor intensity and R&D intensity measures constructed using Chinese …rm-level data, as described in the previous section, to check the robustness of our results. Table 6 reports the regression results using these Chinese-plant-based factor intensity measures. We obtain a positive and signi…cant relationship between skill intensity, R&D and advertisement intensity, and the share of integrated plants’exports under import-and-assembly. The coe¢ cients are signi…cant at the 1% level and of similar magnitude for both measures of headquarters inputs. The results are independent of using 21 The approach of using sector measures constructed using U.S. data originates from Rajan and Zingales (1998). Subsequent empirical studies on countries’ comparative advantage have adopted the same approach. See Romalis (2003), Levchenko (2007), Nunn (2007) and Manova (2007), among others.
18
samples at the country-product level. For pure-assembly exports, the sign of the coe¢ cient on skill intensity turns negative, and those on capital intensity and R&D intensity become insigni…cant. These results are largely consistent with the results obtained when we use US-based measures of factor intensity.
5.2
Examining the E¤ects of Productivity Dispersion
This section investigates the e¤ects of …rm productivity dispersion, and its interactive e¤ects with headquarter intensity, on the prevalence of integrated plants’exports across industries. It is now a well-known fact that …rm productivity di¤ers widely within an industry, and exhibits a ‡at-tail distribution. According to Bernard et al. (2007) and Bernard et al. (2009), the top 1 (10) percent of the U.S. trading …rms accounted for 81 (96) percent of U.S. trade in 2000. Helpman et. al (2004) show that a conceptually valid measure of productivity dispersion is the standard deviation of the log of …rm sales across …rms within an industry. We use the standard deviation of (log) sales across all …rms within an industry in the U.S. j as the empirical counterpart of productivity dispersion, and estimate the following equation to examine Hypothesis 2: lV Xpjc lV Xpjc
+
lO Xpjc
= dc + +
H j
ln
+
Hj Lj j j
+ +
E
ln
Ej Lj
+
P
ln
Pj Lj
+
M
ln
Mj Lj
(8)
pjc ,
where p, j and c stand for product, industry and country respectively. ln (Ej =Lj ) and ln (Pj =Lj ) are the measures of equipment-capital and plant-capital intensity and j is a measure of one of the intensity proxies for headquarter inputs: skill or equipment-capital. We control for importer heterogeneity by including country …xed e¤ects, dc . Hypothesis 2 states that the more productive headquarters choose to integrate with assembly plants in headquarter-intensive sectors, but not in assembly-intensive sectors. Moreover, the model predicts that the most productive …rms choose pure-assembly integration in headquarter-intensive sectors. Thus, we expect > 0 and >0 for the pure-assembly regime. Using the product-country sample, we report the estimates of equation (8) in Table 7. We include all stand-alone headquarter intensity measures as controls, and cluster standard errors at the SIC 4-digit level. Columns (1) and (2) report results for the import-and-assembly regime, while columns (3) and (4) report those for pure-assembly. For import-and-assembly, we do not …nd evidence supporting a positive relationship between sectoral productivity dispersion and the share of integrated plants’exports. While the coe¢ cient on the stand-alone dispersion term is positive and statistically signi…cant when equipment-capital intensity is used for j , the coe¢ cient on the interaction term is negative and statistically signi…cant in column (2). When skill intensity is used as a measure of headquarter intensity, the coe¢ cients are no longer signi…cant. For pure-assembly, when skill intensity is interacted with j , the estimated coe¢ cients on both the dispersion and the interaction terms are positive and statistically signi…cant. When we use equipment-capital intensity to proxy for j , we continue to …nd a strongly positive coe¢ cient on the interaction term. When we restrict the sample to consider only exports to the US, the results reported in columns (7) and (8) show that all coe¢ cients on both the dispersion and the interaction 19
term are positive and statistically signi…cant (at the 1% level). In sum, we …nd that the export share of integrated plants increases in productivity dispersion in sectors with higher headquarter intensity under pure-assembly, supporting Hypothesis 2. The empirical speci…cation above imposes a linear restriction on the relationship between productivity dispersion and the prevalence of integration. To examine the theoretical prediction in a more ‡exible framework, and to identify the cut-o¤ level of headquarter intensity over which productivity dispersion matters, we follow Nunn and Tre‡er (2008) and consider a regression that allows the relationship between …rm heterogeneity and integrated plants’exports to di¤er by quintiles of headquarter intensity. We rank our SIC-1987 4-digit industries by headquarter intensity measured either by skill or by capital-equipment. Then we divide the industries into 5 quintiles of headquarter intensity. We de…ne headquarter intensity quintile dummies as Ijq = 1 if industry j is in quintile q, q = 1 being the least headquarters-intensive quintile. We estimate equation (9) below which includes interaction terms between the quintile dummies and the productivity dispersion measure. The equation includes country …xed e¤ects, headquarter intensity quintile dummies and headquarter intensity controls. The standard errors are clustered at the SIC 4-digit level. The coe¢ cients of interest are q ’s. lV Xpjc lV Xpjc
+
lO Xpjc
= dc + +
5 X q=1
H
ln q Ijq
Hj Lj +
+
5 X
E
ln
q( j
Ej Lj
+
Ijq ) +
P
ln
Pj Lj
+
M
ln
Mj Lj
(9)
pjc ,
q=1
where p, j and c stand for product, industry and country respectively. The results are reported in Table 8. Columns (1) through (4) report results for the importand-assembly regime, while columns (5) through (8) report those for pure-assembly. The average e¤ect across all industries is positive and statistically signi…cant for the pure-assembly regime and is estimated at 0.09 or 0.07 depending on whether we include quintile dummies or not (columns (5) and (6)). This suggests that a one-standard deviation increase in productivity dispersion is associated with an increase in the export share of integrated plants of about 2 percentage points. The coe¢ cient is not statistically signi…cant for the import-and-assembly sample (columns (1) and (2)). Next, we let the e¤ect of productivity dispersion vary depending on the headquarter intensity of the industry. Results for pure-assembly (columns (7) and (8)) show a jump in the magnitude of the positive relationship at around the 4th quintile. The coe¢ cients on the interaction between the quantile dummies and the productivity dispersion measure become positive and statistically significant after the 4th quintile for measures of skill and capital-equipment intensities. There appears to be a cut-o¤ level of headquarter intensity above which productivity dispersion increases the share of integrated …rms exports; for industries below this cut-o¤, there is no signi…cant relationship. Regarding exports under import-and-assembly, we …nd no signi…cant relationship between productivity dispersion and the export share of integrated plants, as suggested by the model (see columns (3) and (4)). As further robustness checks, we also use a Chinese-based measure of productivity dispersion. Our measure of productivity dispersion is the standard deviation of the log of export revenue of 20
export processing plants in each sector in 2005. The results using these measures are reported in Table 9. Under import-and-assembly (columns (1) and (2)), the coe¢ cients on the interaction terms are insigni…cant, while under pure-assembly, we continue to obtain positive and signi…cant coe¢ cients on the interaction terms, supporting the results using the US-based productivity dispersion measures and Hypothesis 2.
5.3
Examining the E¤ects of the Contractibility of Suppliers’Inputs
Antràs and Helpman (2008) relax the assumption that relationship-speci…c investments are completely non-contractible, and allow for varying degrees of contractibility across inputs and countries. An important prediction is that the degree of which the investments are contractible are important determinants of vertical integration by multinationals. Holding headquarter intensity constant, an increased contractibility of the supplier’s inputs, possibly due to an improvement in the legal or property-rights institutions of the supplier’s country, can have surprising e¤ects on the propensity to integrate. Therefore, in this section, we investigate the following hypothesis: Given the ranking of …xed costs of production as speci…ed in (2), consider an improvement in the contractibility of the assembly plant’s inputs. On the one hand, the improvement in the contractibility of inputs implies more tasks being contractible (“Standard E¤ect"). Thus, the motives for integration to reduce the hold-up e¤ects are lessened. On the other hand, because more tasks are contractible, the headquarter is less concerned about the distortion e¤ects of integration on the supplier’s investment incentives (“Surprise E¤ect"). As such, integration becomes preferred even in sectors with a lower headquarter intensity.
Hypothesis 3: Contractibility of Investments and FDI (1) In headquarter-intensive sectors, if the "Standard E¤ect" dominates, the export share of integrated plants’exports decreases in the contractibility of inputs under import-and-assembly. (2) If the "Surprise E¤ect" dominates, the export share of integrated plants’exports increases in the contractibility of inputs under import-and-assembly. (3) The relationship is ambiguous for pure-assembly, and is absent in assembly-intensive sectors. To examine Hypothesis 3, we estimate the following equation: lV Xpjc lV Xpjc
+
lO Xpjc
= dc + +
H
Z Zj
Hj Lj
ln
+
Z
Zj
j
+
E
ln
+
pjc ,
Ej Lj
+
P
ln
Pj Lj
+
M
ln
Mj Lj
(10)
where p, j and c stand for product, industry and country respectively. Zj stands for the contractibility of the assembly plant’s inputs.22 A higher Zj represents a higher degree of contractibility. We adopt the measure of contractibility from Nunn (2007), which equals one minus the share of intermediate inputs for production in a sector that are not sold on an exchange or reference-priced. j is a measure of one of the factor intensities. Hypothesis 3 predicts that Z and Z can be positive or negative for the import-and-assembly regime, depending on whether the "Standard E¤ect" dominates the "Surprise E¤ect" or vice versa. 22
Speci…cally, Nunn (2007) uses the input-output table for the U.S. industries to gauge the extent of the overall market thickness of the upstream sectors of an industry.
21
Table 10 reports estimates of equation (10) for a sample of unilateral exports to each country and for a sample of exports to the US only, both at the HS 6-digit level. Headquarter intensity measures are always controlled for. For pure-assembly exports, we …nd no signi…cant relationship between contract completeness and the prevalence of integration. This is expected for the same reason that headquarter intensity has an indeterminate impact on the prevalence of integration in this regime. For import-and-assembly exports, when capital-equipment intensity is used to measure headquarter inputs, we …nd negative and statistically signi…cant coe¢ cients on the interaction term between input contractibility and headquarter intensity. Thus, an increased contractibility of the supplier’s inputs is found to reduce the export share of integrated plants in the more headquarter-intensive sectors. This result suggests the dominance of the "Standard E¤ect". The results obtained are the same whether we consider the full sample or the sample of exports to the US only. To identify the cut-o¤ level of headquarter intensity over which contract completeness of inputs a¤ects the propensity to integrate, we follow Nunn and Tre‡er (2008a) and consider a regression that allows the relationship between the contractibility of suppliers’inputs and integrated plants’ exports to di¤er by quintiles of headquarter intensity. Similar to our investigation of the nonlinear relationship for productivity dispersion above, we …rst rank our SIC-1987 industries by headquarter intensity. Then we divide the industries into 5 quintiles of headquarter intensity. We estimate equation (11) below which includes interaction terms between the quintile dummies and the contractibility measure. Country …xed e¤ects, headquarter intensity quintile dummies and headquarter intensity controls are included. The standard errors are clustered at the SIC 4-digit level. The coe¢ cients of interest are the Z q ’s. lV Xpjc lV Xpjc
+
lO Xpjc
= dc + +
5 X q=1
H
ln
Hj Lj
q Ijq +
+
5 X
E
ln
Z q (Zj
Ej Lj
+
Ijq ) +
P
ln
Pj Lj
+
M
ln
Mj Lj
(11)
pjc ,
q=1
where p, j and c stand for product, industry and country respectively. The results are reported in Table 11. For import-and-assembly (columns (1) and (2)), we …nd a negative impact on integrated exports from the interaction between input contractibility and headquarter intensity for the top 40% of headquarter-intensive sectors, when equipment-capital intensity is used as proxy for headquarter intensity. For pure-assembly (columns (3) and (4)), no signi…cant relationship is found. These results con…rm the …nding reported above that an increased contractibility of the supplier’s inputs reduces the export share of integrated plants in the more headquarter-intensive sectors under import-and-assembly.
6
Conclusions
This paper uses detailed product-level export data for China to investigate the determinants of integration versus outsourcing. We exploit the coexistence of two regulatory trade regimes for export processing in China, pure-assembly and import-and-assembly, which let us observe the allocation of ownership and control rights over imported inputs between a foreign client and a domestic plant. Under import-and-assembly, Chinese plants have control rights and ownership over the imported materials. Under pure-assembly, ownership over the materials shipped to China 22
remains with the foreign …rm. To examine how choices of organizational structure are a¤ected by the consideration of allocation arrangements of control rights and ownership over components in export processing, we present an extension of the Antràs and Helpman (2004) model to consider component search for assembling. By considering two ownership structures under two trade regimes, our model predicts that headquarter intensity and the prevalence of integration are positively correlated under import-and-assembly. The relationship is ambiguous under pure-assembly. Our empirical results show that when Chinese assembly plants import materials from abroad, the export share of integrated plants is increasing in the intensity of headquarter inputs across sectors, and is decreasing in the contractibility of inputs. These results are consistent with existing theories. However, if Chinese plants engage in pure-assembly (i.e., the foreign …rm has ownership over the materials shipped to China), we …nd no relationship between the prevalence of vertical integration and the intensity of headquarter inputs or the degree of contract incompleteness of inputs. These results are consistent with the model, and are relevant for the situation when ownership of imported components, in addition to asset ownership, can be used to alleviate the hold-up problem by the export-processing plant. Consistent with the sorting of …rms into di¤erent production modes based on productivity, we …nd that an increased productivity dispersion is associated with a bigger export share of integrated plants under pure-assembly, but not under import-and-assembly. In particular, in sectors with higher headquarter intensity, the share of integrated plants’exports increases with …rm productivity dispersion. Our results complement existing …ndings based on the headquarter’s side of the story in developed countries, and validate the predictions of the theoretical literature on incomplete contracting, organizational structure and international trade.
23
7
References 1. Aghion, P. and Tirole, J. (1997), “Formal and Real Authority in Organizations,” Journal of Political Economy, 105(1), 1-29. 2. Antràs, P. (2003), “Firms, Contracts and Trade Structure,”Quarterly Journal of Economics, 118(4), 1375-1418. 3. Antràs, P. (2005), “Incomplete Contracts and the Product Cycle,” American Economic Review, 95(4), 1054–1073. 4. Antràs, P. and E. Helpman (2004), “Global Sourcing,”Journal of Political Economy, 112(3), 552-580. 5. Antràs, P. and E. Helpman (2008), “Contractual Frictions and Global Sourcing,”in E. Helpman, D. Martin and T. Verdier eds., The Organization of Firms in a Global Economy, Harvard University Press. 6. Bartelsman, E. J. and W. Gray (1996) “The NBER Manufacturing Productivity Database,” Technical Working Paper No. 205, National Bureau of Economic Research. 7. Bernard, A., J. Jensen and P. Schott (2009), “Importers, Exporters and Multinationals: A Portrait of Firms in the U.S. that Trade Goods,” in Dunne, T. and J.B. Jensen and M.J. Roberts eds., Producer Dynamics: New Evidence from Micro Data, University Of Chicago Press. 8. Bernard, A., J. Jensen, S. Redding and P. Schott (2007a), “Firms in International Trade,” Journal of Economic Perspectives, 21(3), 105–130. 9. Bernard, A., J. Jensen, S. Redding and P. Schott (2008), “Intra…rm Trade and Product Contractibility,” Mimeo, Yale School of Management.
10. Conconi, P., P. Legros and A. F. Newman, (2008), “Trade Liberalization and Organizational Change,” CEPR Discussion Paper No. 7028. 11. Corcos, G., D. Irac, G. Mion and T. Verdier (2008), “The Determinants of Intra-Firm Trade,” Centro Studi Luca D’Agliano Working Paper No. 267. 12. Defever, F. and F. Toubal (2007), “Productivity and the Sourcing Modes of Multinational Firms: Evidence from French Firm-Level Data,” CEP Discussion Paper No. 842. 13. Feenstra R. and G. Hanson (2005), “Ownership and Control in Outsourcing to China: Estimating the Property-Rights Theory of the Firm,” Quarterly Journal of Economics 120(2), 729-761. 14. Grossman, G. and E. Helpman (2002), “Integration versus Outsourcing in Industry Equilibrium,” Quarterly Journal of Economics 117(1), 85-120. 15. Grossman, G. and E. Helpman (2003), “Outsourcing versus FDI in Industry Equilibrium,” Journal of the European Economic Association, 1(2-3), 317–327. 16. Grossman, G. and E. Helpman (2004), “Managerial Incentives and the International Organization of Production,” Journal of International Economics, 63, 237–262. 24
17. Grossman, G. and E. Helpman (2005), “Outsourcing in a Global Economy,” Review of Economic Studies, 72(1), 135–159. 18. Grossman, S. and O. Hart (1986), “The Costs and Bene…ts of Ownership: A Theory of Vertical and Lateral Integration,” Journal of Political Economy, 94(4), 691-719. 19. Helpman, E. (2006), “Trade, FDI, and the Organization of Firms,” Journal of Economic Literature, 44, 589-630. 20. Helpman, E., M. Melitz, and S. Yeaple (2004) “Export versus FDI with Heterogeneous Firms,” American Economic Review, 94(1), 300–316. 21. Holmstrom, B. and Milgrom, P. (1994), “The Firm as an Incentive System,” American Economic Review, 84(4), 972–991. 22. Hummels D., J. Ishii and K. Yi (2001), “The Nature and Growth of Vertical Specialization in World Trade,” Journal of International Economics, 54(1), 75-96. 23. Kohler W. and M. Smolka (2009), “Global Sourcing Decisions and Firm Productivity: Evidence from Spain,” CESifo Working Paper No. 2903. 24. Levchenko, A. (2007), “Institutional Quality and International Trade,” Review of Economic Studies, 74(3), 791-819. 25. Manova, K. (2007), “Credit Constraints, Heterogeneous Firms and International Trade,” Mimeo, Stanford University. 26. Marin D. and T. Verdier (2008), “Power Inside The Firm and The Market: A General Equilibrium Approach,” Journal of the European Economic Association, 6(4), 752-788. 27. Marin D. and T. Verdier (2009), “Power in the Multinational Corporation in Industry Equilibrium," Economic Theory, 38(3), 437-464. 28. McLaren, J., (2000), “Globalization and Vertical Structure,” American Economic Review, 90(5), 1239-1254. 29. Naughton, B. (1996), “China’s Emergence and Prospects as a Trading Nation,” Brookings Papers on Economic Activity, 2: 1996, 273-343. 30. Nunn, N. (2007), “Relationship-Speci…city, Incomplete Contracts, and the Pattern of Trade,” Quarterly Journal of Economics, 122(2), 569-600. 31. Nunn, N. and D. Tre‡er (2008a), “The Boundaries of the Multinational Firm: An Empirical Analysis”, in E. Helpman, D. Martin and T. Verdier eds., The Organization of Firms in a Global Economy, Harvard University Press. 32. Nunn, N. and D. Tre‡er (2008b), “Incomplete Contracts and the Boundaries of the Multinational Firm,” Mimeo, Harvard University. 33. Ornelas, E. and J. Turner (2009), “Protection and International Sourcing,” Mimeo, LSE. 34. Puga D. and D. Tre‡er (2003) “Knowledge Creation and Control in Organizations," NBER Working Paper No. 9121.
25
35. Rajan, R. and L. Zingales (1998), “Financial Dependence and Growth,”American Economic Review, 88(3), 559-586. 36. Rauch, J. (1999), “Networks versus Markets in International Trade,”Journal of International Economics, 48(1),7–35. 37. Romalis, J. (2003), “Factor Proportions and the Structure of Commodity Trade,” American Economic Review , 94(1), 67-97. 38. Yeaple, S. (2006), “O¤shoring, Foreign Direct Investment, and the Structure of U.S. Trade”, Journal of the European Economic Association 4(2-3), 602–611.
26
A
Appendix
Deriving Firm Pro…ts under Pure-Assembly Under pure-assembly, H invests in both component search and headquarter services. The cost of component search is N , while wages in the North and South are wN and wS , respectively. Since investments are not contractible ex ante, anticipating ex post bargaining, H maximizes her expected operating pro…ts as: max
N
N k R (m; a; h)
m;h
wN h;
m
Under pure-assembly, A’s maximization problem is max (1
wS a.
N k ) R (m; a; h)
a
For a given organizational form k 2 fV; Og, solving the …rst order conditions of the headquarter’s problem and the assembly plant’s problem simultaneously gives the pro…t-maximization investment levels a , h and m in terms of wS , wN , , , D, ’s and importantly, N k . 23 . Plugging the privately optimal investment levels into the joint pro…t function, we obtain …rm 1 , N k is the …xed cost associated operating pro…t as N k = D N k wN N k , where with organization mode k under pure-assembly, and Nk
1
=
h
Nk
+
m
1
Nk
N
h
Nk
=
h
1
h
!
+
p
d d
Nk Nk
Nk) h
wN
Nk
reaches its maximum when
!
+ (1 a
wS
1
The function
m
Nk
a
.
1
Nk
= 0. Solving this equation yields
a (1
! ( h )) (1 2! ( h ) 1
!(
h )) (1
(1
h )))
!(
;
0 m h . Notice h > 0, which is an essential property for determining where ! h = 1 N the ex-ante optimal choice of production mode.
Deriving Firm Pro…ts under Import-and-Assembly Under import-and-assembly, H invests only in headquarter activities. The cost of component search is S , while wages in the North and South are wN and wS , respectively. Since investments are not contractible ex ante, anticipating ex post bargaining, H maximizes her expected operating pro…ts as: max h
wN h
Sk R (m; a; h)
A’s maximization problem is max (1
23
h
"
m=
m
"
a
1
Nk
wS
a
wN
Nk Nk
a
wN
Nk
a
1
wS
NkD
h 1
m
h
NkD
1
#
1
m
S
Sk ) R (m; a; h)
a;m
#
1 1
S
;w a =
1
27
a
(1
Nk) Nk
wS a
m "
a
wS
a
wN
Nk
1
Nk
NkD
h 1
m
#
1 1
; wN h =
For a given organizational form k 2 fV; Og, solving the …rst order conditions of the headquarter’s problem and the assembly plant’s problem simultaneously gives the pro…t-maximization investment levels a , h and m in terms of wS , wN , , , D, ’s and importantly, Sk . 24 . Plugging the privately optimal investment levels into the joint pro…t function, we obtain …rm 1 operating pro…t as Sk = Sk Sk ; m ; h D wN Sk , where and a
Sk ;
Sk
h
;
1
=
h
Sk
+ (1
m
The function
Sk
h h
S
=
1
h
1
1
Sk
d d
reaches its maximum when
+
h
1
Sk
.
h
wN
1
Sk
= 0, which implies
Sk Sk
p
a
wS
1 1
Sk )
h (1
h ) (1 h)
2 (1
h ) (1
h ))
(1
1
Notice that S0 h > 0, which is an essential property for determining the ex ante optimal choice of production mode. The Analysis on the Conditions for N k > Sk To examine when N k > Sk for a given organization mode k; let us focus on a constant component intensity m for simplicity. N k > Sk if the following inequality holds:25 m
N
'
S
where '
;
h
h
= 1
m
+
(
+ (1
h
h
Sk ;
h)
h
) 1
1
Nk;
,
(12) 1
m
h+ m
h
)1
(1
m
and
;
h
h + (1 h 1 ) 1 (1 )1 . This inequality is more likely to hold if the …nal-good producer commands a bigger cost advantage over component search (i.e., N = S is smaller).26 Otherwise, if S < N , H’s bargaining power associated with outsourcing under pureassembly needs to be signi…cantly bigger than that under import-assembly (i.e., N O >> SO ) for (12) to hold. For instance, if control rights over components greatly enhance A’s outside option (i.e., high ), N O can be much bigger than SO . Importantly, in su¢ ciently headquarter-intensive sectors (i.e., h is su¢ ciently large), both ' and are increasing in and ' > except when is very small.
Deriving Expressions of the Market Share of Integrated Firms Under Each Trade Regime Recall that for a headquarter-intensive sector, total export value when all four production 24
m =
h
Sk
1 25
Sk
m
"
"
h
1
wS
a
wN
h
m
Sk
1
Sk
1
Sk h
wS
a
wN
D1
h
m
Sk
1
Sk
Sk
D1
We obtain this inequality by rearranging
#
#
1 1
; wS a =
a
"
h
1
wS
a
wN
Sk
1
Sk
Sk
D1
h
m
#
1 1
; wN h =
1
Nk
1
. Nk;
a
;
h
>
Sk
Sk ;
a
;
h
for a given organizational mode
k. 26
Notice that both ' and are non-monotonic in for low value of h . In particular, in an assembly-intensive sector (i.e., when h is small), cuts ' from above at > 1=2, after which both and ' are decreasing in .
28
h
=
modes exist is Z X = D = D[
1
R ( ) dG ( )
SO
SO V
(
SO ;
SV )
+
SV V
where V (A; B) =
Z
(
SV ;
NO)
+
B
NOV
(
NO;
A1
dG ( ) =
NV )
+
NV V
(
N V ; 1)]
B1
A
where = min 1 . The productivity cuto¤s (production mode margins) can be solved using a set of indi¤erence a; h = a ; h ) as conditions (e.g. SV N O ; D; NO N O ; D; B
=
SO
SO SO
B(
=
SV
SO )
SV SV
B(
=
NO
SO SV )
NO NO
B(
=
NV
SV NO)
NV NV
NO
where B = wN =D. Export value of each production mode can be expressed in terms of the productivity cuto¤s as: XSO = D
SO
XN O = D
NO
1 SV 1 NV
1 SO 1 NO
;
XSV = D
;
XN V = D
1 SV 1 NV
SV NV
1 NO
;
(13)
:
We can express the market share of integrated plants exports under import-and-assembly as XSV XSV + XSO
= =
1+ "
1
XSO XSV
1+
SV
2
6 = 6 41 +
1
1
1
SO
#
1 SV 1 NO
1 SO 1 SV
SO
SV SO
1
SV
1
SV SO
NO SO
3 7 7 5
The market share of integrated plants exports under pure-assembly is XN V XN V + XN O
= =
1+ "
1+
XN O XN V
1
NO
NO
NV
NV
29
1
1
!#
1
.
1
Proof of Hypothesis 1 The market share of integrated plants’ exports under import-andassembly is given in (4). In su¢ ciently headquarter-intensive sectors, all four production modes exist and lV = lO > 1 and is increasing in h for l 2 fN; Sg (see Antràs, 2003). Similarly, with the assumption that N O > SV , N O = SV > 1 and is increasing in h for l 2 fN; Sg. It follows that
d
d
h
NO SO
> 0,
d
d
NO SV
h
7 0,
d
d
statics, it is straightforward to show that
h
SV SO
< 0,
XSV XSV +XSO
d
d
h
NV NO
7 0. Using these comparative
in (4) is increasing in
h.
The market share of integrated plants exports under pure-assembly is given in (5). Since the sign NV of ddh is ambiguous, the market share of integrated assembly plants under pure-assembly NO is ambiguous. To understand what factors may drive the export share of integrated plants to NO increase, consider ddh , that is the key determinant of the sign of the relationship between NV this share and headquarter intensity across sectors. We …nd that sgn d ( NV = NO) d h d ( SV = N O ) d h
>
NV
1
=
NO
SV
=
1
NO
d d
h
is positive if
NO NV
, and negative otherwise. This inequality is more likely to hold if the
e¢ ciency gains (due to changes in the incentives to invest) by obtaining ownership of the plant’s asset is greater than the loss of giving up control rights over imported materials. Proof of Hypothesis 2 Let us denote the variance of can be shown that dV d < 0.
by V =
2 min (
1)
2
(
2)
1
. It
SV is indeterUsing (4), and that SV = SO > 1 and N O = SO > 1, the sign of dd XSVX+X SO minate. NV NV Using (5), and that N V = N O > 1, it can be shown that dd XN X < 0 (i.e., XN X V +XN O V +XN O is increasing with the variance of ).
Data Appendix The concordance …le for mapping SIC87 (4-digit) codes to HS-6 digit codes is taken from Peter Schott’s website. We use the new concordance of 1989-2008 US HS codes to US SIC, SITC and NAICS codes over time, based on exports.27 When more than one SIC code is identi…ed for a HS6 code (it happens for 371 HS6 codes out of 5203 in manufacturing industries), the SIC code that covers the most HS8 categories within the HS6 code is used. For some cases, a HS6 code has multiple SIC codes tied in the number of HS8 categories shared (it happens for 208 cases). In those situations, we choose the SIC category that has the highest number of HS6 categories under it as the unique map. 27
http://www.som.yale.edu/faculty/pks4/sub_international.htm
30
Table 1: Export Shares Across Trade Regimes (2005) US $1 billion Share of total exports Share of exports by FOE
Total processing 416.48 54.70% 80.60%
Pure-assembly 83.97 11.00% 50.00%
Import-and-assembly 332.51 43.60% 88.30%
Source: Chinese export data from the Customs General Administration of the People’s Republic of China
Table 2: Export Shares of the 4 Ownership x Trade Production Modes (2005)
Component Search
Pure-assembly (N) Import-and-assembly (S)
Organizational Forms Integration (V) Outsourcing (O) 9.67% 12.22% 59.71% 18.40% 69.38% 30.62%
21.89% 78.11%
Source: Chinese export data from the Customs General Administration of the People’s Republic of China
Table 3: Headquarter Intensity and the Export Share of Vertically Integrated Plants (HS6 level) Trade Regime: Skill Intensity, ln(H/L) Capital Intensity, ln(K/L)
(1) 0.121*** (2.998) -0.104** (-2.237)
R&D Intensity, ln(RD/Q) Material Intensity, ln(M/L) Equipment Intensity, ln(E/L) Plant Intensity, ln(P/L) N No. clusters R2
3496 348 .032
Import-and-assembly (2) (3) 0.137*** (3.238) -0.142*** (-3.719) 0.069* (1.954) -0.085* (-1.721) 0.068 (1.108) -0.123** (-2.470) 3376 3496 317 348 .024 .041
(4)
0.060 (1.636) -0.073 (-1.433) -0.004 (-0.065) -0.100* (-1.908) 3376 317 .029
(5) -0.066 (-1.533) -0.026 (-0.804)
2769 331 .004
Pure-assembly (6) (7) -0.081* (-1.892) 0.002 (0.064) -0.070** (-2.169) 0.024 (0.585) -0.117* (-1.961) 0.072 (1.114) 2660 2769 300 331 .005 .008
Dependent Variable: China’s foreign-a¢ liated plants’exports as a share of total exports under each trade regime. An observation is a 6-digit HS product category. Standardized beta coe¢ cients are reported. t-stats based on standard errors clustered at the SIC4 level are in parentheses. *p