Table 1-1: Key Phase II/III studies assessing the safety and immunogenicity of ...... formulations, including the licenced group B vaccine Bexsero® (4CMenB), ...
Genotypic and Phenotypic Assays to Improve Strain Coverage Assessments of Sub-Capsular Meningococcal Vaccines
Stephen Andrew Clark A thesis submitted in partial fulfilment of the requirements of the Manchester Metropolitan University for the degree of Doctor of Philosophy (PhD)
School of Healthcare Science, Manchester Metropolitan University.
2018
Collaborating Establishment: Meningococcal Reference Unit Public Health England Manchester Royal Infirmary Manchester, UK. 1
Contents Contents ..................................................................................................................................... ii List of Tables ............................................................................................................................. vii List of Figures ............................................................................................................................ ix Abbreviations ............................................................................................................................ xi Abstract ................................................................................................................................... xiii Declarations............................................................................................................................. xiv Publications arising from this work .......................................................................................... xv Acknowledgements ................................................................................................................. xvi 1.0
BACKGROUND .................................................................................................................1
1.1
Invasive Meningococcal Disease......................................................................... 1
1.1.1
Invasive Meningococcal Disease in the Pre-Vaccine Era ............................. 1
1.1.2
Clinical Features .......................................................................................... 2
1.1.3
Laboratory Diagnosis ................................................................................... 4
1.1.4
Treatment .................................................................................................... 5
1.2
Neisseria meningitidis: Cellular Features and Virulence Factors ....................... 6
1.2.1
Polysaccharide capsule................................................................................ 6
1.2.2
Porins........................................................................................................... 7
1.2.3
Lipooligosaccharides ................................................................................... 8
1.2.4
Pili ................................................................................................................ 8
1.2.5
Opacity proteins .......................................................................................... 9
1.2.6
IgA protease ................................................................................................ 9
1.2.7
Other virulence factors.............................................................................. 10
1.2.8
The meningococcal genome ..................................................................... 10
1.3
Colonisation and Carriage ................................................................................ 11
1.3.1
Mechanisms of Colonisation ..................................................................... 11
1.3.2
Transmission and Carriage in the Population ............................................ 12
1.4
Pathogenesis ..................................................................................................... 13
1.4.1
Traversing the Epithelium.......................................................................... 13
1.4.2
Traversing the BBB..................................................................................... 14
1.5
Immunity .......................................................................................................... 14 ii
1.5.1
Innate Immunity and the Complement System ........................................ 14
1.5.2
Acquired Immunity and Serum Bactericidal Antibody (SBA) Activity ....... 16
1.6
Typing and Surveillance .................................................................................... 18
1.6.1
Grouping.................................................................................................... 18
1.6.2
Typing and Subtyping ................................................................................ 18
1.6.3
Immunotyping ........................................................................................... 19
1.6.4
Population Typing ...................................................................................... 19
1.6.5
Whole Genome Analysis ........................................................................... 20
1.7
Epidemiology .................................................................................................... 21
1.7.1
Group A ..................................................................................................... 21
1.7.2
Group C...................................................................................................... 24
1.7.3
Group W .................................................................................................... 26
1.7.4
Group Y ...................................................................................................... 27
1.7.5
Group B ..................................................................................................... 28
1.8
Meningococcal Vaccines ................................................................................... 30
1.8.1
Capsular polysaccharide antigens and T-cell independent immunity ...... 30
1.8.2
Polysaccharide conjugates and T-cell dependent immunity ..................... 32
1.8.3
Outer Membrane Vesicles Vaccines .......................................................... 34
1.8.4
Recombinant Protein Vaccine Antigens .................................................... 36
1.8.5
Recombinant Antigen Vaccines ................................................................. 43
1.8.6
Predicting Vaccine Strain Coverage and Assessing Impact ....................... 48
1.9
IMD Surveillance in England and Wales ........................................................... 52
Thesis Objectives and Structure .................................................................................. 56 2.0
METHODS AND MATERIALS ..........................................................................................57
2.1
Storage and culturing of N. meningitidis isolates ............................................. 57
2.1.1
Storage of meningococcal isolates ............................................................ 57
2.1.2
Culturing meningococci on agar plates ..................................................... 57
2.1.3
Preparation of meningococcal liquid suspensions .................................... 57
2.2
Storage and handling of clinical specimens...................................................... 58
2.2.1
Storage of clinical specimens .................................................................... 58
2.2.2
Handling of clinical specimens .................................................................. 58
2.3
Preparation, quantification and storage of DNA extracts ................................ 58 iii
2.3.1
Extraction of DNA from meningococcal isolates ....................................... 58
2.3.2
Extraction of DNA from clinical specimens ............................................... 58
2.3.3
Quantification of DNA ............................................................................... 59
2.3.4
Collation of non-culture DNA extracts for fHbp genotyping ..................... 60
2.3.5
Storage of DNA extracts ............................................................................ 60
2.4
Polymerase chain reaction ............................................................................... 60
2.4.1
Primer preparation and storage ................................................................ 60
2.4.2
Preparation of PCR reaction master mix ................................................... 60
2.4.3
Addition of DNA extracts and use of thermal cycler. ................................ 61
2.4.4
Gel electrophoresis of PCR products ......................................................... 61
2.4.5
Clean-up of PCR products.......................................................................... 63
2.5
Optimisation and analysis of fHbp PCR assay ................................................... 63
2.5.1
Primer selection and design ...................................................................... 63
2.5.2
Primer optimisation .................................................................................. 64
2.5.3
Assessment of fHbp PCR assay sensitivity ................................................. 65
2.5.4
ctrA-specific real-time PCR analysis of analytical sensitivity extracts ....... 66
2.5.5
Specificity of fHbp PCR sequencing assay ................................................. 68
2.6
Optimised fHbp PCR parameters ...................................................................... 71
2.6.1
Final primer selection for fHbp genotyping .............................................. 71
2.6.2
Finalised fHbp PCR parameters ................................................................. 71
2.6.3
Sequencing master mix and reaction ........................................................ 73
2.6.4
Clean-up of sequencing products ............................................................. 73
2.6.5
Electrophoretic analysis of sequencing products ..................................... 74
2.6.6
fHbp sequence analysis ............................................................................. 74
2.7
fHbp genotyping data analysis ......................................................................... 75
2.7.1
Clinical specimen, isolate and patient information ................................... 75
2.7.2
Analysis of fHbp genotyping data.............................................................. 75
2.8
Selection of non-culture specimens for SureSelect XT assessment ................. 76
2.8.1
Selection of non-culture specimens .......................................................... 76
2.8.2
Estimation of DNA concentration within clinical specimens .................... 76
2.9
SureSelect XT bait design, target enrichment and sequencing ........................ 77
2.9.1
RNA bait design ......................................................................................... 77 iv
2.9.2 2.10
DNA extraction and enrichment of DNA libraries ..................................... 77 Analysis of specimen-derived genomic data ................................................ 78
2.10.1 Estimation of genome coverage and median read depth ......................... 78 2.10.2 Comparison of isolate and specimen-derived genomes ........................... 78 2.11
MEASURE assay strains, stocks and reagents ............................................... 79
2.11.1 Strains used for assessment of MEASURE assay ....................................... 79 2.11.2 Preparation of bacterial GC glycerol broth stocks ..................................... 80 2.11.3 Preparation of 1% (w/v) Bovine Serum Albumin in PBS ........................... 81 2.11.4 Preparation of 1% (v/v) Paraformaldehyde in PBS .................................... 81 2.11.5 Preparation of GCK broth for meningococcal cultivation ......................... 81 2.12
Assessing the killing effectiveness of PFA/PBS ............................................. 81
2.12.1 “Dilution” method ..................................................................................... 81 2.12.2 “Centrifugation” method .......................................................................... 82 2.13
Finalised MEASURE assay protocol and data analysis .................................. 83
2.13.1 Overnight growth on GC agar.................................................................... 83 2.13.2 Liquid culturing of meningococci .............................................................. 83 2.13.3 Assay Day Three (cell staining and acquisition) ........................................ 84 2.13.4 Analysis of MEASURE results data ............................................................. 87 3.0
RESULTS .........................................................................................................................88
3.1
The development of a non-culture fHbp genotyping assay ............................. 88
3.1.1
Primer selection and optimisation ............................................................ 88
3.1.2
Assessment of analytical sensitivity .......................................................... 94
3.1.3
Correlative Taqman® analysis of analytical sensitivity extracts ................ 98
3.1.4
Specificity of the fHbp PCR assay ............................................................ 100
3.2
An analysis of fHbp peptide sub-variant distribution among non-culture
confirmed IMD cases: 2011-2015 ............................................................................. 103 3.2.1
Laboratory confirmed IMD cases: Jan 2011 to Dec 2015 ........................ 103
3.2.2
Overview of fHbp genotyping and variant group distribution. ............... 107
3.2.3
Distribution of common fHbp peptide variants ...................................... 109
3.2.4
Representativeness of group B isolates .................................................. 113
3.3
Whole genome sequencing from non-culture specimens ............................. 115
3.3.1
Specimen selection ................................................................................. 115 v
3.3.2
Genome coverage and depth of coverage of specimen-derived genomes 117
3.3.3
Gene-by-gene comparison of isolate and specimen-derived genomes.. 119
3.3.4
Predicted utility of SureSelect XT system for characterisation of non-
culture cases confirmed in England and Wales. .................................................... 122 3.4
Transfer of the MEASURE Assay ..................................................................... 124
3.4.1
Assessing killing effectiveness of 1% PFA/PBS ........................................ 124
3.4.2
Assessing the impact of agar type used during production of GC glycerol
broth
129
3.4.3
Inter-laboratory comparison of MEASURE controls ................................ 131
4.0
DISCUSSION .................................................................................................................134
4.1
Development and validation of fHbp PCR sequencing assay ......................... 134
4.2
An analysis of fHbp peptide sub-variant distribution among non-culture
confirmed IMD cases: 2011-2015 ............................................................................. 137 4.3
DNA enrichment and genomic analysis of non-culture IMD specimens ........ 140
4.4
Assessment and transfer of the MEASURE assay ........................................... 143
4.5
Conclusions and further work ........................................................................ 147
5.0
REFERENCE LIST ...........................................................................................................150
6.0
APPENDICES ................................................................................................................188
Appendix I: The isolates used to determine the conservation of the fHbp primer sites and to identify prospective primer candidates. ........................................................ 189 Appendix II: Isolates used for fHbp PCR assay optimisation and the determination of the analytical sensitivity ............................................................................................ 190 Appendix III: eBURST and SplitsTree diagrams of fHbp PCR assay validation panel strains. ....................................................................................................................... 190 Appendix IV: Validation panel of 96 isolates/clinical specimen pairs selected to approximate the strain diversity among invasive meningococci in England and Wales. ................................................................................................................................... 198 Appendix V: fHbp genotyping results for validation panel of 96 isolates/clinical specimen pairs. ......................................................................................................... 199 Appendix VI: Discrepant NEIS alleles among the specimen and isolate. .................. 200
vi
List of Tables Table 1-1: Key Phase II/III studies assessing the safety and immunogenicity of 4CMenB. ......................................................................................................................................... 45 Table 2-1: Standard PCR master mix reagent volumes for PCR reactions. ..................... 61 Table 2-2: Sequences and working concentrations of primers/probes within ‘wet’ mastermix duplex Taqman® assay. .................................................................................. 67 Table 2-3: Sequences and working concentrations of primers/probes within lyophilised, quadruplex Taqman® assay. ............................................................................................ 68 Table 2-4: N. lactamica isolates used to assess primer site conservation. ..................... 70 Table 2-5: Oligonucleotide primers used for genotyping of fHbp. ................................. 72 Table 2-6: Thermal cycler parameters used during fHbp PCR analysis. .......................... 72 Table 2-7: Sequencing master mix reagent volumes for fHbp genotyping. .................... 73 Table 2-8: Thermal cycler parameters used during fHbp sequencing reactions. ........... 73 Table 2-9: Strains used for assessment of MEASURE assay. ........................................... 80 Table 2-10: Staining reagents used in MEASURE assay. .................................................. 84 Table 3-1: Estimated DNA concentration and number of meningococcal genomes per microliter for each extract dilution of the analytical sensitivity panel. .......................... 94 Table 3-2: ctrA-specific Ct values of diluted isolate DNA extracts using ‘wet’ Taqman assay. ............................................................................................................................... 99 Table 3-3: ctrA-specific Ct values of diluted isolate DNA extracts using lyophilised Taqman assay................................................................................................................... 99 Table 3-4: Number of laboratory-confirmed IMD cases in England and Wales by calendar year and confirmation method: 2011 to 2015. .............................................. 103 Table 3-5: No and proportion of each capsular group within culture and non-culture cases for each calendar year.......................................................................................... 104 Table 3-6: The number and proportion of non-culture IMD cases with sufficient DNA extract and/or clinical specimen available for fHbp genotyping by calendar year. ...... 107 Table 3-7: Clinical specimens selected for evaluation of SureSelectXT system with corresponding clinical isolate information. ................................................................... 116 Table 3-8: Results for sequencing of specimen-derived genomes and read alignment against human and meningococcal references. ............................................................ 118 vii
Table 3-9: Genomic properties of specimen and isolate-derived meningococcal genomes and allelic data for common typing targets. .................................................. 120 Table 3-10: Estimated meningococcal DNA load of non-culture specimens and predicted outcome of non-culture WGS. ...................................................................... 123 Table 3-11: Meningococcal growth following up to 60 minutes incubation in 1% PFA. ....................................................................................................................................... 125 Table 3-12: Meningococcal growth following up to 80 minutes incubation in second 1% PFA batch. ...................................................................................................................... 125 Table 3-13: Meningococcal growth following up to 60 minutes incubation in third 1% PFA batch. ...................................................................................................................... 125 Table 3-14: Meningococcal growth following up to 20 hours incubation in PFA011. .. 126 Table 3-15: Meningococcal growth following 16 hours incubation in PFA012 and PFA013........................................................................................................................... 127 Table 3-16: Meningococcal growth following 16 hours in five newly-prepared PFA batches. ......................................................................................................................... 128 Table 3-17: Meningococcal growth following 16 hours in 11 week-old or 21 week-old 1% PFA. .......................................................................................................................... 129 Table 3-18: MFI values, means and 95% confidence intervals (CI) for strains tested using MEASURE assay at PHE MRU. ....................................................................................... 131
viii
List of Figures Figure 1-1: A map of Africa with The Meningitis Belt highlighted. ................................. 23 Figure 1-2: Number of IMD cases confirmed by PHE MRU from 1998/99 to 2016/17 by capsular group. ................................................................................................................ 25 Figure 1-3: Distribution of predominant hyper-invasive CCs amongst group B isolates in E&W between 2010 and 2016. ....................................................................................... 29 Figure 1-4: A schematic representation of the fHbp peptide (variant 1.55) as expressed from the surface of the meningococcal outer membrane. ............................................. 38 Figure 1-5: Number of IMD cases confirmed by PHE MRU from 1998/99 to 2016/17 by method of confirmation .................................................................................................. 54 Figure 2-1: Configuration of staining plate during primary staining in the MEASURE assay. ............................................................................................................................... 85 Figure 3-1: PCR products from four isolates after 35 cycles using fhbpRd2F and fHbpRd2R. ....................................................................................................................... 91 Figure 3-2: PCR products using round-two fHbp primers on 2% agarose gel following optimisation of PCR cycle number. ................................................................................. 92 Figure 3-3: PCR products following a single PCR round (35 cycles) with fHbpouterF and fHbpouterR using extracts from four isolates. ................................................................ 93 Figure 3-4: PCR products following fHbp PCR round one reaction using diluted extracts from the seven isolates of the analytical sensitivity panel. ............................................ 95 Figure 3-5: PCR products following 25 µL fHbp PCR round two reactions using 1 µL, 2 µL and 5 µL of PCR round one product for extract dilutions 10-5, 10-6, 10-7 and 10-8 as DNA template. ................................................................................................................. 97 Figure 3-6: PCR products following nested fHbp PCR reactions using 10-7 and 10-8 DNA extracts. ........................................................................................................................... 98 Figure 3-7: Comparative alignment of the fHbpRd2R PCR primer (3’ to 5’) against (A) the majority of isolate genomes within the MRF MGL (921/923) and (B) a small number (2/923) of MRF MGL genomes as well as genomes from two of the six N. lactamica isolates........................................................................................................................... 101 Figure 3-8: The proportions of culture and non-culture-confirmed group B, group Y, group W cases and all cases combined, stratified by patient age group. ..................... 106 ix
Figure 3-9: fHbp variant group distribution among typed culture and non-culture strains belonging to different capsular groups or non-groupable strains (NG). ........... 108 Figure 3-10: The proportion of culture or non-culture typed group B strains from each calendar year which are represented by eight common fHbp variants. ....................... 110 Figure 3-11: The distribution of fHbp variants among English and Welsh isolates by CC. ....................................................................................................................................... 112 Figure 3-12: The representativeness of group B isolates amongst all typed group B strains in different age groups....................................................................................... 114 Figure 3-13: Mean MEASURE MFI values for nine strains when the GC glycerol broth was produced from overnight grown on GC and CBA. ................................................. 130 Figure 3-14: Box and whisker plots showing comparison of MEASURE results between PHE MRU and a collaborating laboratory for seven control strains. ............................. 133
x
Abbreviations BBB BIGSdb bp BSA BSA/PBS CBA CC CI CSF Ct DNA dsDNA ELISA fH fHbp GC GCK hSBA IMD LOS MAC MATS Mbp MEASURE MFI MLEE MLST ML MRF MGL MSC NadA NCBI NHBA OD OMV Opa OPA Opc PATH PBS PBT PCR PE PFA PFA/PBS
Blood-brain barrier Bacterial Isolate Sequence Database Base pair(s) Bovine Serum Albumin 1% (w/v) Bovine Serum Albumin in Phosphate-buffered Saline Columbia blood agar Clonal complex Confidence intervals Cerebro-spinal fluid Cycle threshold Deoxyribonucleic acid Double-stranded DNA Enzyme-linked immunosorbent assay Complement Factor H Factor H-binding protein Gonococcal (broth or agar) Gonococcal broth with 1% Kelloggs supplement and 1% NaHCO3 Serum bactericidal antibody assay (using human-derived complement) Invasive meningococcal disease Lipooligosaccharide Membrane attack complex Meningococcal Antigen Typing System Mega base pair (million bp) Meningococcal Antigen Surface Expression (assay) Mean fluorescence intensity Multilocus enzyme electrophoresis Multilocus sequence typing Molecular ladder Meningitis Research Foundation’s Meningococcal Genome Library Microbiological safety cabinet (Class I) Neisseria adhesin A National Center for Biotechnology Information Neisserial heparin binding antigen Optical density Outer membrane vesicle Opacity-associated protein A Opsonophagocytic activity Opacity-associated protein C Programme for Appropriate Technology in Health Phosphate-buffered saline Positive bactericidal threshold Polymerase chain reaction Phycoerythrin Paraformaldehyde 1% v/v Paraformaldehyde in Phosphate-buffered saline xi
PHE MRU PMN PV rMLST RP RT RV rSBA SBA SLV ST SWGA TBE tfp UCL VR WGS
Public Health England’s Meningococcal Reference Unit Polymorphonuclear leukocyte Phase variation Ribosomal multilocus sequence typing Relative potency Room temperature (18-25 °C) Routine vaccinations Serum bactericidal antibody assay (using rabbit-derived complement) Serum bactericidal antibody Single-locus variant Sequence type Selective whole genome amplification Tris-Borate EDTA Type IV pilus/pili University College London Variable region Whole genome sequencing
xii
Abstract The licensure of recombinant protein-based meningococcal vaccines has increased the complexity of strain coverage assessments. In 2015, the 4CMenB vaccine was introduced into the UK national infant immunisation schedule and an Enhanced Surveillance programme was launched by Public Health England’s Meningococcal Reference Unit. Meningococcal isolates, representing ~50% of laboratory-confirmed cases, are comprehensively characterised using whole genome sequencing and 4CMenB strain coverage is assessed phenotypically using the Meningococcal Antigen Typing System. For the remaining cases, which are confirmed using PCR only, strain characterisation was until recently restricted to geno-grouping and geno-subtyping. The purpose of this research was to establish new genotypic assays to improve strain coverage assessment among non-culture cases, as well as introduce the MEASURE assay to predict coverage of a second sub-capsular vaccine, rLP2086, among isolates. A PCR sequencing assay targeting the Factor H-Binding Protein antigen gene (fHbp) was developed and had an estimated analytical sensitivity limit of between 600ag/µL and 6fg/µL. Using this assay, fHbp was successfully sequenced from 1510 of the 1661 PCRpositive clinical samples tested (91%). The distributions of fHbp peptide variants among culture and non-culture strains were compared and, whilst differences were observed for a small number of predominant variants, the distribution was very similar within each capsular group. The prospect of performing WGS directly from non-culture specimens was investigated using the Agilent SureSelectXT system. Eight of ten clinical specimens yielded genomes of acceptable quality. It was estimated that up to 54% of non-culture cases could be sequenced using this technique, however, the financial cost is currently prohibitive. Finally, the MEASURE assay was risk assessed and overnight formaldehyde incubation was introduced to ensure cells were fully fixed. The assay results were similar to those generated in a collaborating laboratory, however, further standardisation may be required. These assays will help to increase the accuracy of strain coverage predictions of the currently-licenced and future sub-capsular meningococcal vaccines.
xiii
Declarations This research was sponsored by Pfizer Vaccine Research (objectives 1, 2 and 4) and GlaxoSmithKline (objective 3).
Except where stated otherwise by reference or acknowledgment, the results presented herein are entirely my own. No part of this work has been submitted in support of candidature for any other degree or diploma.
Stephen Clark
xiv
Publications arising from this work Much of the following work has been published in the following peer-reviewed articles: Clark, S. A., Lucidarme, J., Newbold, L. S. and Borrow, R. (2014) ‘Genotypic Analysis of Meningococcal Factor H-Binding Protein from Non-Culture Clinical Specimens.’ PLoS ONE, 9(2) p. e89921. Clark, S. A., Lekshmi, A., Lucidarme, J., Hao, L., Tsao, H., Lee-Jones, L., Jansen, K. U., Newbold, L. S., Anderson, A. S. and Borrow, R. (2016) ‘Differences between culture & non-culture confirmed invasive meningococci with a focus on factor H-binding protein distribution.’ Journal of Infection. 73(1) pp. 63–70. Clark, S. A., Doyle, R., Lucidarme, J., Borrow, R. and Breuer, J. (2017) ‘Targeted DNA enrichment and whole genome sequencing of Neisseria meningitidis directly from clinical specimens.’ International Journal of Medical Microbiology. 308 (2), pp.256–262.
Some of the following passages may bear minor resemblances to text within these articles. Excepting minor corrections/suggestions from co-authors, each of these articles was written solely by me and all words used are my own.
xv
Acknowledgements I’d like to thank anyone who has supported me throughout the past five years. Double thanks go to my directors of study Lisa Lee-Jones and Val Edwards-Jones and to my supervisory team Lynne Newbold and Ray Borrow who couldn’t have been more supportive and have never been too busy to provide guidance and feedback. Triple thanks go to Ray and the MRU/VEU for the fantastic opportunities I was given to share my work at conferences at home and abroad. I am very grateful to Steve, Ash, Xilian and everyone in the MRU/VEU for their friendship and motivation, especially Tony who insisted on calling me “Dr Clarky” from day one! I would particularly like to express my gratitude to Jay Lucidarme without whom I am sure this process would have been ten times more difficult. He was often my first port of call when I had a question/issue/crisis and he never once grumbled at being subjected to 20-50 questions a day. I am eternally grateful to Pfizer and GSK for funding the projects. Thank you to all the good people at Pearl River especially Liesa Anderson, Lisa McNeil, Paul Liberator, Nate Lambert and Jakob Loschko for being so friendly and welcoming on my visit to the US and generally being great people to work with. Many thanks also to Ronan Doyle and Judy Breuer at UCL who were fantastic collaborators. Finally I would like to thank my family, particularly my fiancé Anna whose support and motivation did not waiver, even though she had no idea what I was talking about.
xvi
1.0 BACKGROUND 1.1 Invasive Meningococcal Disease 1.1.1 Meningococcal Disease in the Pre-Vaccine Era Invasive Meningococcal Disease (IMD) is an umbrella term used to describe the many maladies that can occur as a result of infection by the bacterial pathogen Neisseria meningitidis, also referred to as the meningococcus. Accounts of outbreaks resembling meningococcal infections date back to the late 17th century (Tyler, 2010). Vivid descriptions of outbreaks in 1806 in Geneva and 1806-1810 in the towns of New England illustrate the fear and confusion caused by the fulminant and deadly symptoms (Vieusseux, 1805; North, 1980; Tyler, 2010). In an 1810 review of local epidemics of the deadly ‘spotted fever’, Nathan Strong, a physician from Hartford, Connecticut, described cases of “a violent delirium” along with head pain and dark purple spots that would not recede under pressure. Writing of the disease, which peaked in the winter and spring months, Strong confessed to being “ignorant of its nature, mode of attack, or the weapons with which it might be most successfully combated” (Strong, 1810). The meningococcus was first isolated and described in a Viennese laboratory in 1887. A pathologist named Anton Weichselbaum grew the bacterium in pure culture from six cases of epidemic cerebo-spinal meningitis. Weichselbaum had named the organism Diplococcus intracellularis to reflect the appearance and location of the bacterium upon initial observation (Weichselbaum, 1887). In 1891, Quincke developed the lumbar puncture technique which facilitated the isolation of the meningococcus from cerebrospinal fluid (CSF) (Tyler, 2010). In the first decade of the twentieth century, epidemics in Great Britain, the US and Canada featured fatality rates as high as 70-90% (Flexner, 1913). The work of pathologists such as George Jochmann and Simon Flexner led to the development of serum therapies. Flexner, a pathologist based in New York, studied the progression of the disease in animal models and developed antiserums by inoculating horses with 1
meningococcal cultures. After introduction of his antisera in 1907, fatality rates among the treated were reduced to 20-45% (Flexner, 1913). Following the onset of the First World War in 1914, outbreaks in meningococcal disease were common place among the army camps of all countries. Consequently, the use of serum therapies increased in popularity. In 1916, Harold Amoss developed an agglutination method for the standardisation of meningococcal anti-serum (Amoss and Wollstein, 1916). It was from this early work that the first meningococcal typing systems arose, which subsequently led to the development of the first polysaccharidebased vaccines (Branham, 1953; Vipond et al., 2012). The development of Sulphonamides in the 1930’s also helped to reduce fatality rates, particularly during the Second World War. Resistance to Sulphadiazine first emerged in the early 1960’s and led to the wide-spread adoption of beta-lactam antibiotics for treatment of IMD (Millar et al., 1963). In 1923, the first edition of Bergeys Manual of Determinative Bacteriology was published and referred to the organism as Neisseria intracellularis . Whilst other binomials were used, this was the most commonly-used name for many years. In 1948, the sixth edition of Bergey’s Manual used Neisseria meningitidis as the preferred name and, in 1963, the Judicial Commission of the International Committee on Bacteriological Nomenclature unanimously accepted Neisseria meningitidis as the official binomial for the meningococcus (Breed et al., 1948; International Committee on Bacteriological Nomenclature, 1963). 1.1.2 Clinical Features The most common clinical presentation of IMD is rapid onset meningitis which occurs in around 60-70% of cases (European Centre for Disease Prevention and Control, 2012). Meningitis is defined as an infection of the meninges, the fine membranes that surround the brain and spinal column. As the bacterium penetrates the blood-brain barrier (BBB), it proliferates in the CSF eliciting damaging inflammatory responses. Initial symptoms vary widely from case to case, however, patients typically present with one or more of the following: headache, fever, nausea/vomiting, joint stiffness, light 2
sensitivity and confusion. Infants may also exhibit lethargy, irritability, poor feeding and raised fontanelles (Hart and Thomson, 2006; Brouwer et al., 2010). Perhaps one of the most characteristic aspects of the disease is the speed at which it can progress. Once invasion has occurred, bacterial load can increase rapidly and in many cases the patient's condition can become critical within hours of the onset of the initial symptoms (Hackett et al., 2002b). Meningococcal septicemia, or meningococcaemia, can occur as the primary IMD manifestation (~ 30% of cases) or in conjunction with meningitis (~20% of cases) (European Centre for Disease Prevention and Control, 2012). The proliferation of bacteria within the bloodstream in many cases results in septicaemic shock characterised by severe inflammatory reactions leading to vascular damage and circulatory shutdown, often within 24 hours. In the first 12 hours of disease progression, general septicaemic symptoms such as cold, painful limbs and abnormal skin colouration may be observed along with a non-blanching petechial rash. If untreated, the disease can progress to disseminated intravascular coagulation manifested as purpura fulminans, severe cutaneous haemoraging and skin/limb necrosis (Tzeng and Stephens, 2000; Hart and Thomson, 2006; Pace and Pollard, 2012; Strelow and Vidal, 2013). The activation of host inflammatory factors can result in vascular injury and damage to the cerebral tissues, leaving survivors with limb loss, deafness, seizures and motor and/or cognitive deficits, among other sequelae (Weber and Tuomanen, 2007; Karve et al., 2011). A 2010 meta-analysis of 132 studies found there to be a 9.5% median risk of at least one sequela following recovery from meningococcal meningitis (Edmond et al., 2010). Other less common forms of IMD include pneumonia, conjunctivitis, pericarditis and septic arthritis, often developing after meningitic/bacteraemic episodes (Stephens et al., 2007). Fatality rates can vary substantially and disease outcome is often influenced by a range of factors such as the age of the patient, strain virulence, host genetic polymorphisms as well as the timing of symptom recognition and antimicrobial treatment. In developed countries, case fatality rates of between 5-10% are commonly reported 3
(Hahné et al., 2006; Gray et al., 2006; Trotter et al., 2007b; Ladhani et al., 2012b; Baccarini et al., 2013; Sadarangani et al., 2015). This figure, however, may be much higher in resource-poor settings or during outbreaks (Rouaud et al., 2006; Smith et al., 2006; Ceyhan et al., 2012; Strelow and Vidal, 2013). 1.1.3 Laboratory Diagnosis Confirmation of suspected IMD cases is typically achieved through the isolation of N. meningitidis from an otherwise sterile bodily site. Isolates are commonly obtained from the blood and/or CSF, using venipuncture and/or lumbar puncture, respectively. Blood culture bottles are usually supplemented with culture medium and incubated at 35-37 °C (with 5% CO2). Samples are subsequently sub-cultured onto agar and streaked for single colony isolation (World Health Organization, 2011). N. meningitidis can grow on a variety of media, however, blood (sheep, horse or goat) or chocolate agars are typically used. The organism is non-haemolytic and, on blood agar, colonies appear round, grey and convex with a defined edge and a glistening surface. Meningococcal colonies exhibit a similar morphology when grown on chocolate agar; however they may appear slightly larger (World Health Organization, 2011). Laboratories use a variety of different methods to confirm IMD depending upon the type of sample attained. For CSF samples, attempted culturing is often performed in parallel to cytological examination of the specimen. CSF turbidity and pleocytosis, especially increased numbers of polymorphonuclear leukocytes (PMNs), are indicative of bacterial meningitis. Gram staining of the CSF contents may help to identify bacterial cells within the sample. Meningococcal cells may be observed within PMNs and appear as ‘coffee-bean’-shaped diplococci (World Health Organization, 2011) Oxidase, catalase and carbohydrate utilization tests may be employed to differentiate isolated organisms from other common Neisseria species (World Health Organization, 2011). N. meningitidis is oxidase and catalase positive and can oxidise glucose and maltose, but not lactose and sucrose. Further phenotypic confirmation may be
4
provided using methods targeting meningococcal-specific antigens (Lucidarme et al., 2011b). Many laboratories have developed real-time polymerase chain reaction (PCR)-based assays to amplify meningococcal deoxyribonucleic acid (DNA) directly from clinical specimens (Taha and Fox, 2007). These assays consist of DNA primers and probes specific to sequences within conserved meningococcal genes (e.g. ctrA, sodC, crgA) (Guiver et al., 2000; Thomas et al., 2011; Taha, 2000). This strategy allows laboratory confirmation without the need for in vitro culture of the organism. This is particularly invaluable as many specimens do not yield a culturable isolate (Heinsbroek et al., 2013). 1.1.4 Treatment In the UK, urgent hospital admission of suspected bacterial meningitis or meningococcal septicaemia patients is recommended (National Institute for Health and Care Excellence, 2010). Those with a non-blanching rash (i.e. suspected septicaemia) or those who cannot be immediately hospitalised should be administered a single dose of parenteral benzylpenicillin, ideally intravenously, prior to admission. The dosage ranges from 300 mg to 1200 mg depending on patient age (National Institute for Health and Care Excellence, 2010). Following admission, third generation cephalosporins, such as Ceftriaxone, are the preferred treatment. Cefotaxime plus either amoxicillin or ampicillin should be administered to children younger than 3 months of age (National Institute for Health and Care Excellence, 2010). Due to the speed of disease progression, prompt antimicrobial therapy is important in suspected IMD cases. A 2006 meta-analysis found a positive association between preadmission antimicrobial treatment and reduced mortality (Hahné et al., 2006) and further work has shown that delays in receiving such treatment are likely to influence case fatality rates (Proulx et al., 2005).
5
1.2 Neisseria meningitidis: Cellular Features and Virulence Factors N. meningitidis is a non-motile, gram-negative, facultative anaerobe found within the class Betaproteobacteria. The organism is an exclusively human pathogen and the nasopharyngeal tract represents its primary reservoir (Stephens, 2009). The bacterium possesses many features that contribute to its survival within this niche and the potential for invasion of host tissues. 1.2.1 Polysaccharide capsule One of the predominant features of the meningococcal cell is the polysaccharide capsule. The chemical composition of the polysaccharide capsule is the basis of the principal system of categorisation within the species: the Group. Traditionally referred to as serogroup, the classification system was developed throughout the twentieth century using serological methods (Craven et al., 1978). The term ‘genogroup’ may also be used when the determination has been achieved through genetic characterisation. There are 12 different capsular groups (A, B, C, E, H, I, K, L, X, W, Y, Z) and of these, six cause the vast majority of disease (A, B, C, W, X and Y) (Harrison et al., 2009). The capsular polysaccharides of group B, C, W and Y contain sialic acid. Group B and C capsules are composed entirely of sialic acid with α2>8 and α2>9 linkages, respectively (Bhattacharjee et al., 1975). Group W and Y polysaccharides contain alternating units of D-galactose or D-glucose and sialic acid, respectively (Bhattacharjee et al., 1976). Group A and X are composed of repeating sub-units of N-acetyl-D- mannosamine-1phosphate and N-acetylglucosamine 1-phosphate, respectively (Liu et al., 1971; Apicella and Robinson, 1972). The genes responsible for capsular synthesis and expression (termed cps) are well characterised for all groups (Harrison et al., 2013). Despite significant differences in polysaccharide composition, the different loci are remarkably well conserved between these groups. All loci can be divided into six regions (A-D, D’ and E) each containing two to nine genes. Region A contains the genes responsible for polysaccharide biosynthesis and constitutes the majority of the diversity between the different capsular groups. The fourth gene within this region (cs, siaD, mynA) encodes the polysialyltransferase, 6
which determines the capsular composition. The polysialyltransferase gene of group B and C strains exhibit ~60% similarity whilst ~98% homology is seen between this gene among group Y and W strains (Claus et al., 1997). The translated peptides of the group W and Y polymerases are consequently very similar and a single amino acid (310) determines the specificity to galactose or glucose, respectively (Claus et al., 2009). Due to these similarities, a small proportion of invasive strains express capsular polysaccharide composed of sialic acid with both D-glucose and D-galactose which, in some cases, cross-react with both anti-Y and anti-W sera (personal correspondence, Dr Steve Gray, PHE MRU). Group A polysaccharides are naturally O-acetylated by the O-acetyltransferases encoded by the csaC gene (mynC). Groups C, W and Y polysaccharides, however, can be O-acetylated or non-O-acetylated at the sialic acid residues. In the UK, O-acetylation was seen among ≥70% of invasive group C and Y strains, whilst only a small proportion (8%) of group W strains are O-acetylated (Borrow et al., 2000; Longworth et al., 2002; Balmer et al., 2002). In group C organisms the O-acetyltransferase is encoded by the cssE gene (oatC) and in group W and Y organisms by cssF (oatWY) (Claus et al., 2004; Harrison et al., 2013). Regions B and C contain genes involved in the transport and membrane translocation of the high-molecular weight polysaccharide. The remaining regions are involved in lipooligosaccharide (LOS) synthesis and sialylation (Harrison et al., 2013). 1.2.2 Porins Of the many surface proteins expressed by meningococci, the major porins, PorA (class I) and PorB (class II or III), are the most abundant and both expressed by the majority of meningococcal strains (Feavers et al., 1996; Law et al., 2014). As with many gramnegative porins, both PorA and PorB exhibit a trimeric 16-stranded β-barrel peptide structure and allow the translocation of hydrophilic molecules in and out of the cell (Derrick et al., 1999). Although coded from a same locus within the genome, there is notable sequence variation between class II and class III PorB peptides (PorB2 and PorB3, respectively), with PorB3 much more closely related to porins of other Neisseria species (e.g. PorB1a of Neisseria gonorrhoeae) (Derrick et al., 1999). 7
Due to the abundance of PorA on the cell surface, it is one of the most immunodominant antigens with convalescent antibodies specific to exposed epitopes, particularly to loop IV (Van der Ley et al., 1991; Idänpään-Heikkilä et al., 1995). In encapsulated strains, PorA binds to the C4 binding protein (C4bp) complement inhibitor, increasing serum survival (Jarva et al., 2005). Similarly, PorB2 is able to bind the alternative complement pathway regulator Factor H (fH), reducing C3 deposition and serum susceptibility (Lewis et al., 2013). 1.2.3 Lipooligosaccharides The LOS is a major feature component of the meningococcal cell membrane and is crucial to its structural integrity. The LOS maintain the negative charge of the membrane and is an important moderator of the host immune response (Unkmeir et al., 2002b). Meningococcal LOS is cytotoxic and can cause host endothelial monolayer dysfunction and cytoskeletal reorganisation (Slanina et al., 2011). The imbedded inner core structure principally consists of acylated Lipid A, whilst the outer portion contains variable α and β oligosaccharide chains (Kahler and Stephens, 1998). Lipid A is relatively well conserved between strains, however, inner core structural variation can significantly impact host immune response and disease progression. LOS with six fatty acyl chains on the Lipid A moeity (hexa-acylated) are strongly associated with invasive strains, in contrast to those with five acyl chains (penta-acylated), which exhibit decreased toll-like receptor 4-mediated induction of cytokines by macrophages (Fransen et al., 2010; Rodenburg et al., 2012; John et al., 2016). Structural modifications to the inner core (e.g. sialylation) also correlate with invasive potential and aid immune survival (Klein et al., 1996; Ram et al., 2003; Plant et al., 2006; Lewis et al., 2012; Unkmeir et al., 2002b), whilst the addition of phosphoethanolamine can increase adherence to host cells (Takahashi et al., 2008). 1.2.4 Pili Pili are filamentous organelles composed of peptide polymers that protrude many micrometres from the cell surface. Pili are indispensable during initial epithelial attachment, however, the precise mechanisms of these interactions are not yet fully understood (Nassif et al., 1994; Pujol et al., 1997; Kirchner and Meyer, 2005; Exley et 8
al., 2009). N. meningitidis expresses Type IV pili (tfp), the principal structure of which consists of repeating PilE subunits arranged in a helical configuration around a hydrophobic core (Giltner et al., 2012). PilE undergoes extensive antigenic variation through positive immune selection and inter-genomic recombination mediated by multiple silent homologous genes (pilS) (Andrews and Gojobori, 2004). Whilst this variation can influence interactions with host cell receptors, PilC, located at the pilin tip, also appears to play a key role in the epithelial cell adherence (Nassif et al., 1994; Rahman et al., 1997; Källström et al., 1998; Morand et al., 2009). Additionally, the minor pilin PilX plays an essential role in meningococcal aggregation during colonisation (Hélaine et al., 2005). 1.2.5 Opacity proteins The Opacity proteins Opc and Opa are surface exposed adhesins that mediate binding to and invasion of host epithelial and endothelial cells (Virji et al., 1993; de Vries et al., 1996; Muenzner et al., 2000; Johswich et al., 2013) as well as interactions with phagocytic cells (McNeil and Virji, 1997). Opc expression can also aid serum resistance through the binding of vitronectin, a repressor of the late complement pathway (Griffiths et al., 2011; Hubert et al., 2012). 1.2.6 IgA protease The IgA protease autotransporter can be an important determinant of invasive potential by cleaving the heavy chain of IgA1 immunoglobulins preventing antibodymediated clearance (Plaut et al., 1975). In many hyper-invasive strains (e.g. ST-11 complex), these Type V autotransporters feature specific nuclear localisation signals, which facilitate entry into the nucleus of epithelial cells and cleavage of the NF-κB transcriptional regulator resulting in apotosis of the host cell (Besbes et al., 2015). Furthermore, IgA protease-mediated cleavage of LAMP1, a major component of lysosomes, promotes intracellular survival of invasive strains (Lin et al., 1997; Ayala et al., 2001).
9
1.2.7 Other virulence factors Within the host, the sequestration of extra-cellular iron, usually in the form of Transferrin, Lactoferrin or Haemoglobin/Haptoglobin, is achieved via specific sets of cognate receptors (i.e. TbpAB, LbpAB, HpuAB and HmbR ), which are important for survival and virulence in vivo (Perkins-Balding et al., 2004; Renauld-Mongenie et al., 2004; Lucidarme et al., 2013b). Other potential virulence factors include NalP, a phase variable autotransporter which is involved in cleavage of host complement/meningococcal outer membrane proteins and plays an important role in biofilm formation (Roussel-Jazédé et al., 2010; Del Tordello et al., 2014; Perez-Ortega et al., 2017), Meningococcal surface fibril (also termed NhhA) which mediates adhesion and down regulation of the host complement cascade (Griffiths et al., 2011), and the adhesins MspA and App (Hill et al., 2010). 1.2.8 The meningococcal genome The meningococcal genome is approximately 2.2 x 10⁶ base pairs (bp) in length, organised in a typical circular chromosome (Parkhill et al., 2000). N. meningitidis is naturally transformable, readily receiving exogenous DNA from its environment. There is strong genomic evidence of horizontal exchange, incorporating DNA from other nasopharyngeal neisserial species such as N. lactamica (Linz et al., 2000; Lucidarme et al., 2011a), as well as other co-habiting genera such as Haemophilus (Kroll et al., 1998). This transformation is made more efficient by the presence of a 10-12 base pairs (bp) DNA uptake sequence, observed at over 2000 loci within the genome (Treangen et al., 2008). As a result, meningococcal genomes typically feature many artefacts of recombination, which represents a primary driver of diversity within the species (Jolley et al., 2005). Many important meningococcal virulence genes are subject to phase variation (PV), allowing changes in their expression. This is achieved through slipped-strand mispairing of homopolymeric nucleotide tracts either within the open-reading frame or in the flanking gene promoter affecting transcription and/or translation (Sarkari et al., 1994; Berrington et al., 2002; Oldfield et al., 2013; Lucidarme et al., 2013b). This selective 10
control of expression levels can facilitate colonisation or invasion of the host and avoidance of the immune responses (Tauseef et al., 2013; Alamro et al., 2014; de Vries et al., 1996; Hubert et al., 2012). Transformation of heterologous neisserial DNA has been found to increase PV frequency (Alexander et al., 2004) and there is evidence that PV frequency and general mutability is influenced by the functionality of the mismatch repair enzyme DNA adenine methyltransferase (dam) (Bucci et al., 1999). A similar study, however, found no such link but mismatch repair proteins MutS and MutL were shown to be important regulators of PV frequencies (Richardson and Stojiljkovic, 2001; Colicchio et al., 2006).
1.3 Colonisation and Carriage 1.3.1 Mechanisms of Colonisation Transmission of the meningococcus occurs through direct contact with oral or nasal secretions or inhalation of air-borne droplets (Tzeng and Stephens, 2000). The colonisation of the nasopharynx begins with the aggregation of the bacterial cells and subsequent adherence to nasopharyngeal tissues, particularly non-ciliated columnar cells. Both of these actions are facilitated by tfp through inter-bacterial PilX:PilX interactions and PilC-mediated binding to host receptors (such as CD46), respectively (Stephens et al., 1983; Read et al., 1995; Källström et al., 1998; Hélaine et al., 2005). The attachment of tfp is followed by the formation of microcolonies on the apical surface leading to close interactions between outer membrane adhesins (e.g. Opc, Opa, TspA, NadA) and host cell receptors such as CD66a (Billker et al., 2000; Comanducci et al., 2002; Oldfield et al., 2007; Virji et al., 1993; Johswich et al., 2013). The expression of sialic acid-based capsules can, however, mask these adhesins and reduce epithelial attachment (Stephens et al., 1993; Hammerschmidt et al., 1996; Bartley et al., 2013). Furthermore, the glycosylation of pili can lead to detachment of meningococcal cells, facilitating the colonisation of neighbouring tissues (Chamot-Rooke et al., 2011). Recent work also suggests that a filamentous bacteriophage, MDAΦ, promotes aggregation and compensates for the lack of piliation in the upper layers of the adherent biomass (Bille et al., 2017) 11
The formation of meningococcal biofilms on respiratory epithelial cells has been demonstrated in vitro using both encapsulated and unencapsulated strains (Neil et al., 2009). The utilisation of extracellular DNA, which is important for the stability of biofilms of other bacterial species, can vary between different virulent meningococcal strains. This has been suggested as a possible explanation for observed differences in carriage rates between hyper-invasive lineages (Lappann et al., 2010). 1.3.2 Transmission and Carriage in the Population Carriage of the organism can be transient, with colonisation lasting a matter of days, or can persist for several months (Stephens, 2009). In endemic populations, a consistent carriage profile can be seen with relatively low carriage rates observed in children under 4 years (200 million individuals aged 1-29 years and has resulted in a manifest reduction of group A disease within vaccinated populations (Diomande et al., 2015). Long-term routine use of MenAfriVac into the Expanded Programme on Immunization is recommended in order to prevent the resurgence of group A disease in the meningitis belt (Karachaliou et al., 2015).
22
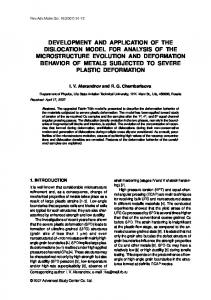
Figure 1-1: A map of Africa with The Meningitis Belt highlighted. The countries considered to be in the Meningitis Belt are coloured red and labelled. The countries coloured in dark red have historically experienced particularly high incidence (>10 cases/100,000). Map template sourced at yourfreetemplates.com. Figure 1-1: A map of Africa with The Meningitis Belt highlighted.
23
1.7.2 Group C Significant incidence of group C disease has historically been observed across Europe and the Americas (Baccarini et al., 2013). During the 1990s, a high incidence of group C disease was seen in the UK, Spain, Ireland and a number of other European nations, primarily driven by the expansion of a single hyper-virulent clone (C:2a:P1.5,2, ST-11). The incidence in many European countries increased dramatically from 81% amino acid identity whilst similarity between variant groups 1 and 3 is as low as 63% (Brehony et al., 2009; Masignani et al., 2003). In an alternate naming scheme, variant groups 2 and 3 are collectively referred to as ‘subfamily A’, reflecting their relative similarity, whilst variant group 1 is named ‘subfamily B’ (Fletcher et al., 2004). Epitope mapping studies have shown that most subfamily/variant group specific residues are located on the extracellular face of the protein, which is likely to be evidence of immunological selection pressures (Cantini et al., 2009; Mascioni et al., 2010). The identification and analysis of additional fHbp peptide variants, in particular natural chimeras, revealed a distinctly modular structure in which small invariant peptide regions separate five large variable segments (Beemink and Granoff, 2009; Pajon et al., 2010). Each segment (A to E) of a specific peptide variant, is given either an α or a β designation (or 1 or 2, respectively) (Beernink and Granoff, 2009). Using the unique combinations of the five segments, Beernink and Granoff (2009) divided individual fHbp peptides into six modular groups (I to VI), later expanded to nine groups (I-IX) (Beernink et al., 2009; Pajon et al., 2010).
37
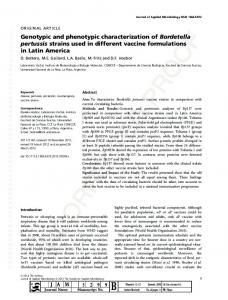
Figure 1-4: A schematic representation of the fHbp peptide (variant 1.55) as expressed from the surface of the meningococcal outer membrane. White: Serine/Glycine ‘tether’ anchoring the protein to the outer membrane. Green: Nterminal ß- sheet. Blue: C-terminal ß- barrel. Pink/red: linker between the two main domains. Boxed inset image: representation of the peptide surface facing away from outer membrane. Image reproduced from McNeil, L. K., Zagursky, R. J., Lin, S. L., Murphy, E., Zlotnick, G. W., Hoiseth, S. K., Jansen, K. U. and Anderson, A. S. (2013). ‘Role of Factor H Binding Protein in Neisseria meningitidis Virulence and Its Potential as a Vaccine Candidate To Broadly Protect against Meningococcal Disease’. Microbiology and Molecular Biology Reviews, 77 (2), pp.234–252., with permission from the American Society for Microbiology.
38
Most of the differences between subfamily A and B are seen in the C-terminal domain, whilst the N-terminal domain is important in distinguishing the two groups of subfamily A (Brehony et al., 2009; Murphy et al., 2009). The N and C domains are subject to interchanging recombination resulting in variants with combinations of domain types with unique signature residues. In a 2009 study, four distinct subfamily A N/C-terminal combinations were identified, namely N1C1, N1C2 (variant group 3), N2C1 and N2C2 (variant group 2) (Murphy et al., 2009). Subfamily B variants were divided into three further N-terminal domain types: N4, N5 and N6 (Murphy et al., 2009). The primary function of fHbp was first reported by Madico et al in 2006. Knock out strains and western blotting show fHbp to be a ligand for human fH, a negative regulator of the alternative complement pathway (Madico et al., 2006). Recruitment of fH to the cell surface by fHbp increases the survival of meningococci in human blood and serum (Madico et al., 2006; Welsch et al., 2008; Seib et al., 2009). The protein binds to domain 6 and partially at domain 7 of human fH (Schneider et al., 2009). Peptides of all variant groups can bind fH and recruitment of fH correlates with the level of fHbp at the bacterial surface (Seib et al., 2011; Madico et al., 2006). The fH affinity of different fHbp variants can, however, vary independently of expression level (Seib et al., 2011). Studies involving diverse isolate panels have observed lower expression of subfamily A variants in relation to subfamily B peptides (Hong et al., 2012; Biagini et al., 2016). In 2008, a study suggested that strains with higher levels of fHbp expression may exhibit greater dependence on the lipoprotein for immune resistance than those with low fHbp expression (Welsch et al., 2008). These differences in fH affinity and surface expression of fHbp may be associated with the differential expression of alternate fH ligands among meningococcal strains such as Neisserial Surface Protein A, PorB3 and sialylated LOS (Lewis et al., 2012). To date, almost all characterised invasive isolates, regardless of capsular group, possess fHbp. The level of surface expression can, however, vary considerably and, in several studies, strains were divided into high and low expressors (Beernink et al., 2007; Seib et al., 2010; Masignani et al., 2003; Fletcher et al., 2004). Expression level can influence the level of bactericidal activity with high expressers being more susceptible to 39
bactericidal killing (Jiang et al., 2010; Pajon et al., 2010). A small proportion of invasive meningococcal strains harbour fHbp alleles yielding truncated peptides and an even smaller number (typically 90% sequence homology and are immunologically cross-reactive (Comanducci et al., 2002). Group I alleles are commonly found among a limited number of albeit predominant invasive lineages, namely the ST32 complex, ST-11 complex and ST-8 complex. Group II contains subgroups NadA-4/5 and NadA-6 which are mostly restricted to carrier strains or the cc213 invasive lineage. As such, NadA is not as widely represented among invasive strains as fHbp (Comanducci et al., 2004; Bambini et al., 2009). Expression of NadA can differ 100 fold between harbouring invasive strains and expression is influenced by phase variation mediated by homopolymeric tracts in the gene promoter region (Beernink et al., 2007). NadA expression is naturally repressed by the NadR regulator. During colonisation of the nasopharynx, NadA expression is derepressed in the presence of 4-hydroxyphenyl acetate, a phenol ester commonly found in human saliva, by inhibiting the DNA-binding capability of NadR. This finding raises questions about the validity of SBA results generated in vitro in the absence of 4hydroxyphenyl acetate (Metruccio et al., 2009). 1.8.4.4 Neisserial Heparin Binding Antigen Neisserial Heparin Binding Antigen (NHBA, originally named GNA2132) is a surfacelocated protein that was also discovered by reverse vaccinology through the identification of an associated LXXC motif and was initially found to be capable of eliciting bactericidal antibodies in mice (Pizza et al., 2000). A subsequent immunogenicity study using anti-NHBA murine sera generated conflicting results (Welsch et al., 2003). Despite demonstrable antibody binding, complement deposition and rSBA bactericidal activity, the anti-NHBA antiserum only killed 2 out of 7 strains when tested with human complement. Interestingly, the strain from which the recombinant NHBA variant was derived was one of the five hSBA-resistant strains. The anti-NHBA serum did, however, provide passive protection in intraperitoneally-infected 42
rats, suggesting OPA may play a protective role (Welsch et al., 2003). Serruto et al. used dot blotting and hSBA to demonstrate NHBA-specific killing by human convalescent sera (Serruto et al., 2010). Using affinity chromatography, the protein was shown to bind Heparin via a conserved, central Arg-rich region, which increases serum resistance in the SBA. Furthermore, NHBA was shown to be cleaved from the surface by the NalP protease (in some strains) and human Lactoferrin at sites adjacent to the Arg-rich region (Serruto et al., 2010). Recently, Partridge et al demonstrated a significant NHBA contribution to SBA elicited by 4CMenB, especially in conjunction with anti-fHbp antibodies (Partridge et al., 2017). The NHBA-encoding gene is found in the all invasive strains, however, a small proportion of strains harbour NHBA variants with frameshifts and/or insertion sequences which disrupt translation (Jacobsson et al., 2006; Lucidarme et al., 2010; Bambini et al., 2009). 1.8.5 Recombinant Antigen Vaccines 1.8.5.1 4CMenB 4CMenB is a protein vaccine comprising three recombinant proteins (50 µg of each) and an OMV from the New Zealand outbreak group B strain NZ98/254 (25 µg) adjuvanted with aluminium hydroxide. Five recombinant proteins were identified among the MC58 genome using reverse vaccinology (Pizza et al. 2000). fHbp (GNA1870), NHBA (GNA2132), NadA (GNA1994), Neisseria ubiquinone binding protein (GNA1030) and a yet unnamed protein (GNA2091) were selected due to their collective presence among diverse group B strains as well as the ability of the corresponding antisera to elicit SBA activity and/or passive protection in infant mouse models (Giuliani et al., 2006; Pizza et al., 2000; Comanducci et al., 2002; Serruto et al., 2010; Masignani et al., 2003). In order to facilitate large-scale production of these recombinant proteins, four of the antigens are presented as two fusion proteins: NHBA is fused with NUbp and fHbp is fused with GNA2091. The fusion of these proteins also appears to increase the SBA activity induced by the individual antigens (Giuliani et al., 2006). Early human trials reported greater immunogenicity with formulations containing the NZ98/254 OMV (4CMenB / rMenB + OMV) compared to the recombinant antigens alone (5CVMB / 43
rMenB) or those with the Norwegian 44/76 SL strain OMV (rMenB + NW OMV) (Findlow et al., 2010; Snape et al., 2010; Biagini et al., 2016). As with other meningococcal vaccines, the efficacy of 4CMenB was assessed using immunogenicity data measuring the production of protective bactericidal antibodies in vaccinees (Bai et al., 2011). Clinical trials were designed to assess the immunogenicity of each individual antigenic component by using hSBA assays against multiple reference strains, each possessing and expressing one of the four antigens but mismatched (i.e expresses heterologous variants) for the remaining three antigens. A recent study of a small number of immunised adults found that these reference strains exhibit higher susceptibility to immune serum than a diverse panel of recent invasive strains (Giuntini et al., 2017) suggesting the use of the reference strains may over-estimate vaccine efficacy. The key Phase II and III trials that led to the licensure of 4CMenB are summarised in Table 1-1. Strong SBA responses have been shown to last at least six months in healthy adolescents and adults after two doses at one to six months apart (Kimura et al., 2011; Santolaya et al., 2012; Snape et al., 2013). Santolaya et al. (2013) found that adolescent titres remained high in >64% of vaccinees when tested 18-24 months after the second or third dose (Santolaya et al., 2013). Conversely, a small study in adults found that SBA titres against a number of diverse strains waned significantly after only 4-6 months (Giuntini et al., 2017). In infants, strong SBA responses are seen after two or three primary doses given one or two months apart (Gossger et al., 2012; Findlow et al., 2010). An anamnestic response was observed following boosting at 12 months, however, waning of bactericidal antibodies was seen by 60 months, even after a secondary booster at 40 months (Vesikari et al., 2013; McQuaid et al., 2015). The vaccine shows an acceptable safety profile in all age groups but increased reactogenicity relative to other routine vaccines (RV) has been widely reported and largely attributed to the OMV component (Perrett et al., 2015; Gossger et al., 2012; Santolaya et al., 2012; Vesikari et al., 2013). No interference with commonly used vaccines was indicated, however, increased reactogenicity was observed when administered with other scheduled vaccines (Vesikari et al., 2013; Gossger et al., 2012).
44
Table 1-1: Key Phase II/III studies assessing the safety and immunogenicity of 4CMenB. Age Group
Study ID
NCT00381615
NCT00433914
Country
UK
UK
No of subjects
147
60
Infants (5 against fHbp, NadA and PorA reference strains observed Immunogenicity by in >90% participants two 2 doses of hSBA assay, lot to weeks after dose 2. (Perrett et al. 4CMenB 2 lot consistency, Minimal reduction in 2015) months apart safety profile. hSBA activity seen after one month. Both lots consistent with acceptable safety profile.
4CMenB
99-100% participants has >1:4 hSBA titre after 2 or hSBA after 1, 2 or 1, 2 or 3 3 doses vs 91-97% of 3 doses measured doses at 1, 2 those receiving 1 dose. 91- (Santolaya et at baseline and one or 6 month 100% of those receiving 2 al. 2012) month following intervals. or 3 doses had >1:4 titres vaccination. after six months vs 7376% after 1 dose.
Adolescents (11-18/19 yrs)
NCT00661713
Reference
rMenB or 4CMenB
Toddlers (13 yrs)
UK
Results
Both vaccines tolerated Reactogenicity and and immunogenic against safety. hSBA tires strains with homologous (Snape et al. at baseline and one or similar antigen variants. 2010) month after 2nd & rMenB + OMV elicits 3rd dose. greater SBA responses.
4CMenB with/without 2 routine months vaccinations (RV)s
NCT00657709
NCT01027351
Endpoints
4CMenB titres wained up to 40 months. 4CMenB immunogenic following booster at 40 months.
(Snape et al. 2013)
(McQuaid et al. 2015)
≥80%, ≥91% and ≥92% of 4CMenB at vaccinees achieved a baseline, 2 hSBA titre hSBA titre of ≥1:4 after 4CMenB or and 6 months assessed 1 month dose 1, 2 and 3, (Kimura et al. Men ACWY- followed by post-vaccination. respectively. Acceptable 2011) CRM MenACWYSafety and rates of adverse CRM at 7 tolerability. events/reactions, however, months. greater than with MenACWY-CRM.
45
In 2012 and 2013, 4CMenB was licenced under the trade name Bexsero® for use in those aged over two months in Europe and Australia, respectively. It was also licenced in Canada in late 2013 for those aged from two months to 17 years. In January 2015, 4CMenB gained FDA accelerated approval in the US for use in those aged 10-25 years. In 2015, the UK became the first country to introduce 4CMenB into the national infant immunisation schedule. The vaccine was introduced for newborn infants from September 2015 at a 2 and 4 month primary schedule with a 12 months booster dose (Ladhani et al., 2015b). A small catchup campaign was also launched for infants born from 1st May 2015. These infants received one or two doses of 4CMenB with their 3 month and/or 4 month routine vaccinations depending on their age, as well as the 12 month booster. A single dose of paracetamol has been shown to reduce the incidence of fever without impacting on immunogenicity (Prymula et al., 2014) and paracetamol is recommended following primary vaccination with 4CMenB and at 4-6 hourly intervals as required (Ladhani et al., 2015b). In the first ten months of the programme, routine uptake of 4CMenB in infants was high (95.5% for one dose; 88.6% for two doses) and a 50% reduction in incidence rate ratio was observed in the vaccine-eligible cohort (Parikh et al., 2016). A vaccine effectiveness of 94.2% was calculated based on a estimated strain coverage of 88% (Frosi et al., 2013). Subsequent analyses of more recent strains have revised down the strain coverage estimate for England, Wales and Northern Ireland suggesting that vaccine effectiveness is likely to be higher than 95% for this period (Parikh et al., 2017). 1.8.5.2 rLP2086 rLP2086 is a recombinant vaccine composed of two lipidated fHbp peptides. Selection of the two variants was based on the observed cross-reactivity within fHbp subfamily A (variant groups 2 and 3) and B (variant group 1) but the limited reactivity between the subfamilies (Pizza et al., 2008; Fletcher et al., 2004). Consequently, including one variant from each subfamily should theoretically provide protection against all fHbp variants. The vaccine contains variant 1.55 (B01) and 3.45 (A05) (Zlotnick et al., 2015). Early data suggested that lipidated fHbp is more likely to induce SBA than the corresponding non-lipidated peptide (Fletcher et al., 2004). In pre-clinical studies using 46
rabbit serum, rLP2086 elicited SBA against 87 of 100 diverse isolates. The immune serum was shown also to be reactive against fHbp on the cell surface in a subfamily specific manner. Expression of fHbp (measured using monoclonal antibody MN86-99411-1) correlates positively with killing using rLP2086 anti-serum in the SBA assay (Jiang et al., 2010). Early clinical trials were carried out using 3-dose schedules (0, 1 and 6 or 0, 2 and 6 months) of varying vaccine concentrations and hSBAs were performed against at least 4 test strains which had been selected to represent a disparate, heterologous fHbp peptides expressed at low/medium levels (Zlotnick et al., 2015). A phase I study in toddlers (18-36 months) found acceptable tolerability to the vaccine and high hSBA titres against a strain expressing a homologous fHbp variant (3.45; A05) but seroconversion (≥4-fold increase in hSBA titre) was seen in 50% of vaccinees 48 months after the third rLP2086 dose (Marshall et al., 2017). Conversely, a small study in laboratory workers immunised with rLP2086 found that hSBA titres waned considerably 11 months after the third dose (Lujan et al., 2017). rLP2086 was licenced in the US in 2014 under the trade name Trumenba®. The vaccine was accepted for use in 10-25 year-olds via the FDA accelerated approval programme. The vaccine was also licenced in Europe in 2017 for use in those aged ten years and older. As the vaccine is restricted to use in adolescents/ adults, the potential utility of the vaccine is likely to be lower than that of 4CMenB, which can be used to directly protect infants. rLP2086 may, however, be useful for controlling sporadic outbreaks in older populations (e.g. universities), especially where the circulating invasive strain may not be covered by 4CMenB antigens (Soeters et al., 2017b). Like 4CMenB, routine use of rLP2086 in adolescents is unlikely to be cost-effective unless the vaccine is shown to impact the acquisition of nasopharygeal carriage, which can lead to indirect herd protection of younger populations as observed with group C conjugate vaccines. Limited data are available on this question; however a recent carriage study in a US university observed no reduction in carriage following vaccination with rLP2086. (Soeters et al., 2017a). This study involved relatively small numbers of participants and so additional, suitably-powered studies are required in order to conclusively determine the impact of this vaccine on carriage. 1.8.6 Predicting Vaccine Strain Coverage and Assessing Impact Predicting the strain coverage of vaccines consisting of capsular polysaccharide antigens, which have a relatively uniform composition, is fairly simple as polysaccharide vaccines will protect against all strains belonging to the corresponding capsular group. Such protection is dependent upon adequate capsular expression of 48
the polysaccharide, however, as an indispensable virulence factor, the vast majority of invasive strains express the antigen in abundance (Gray et al., 2006). In contrast, many protein antigens, particularly those under immune selective pressure, exhibit significant sequence variation which can restrict the breadth of the bactericidal response elicited by protein-based vaccines (Urwin et al., 2002). Additionally, many antigens can be relatively sparse on the outer membrane surface and the level of expression of protein antigens (e.g. fHbp) can vary widely between strains (Biagini et al., 2016). As such, strain coverage predictions of novel recombinant vaccines require a much more complex evaluation of antibody cross-reactivity against the specific peptide variants in conjunction with measurements of surface expression by individual invasive strains. 1.8.6.1 Predicting the strain coverage of 4CMenB The multi-component nature of 4CMenB complicates the assessment of its strain coverage. During its licensure, a small panel of strains was used in the SBA to assess the immunogenicity of each antigenic component. Using the SBA assay against the large numbers of strains required for an accurate prediction of strain coverage would be time consuming and would require large amounts of immune serum and exogenous complement. In order to facilitate such large-scale strain coverage evaluations, the Meningococcal Antigen Typing System (MATS) was developed. The purpose of the MATS is to predict killing of strains in the hSBA assay by antibodies elicited by 4CMenB. The MATS uses a sandwich-ELISA format to measure the binding of polyclonal rabbit antibodies, each raised against the individual recombinant 4CMenB antigens (fHbp, NadA and NHBA), to the corresponding antigens present in the lysates of each strain tested. The amount of antigen bound to the wells of the plate is a function of the crossreactivity between the harboured antigenic variant and the antibodies, as well as the amount of antigen present in the lysate. The signal intensities are compared to those of reference strains to produce a relative potency (RP) value for each antigen. A MATS assessment study by Donnelly et al. established RP cut off values for each antigen, termed positive bactericidal thresholds (PBT), and found that strains with RPs above the assigned PBT for one of the three antigen had >80% likelihood of being killed by 49
pooled serum from infants who have received 4CMenB at 2, 3, 4 and 12 months (Donnelly et al 2009). As the expression level of the PorA OMV antigen is not a determinant of immune recognition and strain killing, this component is not assessed using the ELISA. Typing of PorA is sufficient and the presence of the P1.4 VR2 epitope is predictive of strain killing by post-vaccination sera (Martin et al., 2006). As a result, for a strain to be predicted as ‘covered’ by the MATS, it must produce an RP above the assigned PBT for at least one recombinant antigen and/or possess the PorA P1.4 VR2 epitope. The MATS assay has been established within many reference units throughout Europe and beyond. The first large-scale use of the MATS was in a Europe-wide assessment of 1052 invasive group B isolates collected during the 2007/08 epidemiological year from five countries. The study reported an overall European strain coverage of 78% (73%87% inter-country variation) with 73% of English and Welsh strains covered (Vogel et al., 2013). FHbp and NHBA were the predominant antigenic contributors with the majority of all tested European isolates MATS positive for these one or both of these antigens. Only around 7% of strains were MATS positive for NadA. In England and Wales, 69% of covered strains were positive for >1 antigen (Vogel et al., 2013). In 2016, a comparative analysis of the 2007/08 English and Welsh isolate data and MATS data from group B isolates collected during the 2014/15 epidemiological year reported an small but significant reduction in strain coverage between these two years (to 68% in 2014/15) (Parikh et al 2017). Analysis showed this decrease in coverage was due to a reduction in a predominant, cross-reactive NHBA variant (peptide 21) driven by changes in CC distribution, particularly within the ST-269 complex (Parikh et al 2017). A number of other MATS assessments have been carried out in Europe and elsewhere (Bettinger et al., 2014; Tzanakaki et al., 2014; Medini et al., 2015; Abad et al., 2016). As in the UK, differences in strain coverage across these countries were also attributed to natural variation in the geographical CC distribution demonstrating that strain coverage of protein-based vaccines can be sensitive to changes in the antigenic distribution within the hyper-virulent strain population.
50
Two recent studies have compared MATS results to SBA killing and both concluded that MATS provides a conservative estimation of coverage as a small number of MATSnegative strains were killed by pooled infant and adolescent immune serum in the SBA assay. It has been suggested that, in the SBA (and in vivo), the immune response maybe augmented by synergism between the antibodies targeting different antigens, an effect that would not be observed in the MATS. Furthermore, the MATS would not take into account bactericidal activity of antibodies targeting additional, minor antigens with the OMV preparation (Abad et al., 2015; Frosi et al., 2013). MATS is also useful for investigations into potential vaccine failures. Invasive isolates from 4CMenB vaccinees are tested to determine whether the strain should have been killed by immune serum. In cases in which a viable isolate has not been obtained, predictions of vaccine strain coverage are based on genotypic information only. In these cases a strain can only be considered covered if it possesses PorA P1.4 and/or one of a small number of fHbp variants which have been shown to be reliably MATS positive in isolates. These are peptide variants 1.1, 1.4, 1.37, or 1.232 (Vogel et al., 2013). 1.8.6.2 Predicting the strain coverage of rLP2086 As rLP2086 is composed solely of two fHbp variants, predicting strain coverage is relatively less complex. During the licensure of rLP2086, the manufacturers demonstrated the ability of the vaccine to protect against strains expressing diverse fHbp variants. Thus, cross-reactivity between rLP2086-elicited antibodies and the fHbp variant harboured by an invading strain is assumed providing fHbp is expressed sufficiently on the surface of the bacterium. Thus, the characterisation of the specific fHbp variants harboured by invasive strains is not explicitly required to predict coverage, only evidence of fHbp surface expression. To this end, a flow cytometry assay named the Meningococcal Antigen Surface Expression (MEASURE) assay was developed in order to quantify the level of surface expression on meningococcal cells fixed using formaldehyde (McNeil et al., 2018). The MEASURE assay utilises a monoclonal antibody (MN86-994-11-1) that recognises diverse fHbp peptide variants (of both subfamilies/all variant groups). In 2018, McNeil 51
et al. elucidated the binding epitope of MN86-994-11-1 on fHbp using hydrogendeuterium exchange mass spectrometry. They showed that the antibody binds primarily to the C-terminal β-barrel. Residues 180 to 198 were of particular importance as they are involved in binding to the antibody among protein variants of both subfamilies. The binding affinities of the antibody were shown to be relatively consistent across eight different fHbp variants (McNeil et al., 2018). The MEASURE readout is the mean fluorescence intensity (MFI) and directly correlates with the expression of fHbp on the cell surface. In a comparison of MEASURE results and the hSBA killing result (killing defined as 4-fold SBA titre rise) among 45 strains, expression levels of fHbp were positively correlated with the likelihood of killing by post-immunisation human serum (Jiang et al., 2010). McNeil et al. later confirmed these findings with an additional 109 strains. Whilst a poor correlation between the hSBA titre and MEASURE MFI was found, the MFI was predictive of killing overall. The data suggested that strains producing an MFI of 1000 (purported to be equivalent to 30 pg of fHbp / µg of total cellular protein) or above have a 91% chance of susceptibility to anti-rLP2086 serum (McNeil et al., 2018).
1.9 IMD Surveillance in England and Wales In England and Wales (E&W), national surveillance of IMD is carried out primarily by the Public Health England’s Meningococcal Reference Unit (PHE MRU). PHE MRU carries out laboratory IMD confirmation and strain characterisation of clinical isolates submitted by microbiology laboratories throughout the E&W. Speciation through oxidase, catalase and carbohydrate utilisation tests are typically followed by phenotypic finetyping using Dot-blot ELISA and/or co-agglutination (Gray et al., 2006). Following phenotypic characterisation, meningococcal isolates undergo whole genome sequencing. All meningococcal isolates received since July 2010 have been (or are due to be) whole genome sequenced using the Illumina HiSeq platform. The assembled genomic data are stored in the MRF MGL within BIGSdb hosted by the University of Oxford (www.pubMLST.org) (Jolley and Maiden, 2010). The database features automated indexing tools which search for and characterise known meningococcal genes within the uploaded data, assigning arbitrary numeric identifiers to each unique allele. 52
In addition to isolate characterisation, a real-time PCR screening assay, targeting the meningococcal capsular gene ctrA, has been used to test submitted clinical specimens since 1997. Figure 1-5 illustrates the numbers of cases confirmed by each confirmation method per year since 1998/99. Within two years of the introduction of the PCR diagnostic service, a 56% increase in confirmed disease cases was observed (Guiver and Borrow, 2001). In recent years just less than half of IMD cases (44.9%) are confirmed solely through PCR analysis of culture-negative clinical samples and approximately a quarter by both culture and nonculture (Figure 1-5) (Heinsbroek et al., 2013). Taqman® assays targeting siaD (for groups B, C, Y and W) and mynA (for group A) are also used to allow genogroup determination (Hackett et al., 2002a). The assay was originally a triplex assay designed to also detect Haemophilus influenzae (bexA) and Streptococcus pneumoniae (ply) DNA. In 2003, an additional meningococcal reverse primer was included in order to compensate for a primer site mismatch which led to a lack of coverage of strains belonging to the ST-269 cluster (ST-269 complex) (Gray et al., 2012). In 2011, the assay was again amended, removing the Haemophilus primers/probes (due to low numbers of cases) and incorporating the group B-specific (siaDb) target within a lyophilised master mix format. As group B is the predominant capsular group in E&W, it was reasoned that this change would, in most cases, eliminate the requirement of a secondary PCR for group confirmation thereby reducing the assay turnaround times (McHugh et al., 2015). Due to a detected reduction in the sensitivity of the assay, the mix was changed again in 2015 to a ‘wet mix’ with ctrA-specific ABY dye probe (unpublished data, PHE MRU).
53
confirmation
54
PCR only (Non-culture)
Epidemiological Year (July-June)
Culture and PCR
Figure 1-5: Number of IMD cases confirmed by PHE MRU from 1998/99 to 2016/17 by method of confirmation. A gradual reduction in total IMD cases was observed. Of all cases confirmed over the nineteen epidemiological years, 44.9% were confirmed by PCR alone. The lack of a viable isolate in these cases limits the extent of strain characterisation.
0
500
1000
1500
2000
2500
3000
Culture only
Figure 1-5: Number of IMD cases confirmed by PHE MRU from 1998/99 to 2016/17 by method of
Number of IMD cases
Due the dearth of meningococcal DNA and the presence of human DNA among clinical specimens, whole genome sequencing of meningococci directly from these specimens is not yet possible. Consequently, beyond capsular grouping, non-culture strain characterisation is limited to sequencing of the porA gene (not published) and the seven MLST loci (Birtles et al., 2005) using nested PCR assays, however, the MLST assay is not routinely used due to greater number of targets involved. Following the introduction of 4CMenB into the routine infant immunisation programme in 2015, PHE implemented an Enhanced Surveillance programme to monitor the impact of this intervention and other meningococcal vaccine programmes (i.e. MenC and MenACWY) in terms of measuring vaccine effectiveness and assessing potential changes in strain distribution. Clinicians are asked to provide additional EDTA samples and throat swabs from suspected IMD cases. These are sent to PHE MRU and can be used for genotypic strain characterisation and/or future seroprevalence studies. The limited strain characterisation possible for non-culture cases impedes an accurate assessment of the impact of 4CMenB introduction on the meningococcal strains in circulation in England and Wales as well as hindering the accuracy of strain coverage predictions for other non-capsular vaccines.
55
Thesis Objectives and Structure The overall aim of the research was to develop and introduce a number of assays/techniques designed to improve and/or increase the phenotypic and genotypic data generated by PHE MRU prior to and as part of PHE’s Enhanced Surveillance programme.
The primary objectives were to: 1. Develop a non-culture PCR sequencing assay to allow amplification and characterisation of the fHbp allele directly from clinical specimens submitted to PHE MRU. 2. Apply this fHbp genotyping assay to five years (2011-2015) of submitted clinical specimens in order to reveal the distribution of fHbp variants among nonculture strains and assess any disparity with that of corresponding invasive isolates. 3. Assess the effectiveness of the Agilent SureSelect XT system for enrichment of meningococcal DNA within non-culture DNA extracts in order to facilitate whole genome sequencing. 4. Transfer an established flow cytometry-based assay designed to quantify the level of fHbp surface expression and perform inter-laboratory comparisons of results.
56
2.0 METHODS AND MATERIALS 2.1 Storage and culturing of N. meningitidis isolates 2.1.1 Storage of meningococcal isolates All meningococcal isolates used were stored at -80 °C on Microbank® beads (Prolab Diagnostics, Canada) or equivalent. These porous beads provide a solid support for bacterial storage. To inoculate a vial of beads for bacterial storage, an overnight culture of the required strain was prepared. A 10 µL loop containing bacterial growth was added to the vial and resuspended in the glycerol broth by rotating the loop. The lid was then replaced and the vial was inverted to mix the beads within the broth. The broth was then removed and discarded using a plastic pipette. The bead vial was then stored at -80°C. 2.1.2 Culturing meningococci on agar plates All bacterial manipulations were performed within a class I microbiological safety cabinet (MSC, Contained Air Solutions, UK) on Columbia Blood Agar (CBA) (Oxoid, UK) unless otherwise stated. Bacteria were applied to the agar using 10 µL sterile plastic loops (from Microbank® beads) or using a pipette (broth/liquid) and streaked for single colony isolation. Agar plates were allowed to dry within the MSC before being transported to a CO2 incubator (LEEC, UK) for overnight incubation (16-20 hours) at 37 °C with 5% (v/v) CO2. 2.1.3 Preparation of meningococcal liquid suspensions Preparation of meningococcal suspensions within broth was achieved by transferring bacteria from agar plates grown overnight directly to the broth (see 2.1.2). Within the MSC, a sterile cotton or polyester swab was used to remove the required number of meningococcal colonies for the agar surface. The swabs were then placed into the liquid and gently agitated along the inside of the vessel to remove the colonies and break up the cells. Once a suspension of a sufficient concentration was achieved, the swab was discarded and the liquid vessel sealed.
57
2.2 Storage and handling of clinical specimens 2.2.1 Storage of clinical specimens All clinical specimens (e.g. EDTA blood, CSF, knee fluid, pericardial fluid) were stored at -80°C in the original vials received by PHE MRU. 2.2.2 Handling of clinical specimens Clinical specimens were treated as potentially infectious and were manipulated within an MSC.
2.3 Preparation, quantification and storage of DNA extracts 2.3.1 Extraction of DNA from meningococcal isolates Extraction of DNA from meningococcal isolates was performed by PHE MRU as part of previous sequencing projects (Hill et al., 2015; Vogel et al., 2013). The isolates were extracted using the DNeasy Blood and Tissue kit (Qiagen, UK) following the manufacturers’ gram-negative bacteria protocol (DNeasy® Blood & Tissue Handbook, July 2006). 2.3.2 Extraction of DNA from clinical specimens Unless otherwise stated, DNA extraction from clinical specimens was performed by PHE MRU as part of routine diagnostic PCR testing. PHE MRU uses the MDx biorobot platform (Qiagen, UK) in accordance with the manufacturer’s protocol with a final elution volume of 80 µL. Alternatively, DNA extraction from clinical specimens was performed manually using DNeasy Blood and Tissue Kit following the ‘Animal Blood’ protocol (DNeasy® Blood & Tissue Handbook, July 2006). The DNeasy protocol involved adding 100 µL of specimen to a 1.5 mL screw-capped tube containing 20 µL of Proteinase K solution (Qiagen, UK) before adding 100 µL of phosphate-buffered saline (PBS, ThermoFisher, US). Then, 200 µL of Buffer AL (Qiagen, UK) was added and the suspension was vortexed vigorously. The tube was incubated at 56 °C on a heating block (Grant Instruments, UK) for 10 58
minutes. The tube was then pulse spun in a Micromax (IEC) or Biofuge Pico (Heraeus) microfuge in order to remove suspension from the tube lid before the addition of 200 µL of Ethanol (>99.5%, Sigma Aldrich, UK) to the suspension. The tube was once again vortexed and centrifuged to remove suspension from the lid.
The tube contents were
then transferred to a DNeasy spin column within a 2 mL collection microtube (Qiagen, UK). The spin column and collection microtube were spun at 6000 x g for 1 minute to draw the lysate through the filter. The column was then carefully removed and placed into an empty collection microtube. To wash the filter, 500 µL of Buffer AW1 was added to the spin column and spun once again at 6000 x g for 1 minute. The spin column was added to another empty collection microtube before the addition of 500 µL of Buffer AW2 to the column and centrifugation at 16,000 x g for 3 minutes. The spin column was then placed into a sterile Eppendorf tube for elution. The elution was performed by adding 50 µL of Buffer AE (Qiagen, UK) to the spin column and allowing one minute incubation at RT. The column was then spun at 6000 x g for one minute. This was then repeated within another 50 µL of Buffer AE giving a total elution volume of 100 µL. The use of two successive elutions maximised the DNA yield whilst minimising the volume in which the DNA was eluted. 2.3.3 Quantification of DNA DNA quantification was performed using a Qubit 2.0 fluorometer in conjunction with the Qubit® double-stranded DNA (dsDNA) BR Assay Kit (ThermoFisher, US). Prior to use, calibration of the fluorometer was performed using two standards provided in the kit. To calibrate, a sufficient volume of Qubit® dsDNA BR Reagent was diluted in Qubit® dsDNA BR Buffer at a 1:200 concentration. For each standard, 190 µL of diluted reagent was added to a thin-wall, clear, 0.5 mL PCR tube (Corning, US) before adding 10 µL of the standard. The standards were incubated for 1 minute at room temperature (RT) before being read in the fluorometer. For each extract to be quantified, 190 µL of diluted Qubit® dsDNA BR Reagent was added to a PCR tube before adding 5 µL of the DNA extract and incubating for 1 minute at RT. The tubes were then placed into the fluorometer and read by pressing ‘READ’.
59
The assay concentration (diluted concentration) and the stock concentration (extract concentration) were recorded for each extract. 2.3.4 Collation of non-culture DNA extracts for fHbp genotyping Attempts were made to obtain DNA extracts from all non-culture cases confirmed by the PHE MRU from 1st January 2011 to 31st December 2015. For cases in which there was no available extract, re-extraction of DNA from the original specimen was carried out either manually using Qiagen Blood and Tissue DNeasy kit (see section 2.3.2). Cases in which no specimen and/or extract could be obtained could not be tested. 2.3.5 Storage of DNA extracts All DNA extracts were stored in screw-capped microfuge tubes or Eppendorf tubes at 4 °C or -80 °C.
2.4 Polymerase chain reaction 2.4.1 Primer preparation and storage All primers were produced by Eurofins Genomics using HPSF (High Purity Salt Free, a proprietary reverse phase cartridge purification method) at a 0.20 µmol synthesis scale. Primers were supplied lyophilised and reconstituted in molecular grade water (Sigma Aldrich, UK) to a concentration of 100 µM (master stock, x20). To prepare working stocks (5 µM), 50 µL of the master stock was diluted in 950 µL of molecular grade water (Sigma Aldrich, UK) and mixed. All primer stocks were stored at -20 °C. 2.4.2 Preparation of PCR reaction master mix All PCR master mixes were prepared using the HotStarTaq DNA polymerase kit (containing HotStarTaq DNA polymerase, 10x PCR Buffer and 25 mM MgCl2) and dNTP mix (Qiagen, UK). All reagents were stored at -20 °C. To prepare a master mix, PCR reagents and required primers were removed from storage and allowed to defrost at RT. Reagents were then mixed by inverting the tubes and then spun in microfuge to remove reagent from tube caps. Master mixes were prepared within a PCR cabinet by
60
adding the required volumes of each reagent to a 1.5 µL screw-capped micro tubes or 30 mL Universal tube and gently mixing using a pipette (Table 2-1).
Table 2-1: Standard PCR master mix reagent volumes for PCR reactions Reagent HotStarTaq PCR buffer HotStarTaq DNA Polymerase dNTPs (10 mM each) PCR primer 1 (5 µM) PCR primer 2 (5 µM) MgCl2 (25 mM) Distilled water
Volume per 25 µL reaction (µL)
Volume per 50 µL reaction (µL)
Volume per 100 µL reaction (µL)
2.5
5
10
0.125
0.25
0.5
0.5 2.5 2.5
1 5 5
2 10 10
variable* variable#
variable* variable#
variable* variable#
*added to the required concentration. #added up to required master mix volume (reaction volume – extract volume)
Table 2-1: Standard PCR master mix reagent volumes for PCR reactions. The required volume of master mix was added to the wells of a MicroAmp® Optical 96Well Reaction Plate (ThermoFisher, US). 2.4.3 Addition of DNA extracts and use of thermal cycler. The DNA extracts were defrosted at RT (if frozen) before being spun briefly in the centrifuge to clear the tube lids. The required volume of DNA extract was then added to the appropriate well of the PCR reaction plate containing the master mix. The plate was sealed using MicroAmp® Optical 8-Cap strips (ThermoFisher, US). The plate was placed onto a Verity thermal cycler (Applied Biosystems, US) and the required PCR programme was completed. 2.4.4 Gel electrophoresis of PCR products 2.4.4.1 Preparation of agarose gels. The presence/absence of amplified products was determined through visualisation on 2% agarose gels. Agarose gels were prepared by weighing 3 g of agarose (Sigma Aldrich, UK) and suspending it in 150 mL of 1x Tris-Borate EDTA (TBE) buffer (89 mM Tris-borate 61
and 2 mM EDTA, pH 8.3., Sigma Aldrich, UK). The suspension was heated in a microwave oven for up to two minutes until the agarose had fully dissolved. After two minutes of cooling at RT, 15 µL of 10,000x SYBR® Safe DNA stain (Thermo Fisher, US) was added to the dissolved agar and mixed through gentle agitation. The agar was then poured into a casting tray left at RT until fully solidified. The gel was placed into a gel tank (ThermoFisher, US) and submerged in 1x TBE buffer. 2.4.4.2 Preparation of gel loading buffer. A 30% (v/v) glycerol solution was prepared by mixing the appropriate amount of glycerol to distilled water. Small amounts of Bromophenol blue (Sigma Aldrich, UK) were then successively added until the buffer was stained to a dark green colour. 2.4.4.3 Loading and running of agarose gels A volume of 5 µL of loading buffer was added to 5 µL of each PCR product and loaded into the the agarose gel. For each line of wells in the gel (i.e. each gel comb), 6 µL of GelPilot 100 bp plus molecular ladder (ML, Qiagen, UK) was loaded. The gel was run at 100 V. The length of electrophoresis time required depended on the intended PCR product length. For the fHbp PCR round-two product (~1330-1530 bp), approximately 15 minutes was sufficient. 2.4.4.4 Visualising PCR products in gel After electrophoresis, the gel visualised using the G:BOX transilluminator (Syngene, US). Using the Genesys software, the gel image was captured using the automated capture settings. The brightness and contrast of the image was adjusted as appropriate post-capture and the image was cropped to include the used wells only. The intensity of the PCR product bands was determined visually in comparison with the molecular ladder to assign approximate band intensities: strong, medium, weak or very weak. The intensity was recorded and would determine the volume of water added to the products in the subsequent PCR clean up stage.
62
2.4.5 Clean-up of PCR products PCR products were cleaned using ExoSAP-IT® (Affymetrix, US). The product contains Shrimp Alkaline Phosphatase and Exonuclease I, two hydrolytic enzymes which digest residual dNTPs and primers/single stranded DNA remaining within the reaction mix. PCR cleanups were performed in MicroAmp® fast optical 96-well reaction plates (Thermo Fisher, US). For each sample, 2 µL of ExoSAP-IT® was added to 5 µL of each PCR reaction mix. The plate was heated on a ABI 9800 Fast thermal cycler (Applied Biosystems, US) using the following protocol: 37 °C for 15 minutes, 80 °C for 15 minutes, retained at 4 °C. The clean-up mix was then diluted using molecular grade water. The dilution factor used for each product was dependent upon the intensity of the corresponding band produced on the agarose gel. ‘Strong’ bands were diluted ¼, medium bands were diluted ⅓ and weak bands diluted ½. To very weak products, 3 µL of water was added (1/1.42 dilution).
2.5 Optimisation and analysis of fHbp PCR assay 2.5.1 Primer selection and design Selection of PCR and sequencing primers was primarily based on the location of its complementary sequence in relation to fHbp and the conservation of the nucleotide sequence among diverse meningococcal strains. To identify new primer candidates, the Primer Quest online tool (Integrated DNA Technologies, US https://www.idtdna.com/Primerquest/Home/Index) was used to identify putative candidates within input sequences. To identify suitable PCR primer-sites, DNA sequences of the flanking regions of fHbp among 15 complete meningococcal genomes from the Genbank database (National Center for Biotechnology Information (NCBI), US) were inputted into Primer Quest (Appendix I). The suitability of parameters such as melting temperature, percentage G/C content (%GC) and the likelihood of hairpin/dimer formation were also assessed using the online Oligoanalyzer tool (Integrated DNA Technologies, US. 63
https://www.idtdna.com/calc/analyzer). Melting temperatures of ~55-60 °C and %G/C of 40-60% were considered ideal. Primers which form internal hairpins and selfdimerisations with delta G score of 16 hours) on CBA (refer to 2.1). For each strain tested and each time point required, meningococcal cells were resuspended in two 15 mL Falcon tubes (Corning, US) containing 3 mL of GCK broth. The OD of the suspensions were measured at 650 nm using a WPA S800 spectrophotometer (Biochrom Ltd., UK). Cells were added until an OD of >0.55 was achieved. The suspensions were centrifuged for 4 minutes at 1825 x g and the supernatant was discarded. To one tube, 3 mL of PFA/PBS was added. As a control, 3 mL of GCK was added to the second tube. Both tubes were vortexed thoroughly and the incubated at 1-4 ⁰C for the required time using a CoolRack (Biocision, US). After the required time, the two tubes were centrifuged for 4 minutes at 1825 x g and the supernatant was discarded before 5 ml of GCK was added the tube. The tubes were vortexed to resuspend the cells and centrifuged once again for 4 minutes at 1825 x g. Finally, the supernatants were poured away and the pellets were resuspended in the residual broth remaining in the tube (200-300 μL) by agitating the bottom of the tube. This broth and the suspended cells were then transferred to CBA plates, which were incubated at 37 ⁰C with 5% CO2 for ≥48 hours. The plates were then inspected for meningococcal growth.
82
2.13 Finalised MEASURE assay protocol and data analysis 2.13.1 Overnight growth on GC agar For each strain to be tested, 10 µL of the defrosted GC glycerol broth was plated for single colony isolation on GC agar. Agar plates were incubated overnight (16-18 hours) at 37 °C with 5% CO2. 2.13.2 Liquid culturing of meningococci All strains were grown within GCK broth to an OD of 0.5-0.55 (at 650 nm). To prepare initial meningococcal suspensions, 50-100 isolated meningococcal colonies were removed from the inoculated GC plates (following overnight incubation) and transferred to the Erlenmeyer flask containing 25 mL of GCK broth (2.11.5). The swabs were gently agitated along the inside of the vessel to remove the colonies and break up the cells. The OD of the suspensions was measured at 650 nm using a WPA S800 spectrophotometer (Biochrom Ltd., UK). Broth suspensions with ODs of 0.15-0.2 were transferred to a Minitron shaking incubator (Infors HT, Germany) and incubated at 37 °C with 150 rpm shaking. To suspensions with ODs of 0.2, more GCK broth was added before being re-tested. This was repeated until all strains had achieved the starting OD of 0.15-0.2 and were incubated. After one hour of incubation, the flask of each strain was removed from the incubator and the OD was again measured and recorded before the flask was returned to the incubator. The OD of the suspensions were then periodically measured and recorded as required until an OD of 0.5-0.55 was achieved. Upon reaching this OD, 5 mL of the suspension was transferred to a 15 mL Falcon tube (Corning, US) using a sterile pastette. The broth in the tube was then cooled to 1-4 °C in a CoolRack (Biocision, US). Suspensions that exceeded this OD were discarded and those strains were repeated on a subsequent assay run. After 2-10 minutes, the Falcon tubes were centrifuged for 4 minutes at 1825 x g. Following centrifugation, the supernatant was carefully poured in to disinfectant. The tube was sealed and the bottom of the tube was agitated in order to disrupt the pellet 83
within the residual GCK broth. To the pellet, 5 mL of PFA/PBS was added and the tube was sealed and vortexed at high speed to resuspend the cells. This was repeated for all tubes before they were incubated at 4 °C for at least 16 hours. 2.13.3 Assay Day Three (cell staining and acquisition) The fixed meningococcal cells were antibody stained using a three-step procedure. The reagents used to staining of the fixed meningococcal cells are described in Table 2-10. Table 2-10: Staining reagents used in MEASURE assay. Staining step
Antibody/reporter
Manufacturer
Working concentration
Primary
IgG control (non-specific) and MN86-994-11-1 (fHbpspecific)
Sponsor
6.7 µg/mL
Secondary
Biotinylated anti-mouse IgG (Goat)
Tertiary
SA-PE (Streptavidin bound to Phycoerythrin)
Jackson Immunoresearch. US (Cat: 115-065-164) BD Biosciences, Cat # 554061
10 µg/mL 5 µg/mL
Following at least 16 hours incubation at 4⁰C, the fixed cells were vortexed to resuspend the cells. For each strain, 50 µL was added to each of four microtitre wells as illustrated in Figure 2-1. Primary staining was carried out in parallel using both a nonspecific isotype control and the fHbp-specific monoclonal (MN86-994-11-1). Staining was carried out in 96-well microtitre plates and each strain was stained in quadruplicate (Fig. 2-1). Two of the four quadruplicates were stained with a nonspecific control primary antibody and the remaining two were stained with the fHbpspecific antibody (MN86-994-11).
84
Figure 2-1: Configuration of staining plate during primary staining in the MEASURE assay.
85
Well 1 2 3 mAb mIgG MN86-944-11-1 mIgG Duplicate a a b A Strain #1 B C Strain #4 D E Strain #7 F G Strain #10 H mAb: monoclonal antibody
4 MN86-944-11-1 b
5 mIgG a
6 7 MN86-944-11-1 mIgG a b Strain #2 WASH WELLS Strain #5 WASH WELLS Strain #8 WASH WELLS Strain #11 WASH WELLS
8 MN86-944-11-1 b
9 mIgG a
Strain #12
Strain #9
Strain #6
10 11 MN86-944-11-1 mIgG a b Strain #3
12 MN86-944-11-1 b
Figure 2-1: Configuration of staining plate during primary staining in the MEASURE assay. Each strain was stained twice with the control primary antibody (mouse IgG) and twice with the fHbp-specific primary antibody (MN86-994-11-1).
The microtitre plate was then centrifuged at 1825 x g for 4 minutes. The supernatant was removed by inverting the plate. The cells were washed by resuspending the cells pellets in 200 µL of BSA/PBS. The plate was then centrifuged at 1825 x g for 4 minutes before the plate was inverted to remove the BSA/PBS. The primary antibodies were prepared by diluting stock antibodies to the working dilution in BSA/PBS. 50 µL of the appropriate antibody was added to each well as indicated in Figure 2-1. The cell pellets were then resuspended in the antibody solutions. The plate was incubated at 4 °C for 30 minutes. Following incubation, 150 µL of BSA/PBS was added to each well before the plate was centrifuged at 1825 x g for 4 minutes. The supernatants were removed by plate inversion and the cells were re-suspended in 200 µL of BSA/PBS. The plate was once again centrifuged at 1825 x g for 4 minutes and the supernatant discarded. The secondary antibodies were diluted to the working concentration in BSA/PBS, 50 µL was added to each microtitre well and the cells were resuspended. The plate was incubated for 30 minutes at 4 °C. The plate was then washed twice in BSA/PBS (as described following the primary antibody incubation) before the SA-PE was diluted to the working concentration in BSA/PBS and added to the cells (50 µL). The plate was covered (to protect from light) and incubated for 30 minutes at 4 °C. The plate was once again washed twice in BSA/PBS before the pelleted cells were resuspended in 200 µL of PFA/PBS. Prior to analysis of the stained cells, a ¼ dilution of the cells was performed by transferring 50 µL of each well to the corresponding well of a new microtitre plate which contain 150 µL of PFA/PBS. To the wash wells (rows B, D, F and H), 200 μL of BSA/PBS was added. The plate was sealed with a perforatable plate sealer. For wells containing the stained cells, 20,000 events were captured (using pre-defined FSC-A/SSC-A gate) at a ‘slow’ flow rate (14 μL/minute) using an Accuri C6 flow cytometer (Becton Dickinson, US). Acquisition was performed beginning at well A1 and
86
working down each column in turn (Fig. 2-1). The intervening wash wells were acquired for 5 seconds in order to reduce carryover. Following acquisition, the mean MFI within the FL-2 channel for each stained wells were recorded. As such, two fHbp-specific MFI values were recorded for each strain in each assay run. 2.13.4 Analysis of MEASURE results data For each strain tested, median values and inter-quartile ranges were calculated using Microsoft Excel. Using Minitab 17 (Minitab Inc., US), Mann-Whitney tests were performed in order to compare differences in MFI. Differences generating a p-value of