The Development and Use of a Software Tool for Selecting Manufacturing Processes at the Early Stages of Design A. M. K. Esawi and M. F. Ashby Engineering Design Centre, University of Cambridge, Department of Engineering Trumpington Street, Cambridge CB2 1PZ, United Kingdom Tel: +44 1223 332600, Fax: +44 1223 332662 E-mail:
[email protected],
[email protected] Proceedings of the Third Biennial World Conference on Integrated Design and Process Technology (IDPT), Berlin, Germany, July 5 - 9, 1998, volume 3, pp 210 - 217.
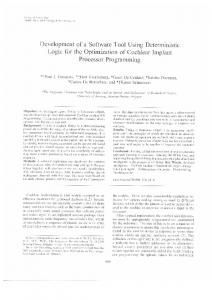
ABSTRACT Choosing the right manufacturing process for making a component is an important consideration at the early stages of design. Frequently, the choice of process is based on previous experience or tradition, thereby missing the opportunity to use a new or more suitable process. Lost opportunities could be avoided if the designer had access to a quick efficient selection tool that would guide the selection. In this paper, a systematic procedure for selecting the optimum process to manufacture a component is described. It is based on comparing the attributes required by the design (required material, size, shape, etc.) with those that lie within the capacity of a large number of processes, seeking the subset which is capable of making the component. The subset is then ranked by economic criteria. To do this, a database containing data on 125 processes was created. The Cambridge Materials Selector (CMS) software is used as the user-interface. The capabilities and limitations of the Processes Database and the Selection Methodology are described and documented through two case studies. The software is used to suggest a process by which each of two diverse components might be shaped, and the suggestions are compared with the known way in which the component was, in practice, made. 1 INTRODUCTION Manufacturing process selection is commonly based on human-resident experience or on established local practice. Done in that way, the opportunity to use a more suitable process may be missed or the process chosen to make some new and unfamiliar component may be mistaken. The CMS Process Selector, described in this paper, assists in the systematic selection of the best manufacturing process. A process – taking a broad view – is a method for shaping or finishing or joining a material. The kingdom of processes (Figure 1) contains broad families: casting,
deformation, moulding, machining, etc. Each family contains many classes: casting contains sand-casting, die-casting, and investment casting, for instance. These in turn have many members: there are many variants of sand-casting, some specialised to give greater precision, others modified to allow exceptional size, still others adapted to deal with specific materials. KINGDOM
FAMILY
CLASS & MEMBER
PROCESS ATTRIBUTES
DEFORMATION MOULDING POWDER
PROCESSES
Sand 1
Shell
Sand 2
Sand
Sand 3
Die COMPOSITE DEPOSITION
Size Range
Full Mould CASTING MACHINING
Material
Investment
Squeeze
Sand 4 Sand 5
Shape Min. Section Precision Finish Quality Cost
Ceramic Mould
Eco-impact
Permanent Mould
....
FABRICATION RAPID PROTOTYPING
....
Fig. 1 A schematic illustrating the taxonomy of the Process Database
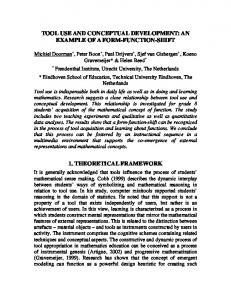
Each member is characterised by a set of attributes. It has material attributes: the particular subset of materials to which it can be applied. It has shapecreating attributes: the classes of shapes it can make. It has physical attributes which relate to the size, precision, finish and quality of its product. It has attributes which relate to the economics of its use: its capital cost and running cost, the speed with which it can be set up and operated, the efficiency of material usage and the economic batch-size. Each process is assigned a group of process classes, the structure of which is shown in Figure 2. Primary processes take unshaped material (liquid metal, or a powder, or a solid ingot) and give it shape. Thus casting processes are primary, though they can be discrete or
continuous. Secondary processes modify, add or refine features to an already-shaped body. As an example: fine machining is a secondary process, and it is one that can modify, add and refine features - thus a single process can belong to more than one class. In the same spirit, tertiary processes add quality either to the bulk or to the surface of a component (hot isostatic pressing of castings and shot-peening of surfaces are examples).
Table 1 Record for the Cosworth casting process
Name Cosworth Process Identifier QSACW__$$$ Short Name Cosworth Designation Casting: Cosworth
PROCESS CLASSES ALL DISCRETE
Primary Secondary
shape-modifying feature-adding feature-refining
Tertiary
bulk-modifying surface-modifying
Joining Finishing
CONTINUOUS
etc.
PROTOTYPING
Fig. 2
The classification of process types
2 THE CMS PROCESS DATABASE The CMS Process Database contains records for 125 processes, documenting their attributes. Table 1 shows a typical record. The record for each process contains a description of how it works, its typical uses and notes on its characteristics (text-files); a schematic of how the process works (an image-file); and several sets of attributes. The record also contains numerical data. Physical attributes describe the range of size, section, tolerance and surface roughness which lie within the "normal" capacity of the process. But - with a cost penalty - most processes can be pushed to an "extreme": a size, or precision, perhaps, which lies outside their normal range. These too are stored. The figure lists further physical attributes, stored as a "normal" range only: aspect ratio, adjacent section ratio, minimum hole diameter and minimum corner radius. The quality factor is a measure of the integrity of the final product (it can be increased by adding tertiary stages).
Description The COSWORTH process is a high-precision sand casting process developed for the production of premium quality aluminium alloy castings for the automobile industry. Zircon sand is used - in place of silica sand - in order to overcome the problem of unpredictable expansion, and therefore more accurate castings can be produced. Sand is mixed with a binder and shaped into a mould before the curing agent is introduced. The curing agent, in the form of a gas (the “gas hardening SO2 process”), is passed through the sand/binder mixture resulting in the polymerization of the resin. Metal is melted and held in an electric resistance furnace. The metal is transferred by a pump from the furnace to the mould and enters the base of the mould through gates. These gates, together with the pump control system, control the rate of mould filling and provide pressure assisted feeding. The absence of conventional gating and feeding systems results in castings free of porosity and inclusions. Physical attributes Size range (extreme) Size range (normal) Section (extreme) Section (normal) Roughness (extreme) Roughness (normal) Tolerance (extreme) Tolerance (normal) Aspect ratio Adjacent section ratio Hole diameter Min. corner radius Max. dimension Quality factor (1-10)
0.2 - 50 0.2 - 50 2.5 - 999 4 - 999 3.2 - 6.3 3.2 - 6.3 0.15 - 3 0.15 - 3 1 - 20 1-5 6 - 100 3 - 30 30 - 900 1-8
kg kg mm mm µm µm mm mm mm mm mm
Economic attributes Economic batch size (units) Economic batch size (wt) Capital cost Tooling cost Lead time Material utilisation (0-1) Production rate (units) Production rate (weight) Tool life (units) Tool life (weight)
1.00E+3 - 1.00E+6 3.00E+3 - 3.00E+6 1.00E+4 - 5.00E+4 500 - 3.00E+3 3-4 weeks 0.6 - 0.9 5 - 50 /hr 15 - 150 kg/hr 1.00E+4 - 1.00E+6 3.00E+3 - 3.00E+6
kg £ £
kg
Material Class M (METALS) light alloy nonferrous Process Class DISCRETE P (PRIMARY) Shape Class PRISMATIC SHAPES 3-D SHAPES Notes Very little limitation on shape
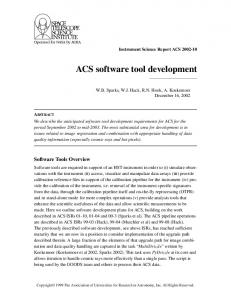
3 THE METHOD The starting point is the idea that all processes are potential candidates until shown otherwise (Figure 3). A short-list of candidates is extracted in two steps. The first, screening, eliminates processes which cannot meet the design specification. The second, ranking, orders the survivors by economic criteria. 3 . 1 SCREENING A typical 3-stage screening takes the form of Figure 3 (a). It shows three bar-charts, on each of which a numeric property is plotted for a selected class property. The processes are sorted in order of ascending value of the numeric property, which is plotted as a bar to show its range. The axes of the charts are chosen by the user. Any of the "class" and "numeric" attributes can be plotted: those shown in Figure 3 (a) are a good starting combination. The left-hand chart selects a process of a given type ("primary", for example - see Figure 2) which offers a tolerance better than ± T1 mm. The second specialises this to those which can shape a chosen class of materials* ("thermoplastic polymers", for instance) with a size between S1 and S2 kg. The third isolates the subset of these which are able to create a given shape+ (such as "3D solid, parallel features") and with a minimum section thickness as small as X1 mm. Further stages can be added.
Typical uses Aerospace components such as fuel system pumps and controls, flight refuelling manifolds, weapon mountings and light weight undercarriage components. Automotive castings such as cylinder heads, engine blocks, sumps and transmission cases.
Economic attributes are much harder to pin down, but broad ranges can be assigned to them. They include economic batch size n e , capital cost C c , tooling cost C T0, production rate n & and tool life nt. All the numeric attributes are stored as ranges, indicating the range of capability of the process. The record concludes with a set of references from which data were drawn, and which provide further information, essential in reaching a final selection. The data are drawn partly from standard sources (e.g. Schey, 1977; Kalpakjian, 1984; Bralla, 1986; Edwards and Endean, 1990; Clegg, 1991) and partly from interviews with industries which process materials.
Extr eme Normal
Extre me Normal
Norma l
Norma l
E xtreme
E xtreme
Size
Tolerance
References Clegg, A. J. (1991) Precision Casting Processes, Pergamon Press, UK.
All processes
P rocess
T < T1
M aterial
S1 > S > S2
E xtreme Nor mal
Min. Section
Table 1 Record for the Cosworth process (continued)
Normal Extr eme
Shape
X1 > X > X2
Sc reened subset
Fig. 3 (a) The SCREENING stage. The attributes of processes are plotted as s e l e c t i o n charts, created by the software. The attributes specified by the designer are plotted as selection boxes on the charts. The software retrieves the subset
* The current version of the selector divides materials into 9 classes of which “thermoplastic polymers” is one. + The current version of the software classifies shapes into 24 categories of which “3-D solid, parallel features” is an example.
of processes attributes.
which
meet
all
the
required
3 . 2 RANKING The second step (Figure 3 (b)) is that of ranking, using an estimate for the cost, C, of the product as a ranking-measure. Broadly speaking, C is made up of three terms, the first describing the consumables (the materials consumed in making a unit of the product), the second allocating an appropriate fraction of tooling cost to each unit of output, and the third measuring the contribution of the time-dependent cost or overhead-rate. Screened subset
Cost Ranking Enter:
Calculate:
Batch size, n
C=
. Overhead rate, C L Write-off time, t c
. Cm C C C + w + T + .L 1-f n n
with CR =
C C min
Relative Cost
Load factor, L
Selection All Processes
Selected Processes
Fig. 3 (b) The RANKING stage. User-defined variables are combined with economic attributes from the database to rank processes by relative cost. A simple selection box then captures the cheapest ones.
The three are grouped in square brackets in the equation & C C C C = m + Cw + T + L 1 − f n n&
(1)
Here Cm is the cost of the material of which it is made, f is the fraction of material which appears as scrap, Cw is the cost of the other consumables and energy associated
with manufacture of one unit of the product, C T is the cost of tooling, n the batch size (that is, the production
& L the overhead rate, and n & the rate of volume), C production. Tooling has a finite life; it may be necessary to replace it during a production run. We therefore expand the second term (the one describing the tooling costs) as follows n CT CT0 (2) n = n 1+ n t in which CT0 is the cost of one set of tooling and nt is the number of units which can be made before the tooling requires replacement. The tooling cost, C T0 , includes the cost of jigs and fixtures which are uniquely associated with the manufacture of the component, but it does not include the capital cost of the equipment or plant itself. & L , which we That is assigned to the overhead-rate, C write as C& L 1 & Cc (3) & = & C L0 + n n t c L & where C LO is the basic-overhead rate, C c is the capital cost of the equipment used to make the component, tc is the capital write-off time, and L is the load factor (the fraction of time over which the equipment is productively used). The economic attributes of each process include data for C c , f, C T0 and n t . The remaining parameters – & , the capital batch size, n, the basic overhead rate C LO write-off time, tc , and load factor L – are entered by the user. A relative cost is then calculated by dividing the cost estimate for each process, calculated from equation (1), by that for the cheapest one. With this information a bar-chart is constructed in which processes are plotted in order of increasing relative cost, as suggested in the figure. The order depends, of course, on the process attributes, but, importantly, it depends also on the values of the user-selected parameters, most significantly on batch size and capital write-off time. Processes offering the lowest cost are selected by superimposing a selection box onto the bar-chart, as before. We recognise that accurate cost estimation requires much more information than this. But accurate costing is not our aim. The software tool described here is designed to help in the early stages of process selection, and to prompt the user not to overlook alternatives. The two case studies which follow illustrate the method. 4 CASE STUDY: ELEVATOR CONTROL QUADRANT This component, shown in Figure 4, is part of the control system for the wing-elevator of a commercial
aircraft. It is to be made of a light alloy (aluminium, magnesium or titanium) and weighs about 5 kg, and is exceptionally complex in shape (“3D-solid with transverse features”). The quality must be very high (level 8 or better) since the component is used in a critical application. The minimum section thickness is 5 mm, and - apart from the bearing surfaces - the requirements on surface finish and precision are not strict (surface finish £ 10 µm and precision £ 0.5 mm). Table 2 lists the requirements.
We next seek the subset of primary processes which can produce the desired section thickness. “Primary” was selected as the process class on the x-axis and section range was chosen as the y-axis (Figure 6). The selection box specifies the requirement of a section thickness in the range 4-6 mm. Many processes pass.
Fig. 4 Elevator Control Quadrant [source: Casting Design Handbook (1962)] Table 2
Elevator Control Quadrant: design requirements
Material Class: light metal Process Class: primary, discrete Shape Class: 3D-solid-transverse features Size: 5 kg Minimum Section: 5 mm Precision: 0.5 mm Surface Finish: 10 µm Quality Level: 8 or better Batch Size: 100 The Selection: Figures 5 - 10 show the selection. Figure 5 shows the first of the selection stages: a bar chart of size range against material class. “Light metal” was selected from the material class menu. The selection box is placed at a size in the range 4-6 kg. Many processes pass this stage, though those which cannot process light alloys are eliminated.
Fig. 6 A chart of section thickness range against process class
The next selection stage is shown in Figure 7. It is a bar chart of tolerance against shape class selecting “3Dsolid-transverse features” from the shape class menu. The selection box specifies the tolerance requirement of 0.5 mm or better.
Fig. 7 A chart of tolerance against shape class
In the next stage, surface finish is plotted against process class (Figure 8). The roughness requirement of £ 10 mm is relaxed and therefore most processes passed. The bearing surfaces will require a secondary process step.
Fig. 5 A chart of size range against material class
Fig. 8 A chart of roughness against process class.
The next selection stage involves the quality control stage. Figure 9 shows a chart of quality level against material class. Because the quadrant will be used in a quality-critical application, a quality level of 8 or higher was chosen. Processes such as slip casting, ceramic mould casting, and certain powder processes fail this stage.
Fig. 9 A chart of quality level against material class
The last selection stage involves a cost-based ranking step (Figure 10). A batch size of 100 units was chosen and the cost of making the quadrant using all discrete processes in the database was calculated. The processes which passed all the previous selection stages are labelled. The selection box identifies the processes which can produce the quadrant at the lowest cost. They are listed in Table 3. Table 3:
Fig. 10 A chart of relative cost against process class
Conclusions and Postscript: Five processes emerged as suitable candidates for making the elevator control quadrant. According to our cost-based ranking, the most suitable process for making a batch size of 100 is manual machining. The final choice between the successful processes depends on local conditions such as the availability of equipment and expertise. A more detailed cost analysis is thus needed before a final decision is made. The requirement that the shape is a complex one resulted in many processes failing. Several other processes failed the quality stage. A process chain, therefore, could be a possibility. 5 CASE STUDY: CERAMIC TAP VALVE Household taps, increasingly, are fitted with ceramic valves: they wear better and are less liable to deposits than the traditional rubber-on-metal valve. A ceramic valve consists of two disks mounted one above the other, spring-loaded so that their faces are in contact (Figure 11). For a hot water valve, zirconia is a good choice for material for the disks. Each disk has a diameter of 20 mm, a thickness of 5 mm and weighs about 10 gm. In order to seal well, the mating surfaces of the two disks must be flat and smooth, requiring high levels of precision and surface finish; typically precision < 0.01 mm and surface finish < 0.1 µm.
Processes for the elevator control quadrant
Standard machining (manual) Cosworth process Standard machining (automated) Shell casting Investment casting (automated)
Fig. 11
Ceramic Tap Valve [source: Ashby (1992)]
Table 4 Ceramic Tap Valve: design requirements
Material Class: fine ceramic Process Class: primary, discrete Shape Class: 3D-solid-parallel features or prismaticnonaxisymmetric-solid Size: 0.01 kg Minimum Section: 5 mm Precision: 0.01 mm Surface Finish: 0.1 µm Batch Size: 1,000
Figure 14 (a) is a chart of tolerance against process class. “Primary” processes are plotted, the selection box imposes the tolerance requirement of 0.01 mm. Such a strict tolerance requirement has resulted in almost all the primary processes failing the stage, even though extreme tolerance ranges for each process were plotted.
The Selection: We seek first the subset of processes which can shape fine ceramics (Figure 12). Size range is chosen as the yaxis. The selection box identifies ceramic-shaping processes which can produce a size of about 0.01 kg. Fig. 14 (a) A chart of tolerance against process class
It is clear that a secondary process will be needed in addition to the primary one to achieve the desired level of tolerance. But first, the tolerance level was relaxed to 0.5 mm in order to identify the primary processes which have passed all other requirements (Figure 14 (b)). A large number of processes now pass.
Fig. 12 A chart of size range against material class
The next selection stage, in Figure 13, is a bar chart of section thickness against shape class. The tap valve has a disk shape which can be described as either “3Dsolid-parallel features” or “prismatic-non-axisymmetricsolid”. The two shapes are selected from the shape class menu and plotted on the x-axis. The selection box is placed at a section thickness in the range 4-6 mm. Fig. 14 (b) A chart of tolerance against process class
The chart in Figure 15 is a plot of tolerance again, but this time “secondary-feature refining” processes were selected from the process class menu and plotted on the xaxis. The ones capable of achieving the desired level of tolerance are contained in the selection box. These are polishing and grinding. The primary processes in Figure 14 (b) can thus be combined with the secondary processes from Figure 15, an example of the stacking of processes to satisfy strict design requirements. For now, we will focus on identifying the successful primary processes. Fig. 13 A chart of section thickness range against shape class
polishing have been identified as able to meet the specification. 6
Fig. 15 A chart of tolerance against process class
The last selection stage involves a cost-based ranking step (Figure 16). A batch size of 1000 units was chosen and the cost of making the valve disk using all discrete processes in the database was calculated. The processes which passed all the previous selection stages are labelled. The selection box identifies the processes which can produce the valve at the lowest cost. They are listed in Table 5.
Fig. 16 A chart of relative cost against process class Table 5: Processes for the ceramic tap valve
Die pressing (P/M) Powder injection moulding (PIM) Conclusions and Postscript: Three processes emerged as suitable candidates for making the ceramic disks. The requirement to make the disks out of zirconia eliminated most other processes. Of the successful ones, die pressing and powder injection moulding are the most suitable for making a batch size of 1000, according to our cost-based ranking; HIPing is considerably more expensive. The final choice between the two depends on local conditions such as the availability of equipment and expertise. As noted before, neither process can achieve the desired level of precision and therefore would have to be combined with a secondary process, of which grinding and
SUMMARY AND CONCLUSIONS The current process selector, containing data for 125 processes, allows rapid, efficient attribute-based selection to meet a set of design requirements. It is exceptionally broad in its scope. The starting premise is that all process classes are candidates until eliminated by criteria which include: material and shape, and on specific numeric attributes such as achievable tolerance, size and section thickness. The surviving candidates are ranked approximately by cost, using an algorithm which includes the influence of batch size. At this level, the selector works well. In its present form it is broad but its resolution is limited. It is less satisfactory when the subtler differences between competing processes or the less-obvious features of the process (the way in which cost scales with complexity, for instance) become of critical importance. There are ways in which they could be included: by increasing the size of the database to distinguish between variants of a single process; by including empirical or physicallybased models which capture the subtler and less obvious features; or by providing "further information" in the form of text, tables, graphs and images which provide the user with this information. All three are under active study at the present time. The system is currently limited to a single process step; any real manufacturing route combines processes to achieve the desired product attributes; casting to give the overall shape followed by machining to add features and precision, for instance. The present system can be extended to allow this, making use of the classification of processes as primary P, secondary S and tertiary T. Combinations such as P+S or P+S+T are created and an attribute envelope for the combination evaluated. The selection then proceeds as before but with a larger menu of potential candidates.
ACKNOWLEDGEMENTS This work has been supported by the EPSRC under a research grant to the Engineering Design Centre, Engineering Department, Cambridge, UK, and by the && generosity of the Korbe foundation through the award of the European Prize for Science. It is a pleasure to acknowledge numerous helpful discussions with Dr. D. Cebon and Dr H. R. Shercliff. REFERENCES Ashby, M. F. (1992) Materials Selection in Mechanical Design, Butterworth Heinemann, London, UK. Bralla, J. G. (1986) Handbook of Product Design for Manufacture, McGraw Hill, New York, USA. Casting Design Handbook (1962), American Society for Metals, Metals Park, Ohio, USA. Clegg, A. J. (1991) Precision Casting Processes, Pergamon Press, UK. CMS Software (1995), Granta Design Limited, Trumpington Mews, 40B High Street, Trumpington, Cambridge CB2 2LS, UK. Edwards, L. and Endean, M., editors (1990) Manufacturing with Materials, Materials in Action Series, The Open University, Butterworths, London, UK. Esawi, A. M. K. (1994), "Systematic Process Selection in Mechanical Design", Ph.D. thesis, Cambridge University Engineering Department, UK. Esawi, A. M. K. and Ashby M. F. (1997), “ComputerBased Selection of Manufacturing Processes”, Cambridge University Engineering Department, Report No. TR50, May 1997. Kalpakjian S., (1984), Manufacturing Processes for Engineering Materials, Addison Wesley, Reading, Mass, USA. Schey, J. A. (1977) Introduction to Manufacturing Processes, McGraw-Hill, New York, USA.