Under Review
Finally!: The Development and Validation of the Academic Procrastination Scale Justin McCloskey1 and Shannon A. Scielzo2 Abstract: Academic procrastination is a unique outlet of procrastinatory tendencies, and refers to when students needlessly delay completing academic related tasks, such as working on projects and studying. It has been linked to lower grades, poorer well-being, higher levels of stress, and ultimately is a vital predictor of success in college. The utilization of a well-developed up-to-date scale could prove invaluable to academic programs wishing to identify students at a higher risk of displaying these behaviors. The Academic Procrastination Scale (APS) was developed via a multi-phase, comprehensive validation approach, and attempts to address this need. Specifically, this scale demonstrates superior psychometric properties, and predicts academic related outcomes, better than other currently available measures.
Keywords: academic procrastination, scale development, college-readiness I. Introduction. It happens time and again: A student sits down to do a time-intensive project only to get distracted by friends. Another student plans to study during her lunch break, but a reality TV show takes precedence. Another student plans to work on his homework assignment, but gets caught up cleaning after his roommate instead. All of these are examples of academic procrastination. A unique form of procrastination, academic procrastination, is a less-studied and unique outlet of procrastination that offers insight into some of the underlying causes of student failures. There is, however, no current academic-specific scale to asses this important construct. The purpose of the current effort was to remediate this need: to develop, and provide initial validation evidence for, an updated scale designed to assess academic procrastination. Such a 1
Energy Future Holdings (TXU),
[email protected]. Department of Psychology, University of Texas at Arlington, 501 S. Nedderman Dr. Arlington, TX 76019,
[email protected]. 2
THE ACADEMIC PROCRASTINATION SCALE
2
scale can then be employed to further our understanding of this important construct, and to ultimately identify and subsequently provide remediation to academic procrastinators and increase their chances of educational success. II. Academic Procrastination. Academic procrastination refers to the tendency to needlessly put off or delay schoolrelated activities and behaviors. Academic procrastination occurs with students of all ages, whether those students are attending grade school or pursuing some type of educational attainment or degree. Procrastination among undergraduate students in college is particularly common and some studies have even found that over 70% of university students admit that they procrastinate regularly (Schraw, Wadkins, & Olafson, 2007). Such procrastination can place undue stress or anxiety upon individuals as they hasten to meet deadlines and complete assignments. Putting things off can not only affect one’s psychological well-being, but can also affect one’s relationship with others. As individuals fail to meet deadlines and commitments, relationships become strained. However, research is somewhat mixed on the effects of procrastination. For example, Schraw et al. (2007) argue that procrastination might have a useful adaptive advantage that allows students to garner better use of available study time. However, other studies have established that procrastination corresponds to less success in life (Ferrari, 1992). The concentration of this research, like most others, is on the negative form of procrastination. Regardless of the effects of procrastination, there appears to be numerous conceptualizations and components of academic procrastination. For example, Choi and Moran (2009) discussed what they referred to as active procrastination, which was comprised of four 2
THE ACADEMIC PROCRASTINATION SCALE
3
distinct characteristics. Specifically, it was proposed that those who actively procrastinate 1) prefer time pressure and 2) intentionally procrastinate. They are also 3) able to meet deadlines, and 4) are satisfied with the outcome. Later studies have discounted these four distinct characteristics of academic procrastination (Chu & Choi, 2005). However, numerous dimensions or facets of academic procrastination have been identified through past literature. Identifying those possible dimensions of academic procrastination, therefore, was the first step toward the creation of our comprehensive scale. Specifically, after careful review and analysis of the existing literature, we retained six unique facets of academic procrastination: a) psychological beliefs regarding abilities, b) distractions, c) social factors, d) time management, e) personal initiative and f) laziness. Each will be discussed briefly. A. Psychological beliefs regarding abilities. Although other studies have failed to validate the four-factor approach to active academic procrastination, studies have found that procrastinators tend to rationalize their tendencies to put things off and their ability to work under pressure (Wohl, Pychyl & Bennett, 2010). Therefore, one aspect of procrastination involves psychological beliefs about the ability to work under pressure. This has been defined in similar studies as sensation-seeking (Steel, 2010). In other words, academic procrastinators seek, either actively or passively, to work under pressure. Those who procrastinate have an undeniable belief in their ability to work under pressure. In fact, this belief in ability might have some basis in other psychological research. Students have what Sokolowska (2009) phrased as an academic self-concept. This self-concept is a self-reflective view individuals hold of themselves and students either believe themselves to be effective or ineffective students. The more students believe that they are effective, the more 3
THE ACADEMIC PROCRASTINATION SCALE
4
likely they are to procrastinate and “cram” before tests due to their self-confidence in their abilities and positive view of themselves. “Cramming” for tests is when students procrastinate, or wait until the night or hours before an exam or project to begin studying. Schraw et al. (2007) cite research which found that “crammers” experience a greater sense of challenge and excitement when waiting until the last minute to study. This challenge might promote an emotional allure for some students in which they feel more compelled to study during these sessions. However, research indicates that those who “cram” or procrastinate perform poorly in school (Steel, 2007). B. Distractions of attention. Studies on procrastination have determined that those who procrastinate are easily distracted by more interesting or fun activities. They intentionally place more pleasing activities ahead of appointments or deadlines. Procrastinating individuals tend to sleep, watch television, or play instead of working on more important things in order to distract or distance themselves from responsibilities. One reason students tend to distract themselves with other things instead of deadlines and schoolwork stems from the fact that, typically, tasks such as projects and assignments are aversive to students. “Consistently and strongly, the more people dislike a task… the more they procrastinate” and tend to choose more interesting activities instead of working on schoolwork (Steel, 2007, p. 75). This task aversiveness to important responsibilities is a hallmark of procrastinators. Those who procrastinate consistently turn to other activities and behaviors rather than concentrating on an intended course of action (Klassen, Krawchuk & Rajani, 2008).
4
THE ACADEMIC PROCRASTINATION SCALE
5
Distracting oneself from responsibilities also gives “an out” if one fails at that task (Steel, 2007). For example, if a student has an extremely difficult test or project due and is afraid of failing, he or she can protect self-worth or self-esteem by giving an outside excuse or external distracter for failing. Thus, the student instead distracts him or her self with another activity, blaming failure on said activity. Therefore, a unique characteristic of procrastinators is that they tend to immerse themselves in distractions. C. Social factors of procrastination. Research on procrastination has established that procrastinators tend to fail in selfregulation of behaviors in times of high stress (Klassen, Krawchuk & Rajani, 2008). Selfregulation involves the ability to adapt or regulate one’s performance under varying circumstances. Thus, procrastinators tend to disregard deadlines or projects when placed in stressful situations. Social factors, such as friends or family could keep one from keeping timelines or deadlines. This task aversion to school work was recognized by Brownlow and Reasinger (2000) as one of the major reasons procrastinators put off school work. Social factors can promote task aversiveness or task avoidance, both of which are dimensions of procrastination mentioned by Schraw et al. (2007). Traditional college students are those in their early adulthood and late adolescence, aged 18-23 years of age. Such an age is characterized by social adjustment and independence. Students attempt to juggle and schedule time with family, friends and work. Add a newfound sense of independence and autonomy to this struggle, and college students can turn away from school work and deadlines, and choose instead to work or socialize with friends. Therefore, social factors are indicative and promotive of procrastination. 5
THE ACADEMIC PROCRASTINATION SCALE
6
D. Time management skills. Time management can be defined as having an ability to consciously control activities and behaviors so as to maximize one’s available time (Mish, 1994). Procrastinators tend to have an inability to manage their time and experience a wide discrepancy between their actual intent and their behaviors. Difficulty in managing time was discovered in previous studies as a reason why students academically procrastinate (Solomon & Rothblum, 1984). Time management, a learned skill, is arguably “a critical contributor to procrastination in academic settings” (Sokolowska, 2009, p. 18). To succeed in an academic environment, students must show up on time to classes and keep deadlines. They must also complete assignments and tests by predetermined dates. Juggling a large course load, homework, projects and assignments usually requires an individual to maximize his or her free time. Poor time management could result in forgetting to turn in an assignment, unintentionally putting off studying until the last minute, or working on other, less important activities instead of academic work. E. Personal initiative. Some researchers have characterized procrastination as a “dysfunctional delay” (Steel, 2010, p. 929). Such a delay can occur not only because of social or situational variables but also because of attitudinal or personality characteristics such as initiative. Initiative is a general readiness or ability to begin or carry out tasks energetically (Mish, 1994). If a student lacks initiative, he or she will not have a certain drive to complete a task or assignment on time. Lack of motivation or personal initiative was mentioned by Caruth and Caruth (2003) as a reason for procrastination. Generally, students are more effective academically when they are motivated. Motivation is a drive to succeed and can either be internal or external. 6
THE ACADEMIC PROCRASTINATION SCALE
7
Those students who have an internal drive to complete academic work also procrastinate less. Conti (2000) found that students with intrinsic reasons for completing academic work procrastinate less whereas those who are externally motivated display more procrastinatory tendencies. Carden, Bryant, and Moss (2004) support this supposition and found that students who are internally-oriented procrastinate less academically when compared to those who are externally-oriented. Personal initiative is most synonymous to internal motivation. Therefore, it is proposed that those students who possess personal initiative and the intrinsic drive for completing their academic work procrastinate to a lesser extent. F. Laziness. Various other studies on academic procrastination have found a variety of up to three factors of academic procrastination. These factors include “fear of failure, task aversiveness, and laziness” (Schraw et al., 2007, p. 13). Laziness is a tendency to avoid work even when physically able (Mish, 1994). Aversiveness and laziness were factors that accounted for 18% of the variance in reasons for students’ procrastination according to Solomon and Rothblum (1984). If students are physically avoiding school work, they are merely putting off all of this work until the end of the semester. Thus, they are exhibiting a degree of laziness and task aversiveness. According to a recent theoretical study on procrastination, up to 40% of students stated that they would drop a college course if the professor expected too much of students or was too inflexible on due dates or deadlines (Schraw et al., 2007). III. Predicting Academic Success. The six facets just discussed are believed to collectively comprise the construct of academic procrastination. Individuals demonstrating lower levels of these behaviors should be 7
THE ACADEMIC PROCRASTINATION SCALE
8
more academically successful than those demonstrating more of these behaviors. Thus, a major consideration for this project is the extent to which the scale can predict academic success, and to what extent we can predict above and beyond other potentially similar well-established predictors, such as conscientiousness. A. Conscientiousness. Those who are conscientious are described as being dependable, organized and responsible (Davis & Palladino, 2007). Conscientious people tend to keep to deadlines and are able to delay gratification. Previous studies have supported the proposition that conscientiousness is a stable predictor of academic success in college (Cheng & Ickes, 2009). Those students who are highly conscientious should perform better academically. Academic success, however, can be measured a multitude of different ways. GPA is the most widely used measurement of academic success and thus will be used as the main academic success variable. Research has stated that those who are high in conscientiousness should perform better academically because they are more organized, responsible, and diligent in completing requirements. Thus, it is proposed: Hypothesis 1 Conscientiousness will be positively related to academic success. Procrastinators display behaviors contradictory to those expected of highly conscientious individuals - such as putting off deadlines and being inefficient. In turn, these two constructs should be negatively related. In support of this assertion, numerous studies have found high relations between the two (e.g., Choi & Moran, 2009). However, although highly related, studies have suggested that procrastination and conscientiousness are two distinct constructs (c.f., Steel, 2007). Previous studies have found as many as six factors that represent conscientiousness 8
THE ACADEMIC PROCRASTINATION SCALE
9
(Roberts, Chernyshenko, Stark & Goldberg, 2005). Only one of these factors represented and was indicative of procrastination, labeled as industriousness. “Procrastination may be considered to be the most central facet of conscientiousness, but it is not conscientiousness itself” (Steel, 2007, p. 67). Thus, procrastination and conscientiousness are two distinct, yet interrelated constructs. In turn, we believe that the relationship will hold for academic procrastination, specifically we hypothesize that: Hypothesis 2 Scores on the newly developed Academic Procrastination Scale will negatively correlate with measures of conscientiousness. Objective indicators of academic success are routinely used in studies on academic procrastination. However, the findings have been mixed. For example, one of the earliest studies using a self-report measure of procrastination, failed to find a significant relationship between college course grade and academic procrastination (Solomon & Rothblum, 1984). Similarly, Choi and Moran (2009) also failed to find a link between their assessment of procrastination and grade point average. In contrast, other studies, have found there to be a relationship between academic success and procrastinatory tendencies. In a seminal study on the effects of procrastinatory behaviors on academic success, Wesley (1994) suggested that academic success in college was not an invariant property of ability or success in high school. Instead, his results suggested that procrastination accounted for a significant proportion of variance in academic college success above and beyond that explained by academic success in high school or academic ability. A relatively recent meta-analysis on the effects of procrastination on grade point average (GPA), Steel (2007) reported a somewhat high negative correlation between procrastination and academic performance. 9
THE ACADEMIC PROCRASTINATION SCALE
10
It is proposed that conscientiousness does not, itself alone, explain and predict academic success in college. According to past research, “procrastination largely, although not entirely, accounts for the relationship of conscientiousness to performance” (Steel, 2007, p. 81). However, it is believed that the new scale on procrastination can predict academic success above and beyond that predicted by conscientiousness. Thus, it is proposed that: Hypothesis 3 Scores on the APS will negatively correlate with academic success. Hypothesis 4 The relationship between conscientiousness and academic success will be mediated by academic procrastination. Hypothesis 5 The new measure of academic procrastination will exhibit incremental validity beyond conscientiousness in predicting academic success. IV. Current Scales to Assess Academic Procrastination. To date, very little research has attempted the construction of a valid academic procrastination scale. Furthermore, of the scales developed to specially measure academic procrastination, all are arguably outdated. One of the very first attempts at developing a general scale related to procrastination resulted in the General Procrastination Scale (GPS; Lay, 1986). The GPS was a 20-item scale consisting of a reliability of .82 according to Cronbach’s alpha coefficient. However, Lay used a median split to describe those either high or low in procrastination and also relied heavily on a study design consisting of participants mailing back inventories to the researcher. Nevertheless, using this scale, Lay (1986) did not find procrastination to be related with grade point average for undergraduate college students. The GPS scale has received criticism on grounds that Lay (1986) defined procrastination as solely a lack of goal achievement. 10
THE ACADEMIC PROCRASTINATION SCALE
11
A. The Procrastination Assessment Scale-Students. The Procrastination Assessment Scale-Students (PASS) developed by Solomon and Rothblum (1984) is a widely used scale to assess academic procrastination. Up until that point, academic procrastination had been mostly measured by looking at behavioral tendencies such as amount of time spent studying. The PASS was the first recorded attempt at a self-report measure of procrastination. Although Solomon and Rothblum (1984) found that procrastination did not correlate significantly with academic performance, it was found that self-reported procrastination did significantly correlate with an objective behavioral indicator of procrastination. A major limitation of the PASS is that it consists of measuring procrastination tendencies in only six potentially limited areas of academic performance: writing term papers, studying, weekly readings, administrative tasks, attending meetings, and general academic tasks. Students are asked to indicate both their 1) level of procrastination and 2) degree to which procrastination is a problem on each task individually (Solomon & Rothblum, 1984). Other studies, however, have suggested that procrastinatory behaviors do not necessarily correspond to problems (Schraw et al., 2007). Thus, by summing up the scores on both questions, the authors may not adequately be assessing procrastination. Specifically, by aggregating the behavioral and perceived outcome components, important information may be lost and the resultant values unduly multi-dimensional/level. Nevertheless, the work conducted by Solomon and Rothblum (1984) provided the initial foundation for the measurement of academic procrastination and still in use today. B. The Active Procrastination Scale.
11
THE ACADEMIC PROCRASTINATION SCALE
12
Although not specifically assessing academic procrastination, a scale developed by Choi and Moran (2009), has been used in some academic contexts. Conducting exploratory and confirmatory factor analyses, they found procrastination to be a multidimensional construct. Theoretically, the first dimension represented outcome satisfaction and those who are satisfied with the products of their procrastination. The second dimension represented those who prefer the time pressures associated with procrastination. The third dimension consisted of identifying those who made an intentional decision to procrastinate while the fourth dimension identified the ability to meet deadlines. The reliability of the four dimensions of procrastination ranged from .70 to .83. Although a well-thought out scale, it appears to confound processes with outcomes (which may limit its utility in some regards). Further, the scale developed by Choi and Moran (2009) is not specifically an academic procrastination scale.
12
THE ACADEMIC PROCRASTINATION SCALE
13
C. Tuckman Procrastination Scale. Tuckman (1991) developed the Procrastination Scale (PS) that purports to measure task avoidance to academic activities. One of Tuckman’s major goals was to develop an easily adaptable self-report instrument which identifies academic procrastinators. Tuckman (1991) performed a factor analysis and identified a reliable (Cronbach’s alpha = .86) 16-item scale from an original item pool of 72 items. However, Tuckman’s first factor analysis consisted of a sample size of 50 participants, which is cause for considerable concern according to Tabachnick and Fidell (2007). Typically, factor analysis requires a large sample size of more than 300 participants to make valid conclusions. This extremely small sample size is the first issue of contention with using the PS. When Tuckman (1991) compressed his scale from 72 items to 35 items, he drastically reduced the size of his item pool based on a mere 50 responses. Using factor analysis with such a small sample size could have resulted in spurious conclusions. The second issue of contention resulted in the use of a 4-point Likert scale. Such a scale can artificially restrict the range of responses and promote a higher internal consistency coefficient with a lower variability of procrastination. By using defining middle anchors within the scale, one can also argue that Tuckman (1991) was measuring procrastination on a non-parametric ordinal scale. Furthermore, Tuckman (1991) validated his scale using a sample size consisting of only undergraduate juniors and seniors who were strictly education majors. Such a population restricts the range of procrastinatory tendencies and limits generalizability. It is proposed that through such disconcerting scale development, the PS cannot be reliably used on a diverse sample of 13
THE ACADEMIC PROCRASTINATION SCALE
14
undergraduate students since the original scale was developed using only one subgroup of undergraduates. In fact, studies have even imprudently used the PS on high school populations (Klassen & Kuzucu, 2009), on undergraduates with learning disabilities (Klassen, Krawchuk, Lynch & Rajani, 2008), and even in business settings (D’Abate & Eddy, 2007). Nevertheless, the Tuckman (1991) Procrastination Scale is used as the foremost academic procrastination scale in procrastination research. In fact, it has even been cited in over forty diverse articles on different facets of procrastination. In a recently published article in July, 2010 in the International Review of Applied Psychology, the PS was even implemented to examine levels of procrastination in students in Canada and Singapore (Klassen et al., 2010). Convergent validity was established by means of high correlations with objective measures of academic procrastination and correlations with other measures of academic procrastination and task delay (Steel, 2010). However, questions regarding the development of the scale lead to questions regarding its validity. It is believed that academic procrastination is multidimensional in nature. Thus, the goal of the current research was to develop a self-report scale on which academic procrastination can be validly and reliably measured and the entire structure of academic procrastination is considered. It is proposed that a far superior academic procrastination scale can be developed. Thus, it was proposed that: Hypothesis 6 The Academic Procrastination Scale (APS) will positively correlate with the Tuckman (1991) scale. Hypothesis 7 The new measure of academic procrastination will exhibit incremental validity beyond the widely used Tuckman (1991) scale in predicting academic success. 14
15
THE ACADEMIC PROCRASTINATION SCALE
V. Current Scales and Academic Success. Although procrastination has not always been a strong constant predictor of academic success, former studies have found a weak negative relationship between academic success and procrastination (Steel, 2007). In scale development, however, scales such as the Lay (1986) GPS and Solomon and Rothblum (1984) PASS did not uncover a significant relationship between procrastination and academic success as measured by GPA and course grade, respectively. The Choi and Moran (2009) scale also did not reveal a significant relationship between GPA and active procrastination. Although Tuckman (1991) did not relate academic procrastination to academic success, previous studies have found a significant negative relationship between the Tuckman (1991) scale and GPA (Klassen, Krwchuk & Rajani, 2008). During the pilot study on the APS, the current author found that GPA predicted scores on academic procrastination, suggesting a negative relationship between the two. Results suggest that scales measuring general procrastination are not valid predictors of academic success. However, scales more specific to academic life are, indeed, valid. Thus, low average correlations between academic success, r = .19, could be misleading when including more general scales on procrastination (Steel, 2007). It is believed that scales more specific to academic life, and more specifically to academic procrastination, will be far superior at predicting academic success. Hypothesis 8 The APS will exhibit incremental validity beyond the pre-existing scales assessing procrastination predicting academic success. Methods VI. Validation and Hypothesis Testing Approach. 15
THE ACADEMIC PROCRASTINATION SCALE
16
In order to properly develop and validate the Academic Procrastination scale, a multi-step approach was taken. First, the academic procrastination literature to date was carefully reviewed as discussed in the introduction, and our respective conceptual representation developed. Once an adequate conceptualization of the construct was obtained, a large number of items were developed. Subject matter experts (i.e., undergraduate and graduate research assistants wellversed in the topic) were employed to review the initial items and ensure content domain coverage. Once an initial set of items was identified, two different data collection studies were conducted allowing for a) initial inferences to be made and b) the measure to be refined in the pilot study, and in the latter study, c) for cross-validation and d) hypotheses testing to occur. Sixty-two resultant items were employed in the pilot study, with approximately equal numbers representing each of the 6 conceptual areas of academic procrastination: Laziness, Distractions, Beliefs about Abilities, Time Management, Social Factors and Person Initiative. Both data collection efforts will be discussed in turn. VII.
Pilot Study (Study I). The overarching goal of the first study was to identify the best items to be used for later
validation in the second study. Thus, the items were carefully evaluated, and the best items were selected to adequately represent the construct of interest. We also obtained some initial evidence for the potential efficacy of the measure from this data collection effort. A. Participants. Participants from a large Southern University were recruited via an experimental subject pool, and were able to complete the study online. Participants who signed up to participate in the survey and completed an informed consent were given a URL online link to a survey-hosting 16
17
THE ACADEMIC PROCRASTINATION SCALE
website. The sample used for this phase consisted of a total of 86 undergraduate college students. Participants were diverse in regards to ethnicity, academic major, and status. Previous studies have only included juniors and seniors in the development and validation of a scale on academic procrastination (e.g., Tuckman, 1991). B. Measures. Individuals participating in the study were first directed to provide their consent, and were then directed to a secure online survey. They survey consisted of the preliminary 63-item scale, the Tuckman (1991) Procrastination Scale, the John, Donahue, and Kentle (1991) Big Five Inventory, self-report GPA, and finally demographic information. Results Items were evaluated using several criteria: item endorsement indices, item discrimination indices, relations with other items, and relations with other scales. According to Nunnally and Bernstein (1994), “the primary criterion for including an item is the discrimination index, e.g., the corrected item-total [correlation] r” (p. 305). Nunnally and Bernstein (1994), however, do not recommend using correlations as the sole predictor of item selection. Instead, one should also look at the distributions of items. Even though high correlations relate to good discrimination, if all distributions were the same, the scale would likely only discriminate those scoring in the middle of the test, resulting in either low or high scorers. Therefore, item difficulties, or averages in this case, were used in selecting items. If items were only retained which had a mean of 4 on a 5-point Likert-type scale, the scale would be artificially restricting the range of the sample. When examining the distributions of items with a discrimination index above .5, it was determined that these items exhibited adequate distribution coverage. In fact, the 17
THE ACADEMIC PROCRASTINATION SCALE
18
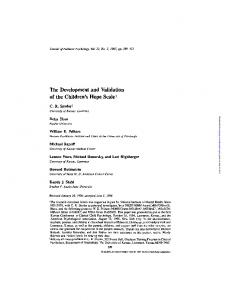
average item responses ranged from 1.80 - 3.58, indicating a good range of item responses. Nevertheless, a majority of items were included which were in the middle of the scale and reflected a more normal distribution. All items with item-total correlations of .5 and above were retained in the final scale. The final items were reviewed for domain coverage, again ensuring adequate coverage of the 6 conceptual areas. A total of 25 items were retained in the pilot study (see Appendix A for the items retained for the final scale). Although likely upwardly biased since items were selected based on related criteria, the overall internal reliability of the scale was .95 according to Cronbach’s coefficient alpha. The Academic Procrastination Scale and the Tuckman (1991) scale, as anticipated, were highly correlated (r = .85), indicating that over 70% of the variance in the two scales is shared. However, the current scale demonstrated superior predictive validity relative to the former. Specifically, an ANOVA indicated that students with different grade point average levels possessed differing levels of academic procrastination as indicated by the Academic Procrastination Scale, F(3, 73) = 4.58, p = .01, η2 = .16. As expected, those who had the highest GPA exhibited the lowest levels of academic procrastination, (M = 54.62, SD = 17.19). Those who had the lowest GPA exhibited the highest levels of academic procrastination, (M = 83.33, SD = 16.62). The more widely used Tuckman (1991) scale, however, did not find differences between GPA groups in terms of academic procrastination, F(3, 75) = 1.93, p = .13, η2 = .07, suggesting that the current scale may have a better potential to accurately identify academic procrastination. Of note as well, conscientiousness and the APS were highly correlated (r = -.59). The intercorrelations of relevant variables in the pilot study are displayed in Table 1.
18
19
THE ACADEMIC PROCRASTINATION SCALE
Table 1. Intercorrelations from pilot study.
1. Academic Procrastination Scale 2. Tuckman Procrastination Scale 3. Openness to Experience 4. Conscientiousness 5. Extraversion 6. Agreeableness 7. Neuroticism * p < .05 ** p < .01
1 .95 .84** -.14 -.59** -.09 -.19 .17
2
3
4
5
6
7
.92 -.19 -.72** -.24 -.21 .29*
.87 .06 .42** .28* -.23*
.80 .07 .39** -.35**
.86 .29* -.34**
.82 -.35**
.83
VIII. Cross-Validation and Hypothesis Testing Study (Study II). The goal of this study was to further examine and cross-validate the refined Academic Procrastination Scale (APS). In order to effectively validate the new measure, proposed relations with other constructs were examined. Moreover, the current tool was compared against the widely used Tuckman (1991) scale and other scales purporting to measure procrastination. Finally, the current study examined the reliability and factor structure of the scale to determine the pattern of relationships among items. A. Participants. A total of 681 participants were recruited for this phase, from the same university using the same approach. A total of 218 (32%) males and 462 (68%) females participated. Participants had varied undergraduate experience with 268 (39.4%) freshman, 176 (25.9%) sophomores, 162 (23.8%) juniors, and 67 (9.9%) seniors. Participants also consisted of a variety of academic majors. One hundred and sixty (23.5%) participants were psychology majors, 159 (23.3%) were nursing majors, 86 (12.6%) were science majors, 73 (10.7%) were undeclared or undecided, 69 19
THE ACADEMIC PROCRASTINATION SCALE
20
(10.1%) were education majors, 60 (8.8%) were liberal arts majors, 53 (7.8%) were business majors, and 14 (2.1%) participants were engineering majors. A diverse sample in regards to ethnicity was also obtained. Two hundred and fifty-three (37.2%) participants considered themselves Caucasian, 171 (25.1%) Hispanic, 104 (15.3%) African American, 96 (14.1%) Asian, and 53 (7.8%) participants considered themselves to be multi-racial or of another ethnicity. The average age of participants was 21 years (SD = 4.70). B. Procedure. Upon providing consent to participate in the study, participants were asked to complete a series of surveys used to assess academic procrastination (including the refined APS and other procrastination scales), general procrastination, personality, and demographic characteristics discussed below. A section of the online survey asked participants to consent to releasing a portion of their academic records (Scholastic Aptitude Test [SAT]/American College Testing [ACT] score information, cumulative GPA. and semester GPA). The Office of Institutional Research, Planning, and Effectiveness at the university provided this information upon the consent of participants. A total of 578 (84.9%) participants consented to releasing this information. The average SAT score of participants was 1039.71 (n = 379, SD = 150.32) and the average score on the ACT was 21.97 (n = 147, SD = 3.75). The mean grade point average was 2.77 (n = 566, SD = 0.84) for the semester and 2.79 (n = 572, SD = 0.74) for the cumulative average. C. Measures. Numerous measures were collected in the current study to test the proposed hypotheses and ultimately to evaluate the utility of the proposed scale. Specifically, the 25 items retained 20
21
THE ACADEMIC PROCRASTINATION SCALE
from the first study were administered, in addition to several marker procrastination scales, and finally scales measuring personality and academic success. Other procrastination scales used included the Tuckman (1991) Procrastination Scale (PS), the Lay (1986) General Procrastination Scale, the Soloman and Rothblum (1984) Procrastination Assessment Scale for Students, and the Choi and Moran (2009) Active Procrastination Scale. Our indicator of academic success was semester GPA (previously discussed, we also collected overall GPA), and for personality we collected the John, Donahue, and Kentle (1991) Conscientiousness sub-scale from the Big Five Inventory. Finally, we also used SAT and ACT scores (collected as previously discussed).
Results Prior to analysis, all variables were examined and screened to determine if they met the assumptions for regression. All variables in the present study were examined for normality. According to the normality plots, and the skewness and kurtosis statistics, all five procrastination scales were normally distributed. The personality variable, conscientiousness, also exhibited adequate normality. A. Introductory analyses. The overall internal reliability of the APS was .94 according to Cronbach’s alpha. These results are consistent with the previous reliability estimate from the pilot study. All other scales of procrastination also exhibited adequate reliability (αrange = .81 - .92). Furthermore, in regards to item discrimination, the range of corrected item-total correlations was .41-.73 indicating that each of the items adequately discriminated participants based on their overarching scores.
21
THE ACADEMIC PROCRASTINATION SCALE
22
Responses to the 25 individual items were summed to create an overall score for the scale. Scores on the APS ranged from 25-125 (M = 72.25, SD = 20.00). Overall, the averages for the individual items tended to fall in the middle of the scale. The averages for the individual items varied slightly, however, and ranged from 1.73 (“Tests are meant to be studied for just the night before”) to 3.41 (“When working on schoolwork, I usually get distracted by other things”). Although the item averages tended to be fairly consistent, individuals tended to disagree with the item “Tests are meant to be studied for just the night before,” and should thus be examined with caution in further studies employing the APS. Nevertheless, the standard deviations were fairly uniform and ranged from 1.04 to 1.36 demonstrating that the spread from the mean was fairly consistent. Convergent validity was assessed by examining the correlation of the APS with the previously validated scales of procrastination. The new procrastination scale was significantly positively correlated with the Tuckman (1991), Lay (1986), and Solomon and Rothblum (1984) scales. Interestingly, though, the Choi and Moran (2009) scale was negatively related to the other four scales. This can be explained in their definition of active procrastinators as those who are “able to complete tasks before deadlines and achieve satisfactory outcomes,” which is different from the traditional definition of procrastination as a negative behavioral tendency (p. 96). Furthermore, their focus of evaluation incorporates the outcome, whereas most other scales focus on perceptions of the underlying behaviors and processes. Also, whereas most procrastination scales tend to measure procrastination on a bipolar continuum (e.g. procrastination vs. nonprocrastination), the Choi and Moran (2009) scale tends to measure solely procrastination and its
22
THE ACADEMIC PROCRASTINATION SCALE
23
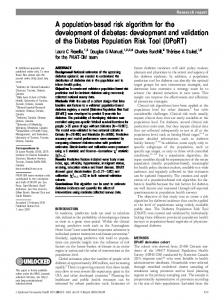
spread of outcomes. See Table 2 for the reliabilities and correlation table of procrastination scales and variables used in the main analyses.
23
24
THE ACADEMIC PROCRASTINATION SCALE
Table 2. Intercorrelations of scores on the Academic Procrastination Scale and relevant factors.
36
M(SD) 1 2 1. APS 72.25(20.00) .94 2. Tuckman (1991) 38.37(9.23) .70** .92 3. Lay (1986) 58.76(12.66) .64** .81** 4. Choi & Moran (2009) 65.86(14.73) -.17** -.24** 5. Solomon & Rothblum (1984) 33.45(8.10) .53** .64** 6. Conscientiousness 31.30(6.22) -.57** -.69** 7. Age 21.01(4.70) -.23** -.24** 8. Semester GPA 2.77(0.84) -.23** -.15** 9. Cumulative GPA 2.79(0.74) -.24** -.16** 10. SAT score 1039.71(150.32) .11* .12* Reliabilities are labeled along the diagonal where appropriate. * p < .05 ** p < .01
3
4
5
6
7
8
9
10
.87 -.20** .63** -.69** -.22** -.08 -.07 .12*
.81 -.25** .26** .12** .11** .11* .08
.85 -.50** -.15** -.18** -.16** .02
.81 .27** .16** .16** -.15**
~ .00 .01 -.19**
~ .89** .32**
~ .35**
~
B. Tests of the hypotheses. The first three hypotheses were tested using simple linear regression with one predictor in each model. The first hypothesis predicted that conscientiousness would be positively related to grade point average. As expected, conscientiousness significantly predicted semester GPA, = .16, t(548) = 3.73, p < .001, r2 = .03. The second hypothesis proposed that conscientiousness and procrastination were negatively related. The second hypothesis was supported conscientiousness was highly negatively related with measures of academic procrastination as recorded by the Academic Procrastination Scale, = -.57, t(606) = -16.99, p < .001, r2 = .32. For the third hypothesis, we predicted that the scores on the APS would be negatively correlated with semester GPA. The third hypothesis was also supported: scores on the APS significantly predicted, and correlated with, semester GPA, = -.23, t(514) = -5.43, p < .001, r2 = .05. For the fourth hypothesis, it was predicted that academic procrastination would mediate the relationship between conscientiousness and academic success. The Baron and Kenny (1986) approach to testing mediation was used. According to this approach, in order for mediation to occur, there must first be an observed relationship between the independent variable and dependent variable. It was determined previously that conscientiousness predicted academic success. Mediation also requires that a relationship exist between the independent variable and the mediator. Conscientiousness and procrastination were significantly related, = -.57, t(606) = -16.99, p < .001. Then, the mediator needs to significantly predict the dependent variable after controlling for the independent variable. After controlling for conscientiousness, procrastination still significantly predicted grade point average, = -.21, t(501) = -3.78, p < .001. Finally, to establish that there is complete mediation, the relationship between the independent and
dependent variable must become non-significant after controlling for the mediator. Indeed, after controlling for procrastination, conscientiousness no longer statistically predicted grade point average, = .03, t(501) = 0.56, p = .58. Thus, the fourth hypothesis was supported and the relationship between conscientiousness and academic success was fully mediated by academic procrastination. It was proposed that the APS would predict academic success in school. Moreover, the fifth hypothesis stated that academic procrastination would exhibit incremental validity beyond conscientiousness in predicting grades. Hierarchical linear regression was used, with conscientiousness entered in the first model predicting grades in school, and academic procrastination added in the latter. The results supported the fifth hypothesis. Academic procrastination added incremental validity in the prediction of grades, ΔF(1, 501) = 14.32, p < .001, ΔR2 = .03. Although this indicates that only three percent of the variance in grades was uniquely predicted by the procrastination scale, this number can become quite important and signify the difference between an ‘A’ and a ‘B’ in a college class. The current study also examined if the APS could determine grades beyond what is predicted by the more widely used Tuckman (1991) scale. Although the two scales were both highly correlated, r = .70, p < .001, supporting the sixth hypothesis, the APS exhibited incremental validity in the prediction of grades, ΔF(1, 490) = 15.98, p < .001, ΔR2 = .03. Thus, hypothesis seven was also supported. Again, three percent of the variance in grades was uniquely predicted by the APS after controlling for the Tuckman (1991) scale. Hypothesis eight predicted that the new scale would add incremental validity, above and beyond the four most widely used procrastination scales, in predicting grades. Hypothesis eight
was supported. The APS added incremental validity in the prediction of grades above and beyond the other scales, ΔF(1, 413) = 11.70, p < .001, ΔR2 = .03. Scores on the APS, β = -.29, t(413) = -3.42, p < .001, the Choi and Moran (2009) scale, β = .14, t(413) = 2.74, p < .01, and Lay (1986) scale, β = .25, t(341) = 2.92, p < .01, were all unique predictors of grades in school. All of the scales collectively accounted for approximately eight percent of the variance in grades whereas the APS uniquely contributed three percent. C. Supplementary analyses. SAT scores are routinely used to predict academic success in college. However, what if behavioral indicators such as academic procrastination could add predictive ability to grades in school? This was analyzed by looking at both SAT scores and scores on the APS simultaneously using regression. Both SAT scores, β = .35, t(341) = 7.07, p < .001, and academic procrastination, β = -.22, t(341) = -4.38, p < .001, were unique predictors of grades in school. In fact, both predictors were able to collectively account for approximately 16% of the variance in grades. The results indicate that as individuals score one standard deviation better on the SAT (147 point increase), they attain a .35 standard deviation increase in semester grade point average (.29 point increase). Results also indicate that if individuals score one standard deviation higher on the APS (18.39 point increase), indicating more procrastination, they attain a .22 standard deviation decrease in semester grade point average (.18 point decrease). Both SAT scores and academic procrastination were unique predictors of grades in school, indicating that if an individual performed both poorly on the standardized test (one standard deviation below the mean) and procrastinated more than the average individual, he or she would experience nearly a
half-point decrease in semester GPA. Thus an individual would attain a GPA of 2.53 rather than a 3.00 for the semester, a significant drop according to some individuals. Social desirability. A social desirability scale was also included in exploratory analyses to detect students who were replying in a manner to attempt to project favorably. It was believed that students might downplay the instances in which they procrastinate by either lying or altering their answers. Using a shortened version of the Marlowe-Crowne Social Desirability Scale (Reynolds, 1982; Crowne & Marlowe, 1960), individuals were categorized as socially desirable responders or not based on a mean split. The current study found that participants who projected themselves in a “good light” reported significantly lower levels of academic procrastination, F(1, 608) = 12.47, p < .001. Those individuals giving socially desirable answers reported lower levels of procrastination (M = 69.90, SE = 1.08), than those individuals not giving socially desirable answers, (M = 75.59, SE = 1.19). The same trend was found for the other procrastination scales. Exploratory Factor Analysis. An exploratory factor analysis was also conducted in order to examine the dimensionality of the new Academic Procrastination Scale. A principal component analysis (PCA) using a Varimax rotation was conducted on the 25 items of the APS. The Kaiser-Meyer-Olkin measure indicated that the sample was more than sufficient for analysis, KMO = .96 (‘superb’ according to Field, 2009). Multicollinearity between the variables was not a problem according to Haitovsky’s (1969) test, χ2H(300) = .002, p > .05. Four components had eigenvalues over Kaiser’s criterion of 1, and collectively explained approximately 57.85% of the variance. The scree plot was examined, however, and indicated that one component would best represent the data. In fact, when only one component was extracted, all but 2 items loaded higher than .50. This main factor accounted for approximately 42.50% of
the variance and the second highest factor only accounted for 6.40% of the variance. According to Hatcher (1994), another criterion for retaining components is the proportion of variance accounted for. A generally accepted guideline is to retain components that account for more than 10% of the total variance. All factors except for the first were below this threshold. Thus, when examining the 1) scree plot criterion and the 2) variance-accounted-for criterion, results indicated that all the items of the APS best represent a single underlying factor. Test bias. To determine if scores on the APS systematically varied with such irrelevant variables as gender, ethnicity, academic major, and academic year, an Analysis of Variance (ANOVA) was performed. The results suggested that scores on the APS did not vary by gender, F(1, 594) = 0.99, p = .32, ethnicity, F(4, 594) = 1.85, p = .12, major, F(7, 594) = 1.43, p = .19, or year, F(5, 594) = 0.74, p = .59. Thus, the APS did not discriminate between these groups. However, scores on the Lay (1986) scale discriminated between majors, F(7, 608) = 2.69, p = .01, whereas scores on the Choi and Moran (2009) scale discriminated between genders, F(1, 618) = 6.81, p < .01, with males reportedly procrastinating more than females, and ethnicities, F(4, 618) = 2.72, p = .03, with Caucasians reportedly procrastinating more than Asians. Not only are mean differences important to consider, but so is the ability of a tool to systematically predict outcomes across groups. Such test bias can be evaluated by a framework developed by Cleary (1968) and as reinterpreted by Lautenschlager and Mendoza (1986). When developing a scale, it must be determined that the test scores do not vary as a function of irrelevant or discriminatory (age, ethnicity, gender) variables when regressed on the criterion of interest. The criterion of interest in this case is overall GPA. Thus, the Lautenschlager and Mendoza (1986) approach will determine if the APS predicts overall GPA equally across groups.
The test is a step-down approach where an omnibus test of slope and/or intercept differences is performed first. Following a significant omnibus test, slope differences and intercept differences are tested separately. According to the preceding test bias approach, there was no test bias for gender. Thus, Males and Females did not experience any slope bias (regression line of APS on GPA was roughly the same) or intercept bias (Males and Females had roughly the same cumulative GPA across all levels of the APS). Test bias was also examined for ethnicity. A significant omnibus test indicated that differences could possibly exist between Caucasians and African Americans. After following up with slope and intercept tests, it was determined that there was a significant intercept difference between the groups. The results indicated that Caucasians at any given level of APS test score tended to have a higher overall GPA than African Americans at the same level of APS test score. In other words, grade point average would be underestimated for Caucasians relative to African Americans based on the same scores on the APS. Although not as pronounced, intercept differences also existed between Caucasians and Hispanics where Caucasians tended to have a higher overall GPA at all levels of the APS when compared to Hispanics. However, the Academic Procrastination Scale fared much better than the Tuckman (1991) scale in regards to test bias. In fact, intercept bias existed between Males and Females where Females at any given level of the Tuckman scale tended to have a higher overall GPA than Males at the same level. Both intercept differences (Caucasians tended to have a higher overall GPA at all levels of the Tuckman scale when compared to African Americans) and slope differences (Caucasians tended to have a lower overall GPA at higher levels of procrastination
whereas African Americans tended to have a roughly similar GPA across all levels of procrastination) existed between Caucasians and African Americans. Slope differences also existed between Caucasians and Hispanics where Caucasians tended to have a higher overall GPA at all levels of the Tuckman scale when compared to Hispanics. Discussion IX. General Discussion. Academic procrastination, referring to the tendency to unnecessarily delay completing academic-related tasks or completing academic related objectives, is a highly prevalent manifestation of procrastination. It has been found to be related to numerous indicators of academic success, and is likely an important predictor of student completion or conversely attrition. Despite the importance of this particular construct, and the potential implications of being able to accurately identify academic procrastinators and subsequently remediate deficiencies in their performance, the currently available self-report scales available are outdated and possibly deficient in many regards. The current study attempts to address this need and create a psychometrically sound, conceptually relevant measure to assess academic procrastination: the Academic Procrastination Scale (APS). Following the steps of good scale development (c.f., Nunnally & Bernstein, 1994), we first thoroughly assessed the procrastination and academic procrastination literature and identified 6 main components of academic procrastination: a) psychological beliefs regarding abilities, b) distractions, c) social factors, d) time management, e) personal initiative and f) laziness. Then, a large number of items were created, and subject matter experts helped ensure the adequacy of domain coverage. Two data collection efforts were then conducted to refine the
scale, and then to ultimately cross validate and test the proposed hypotheses further demonstrating support for the utility of the scale. The findings and theoretical implications are subsequently discussed. A. Prediction of academic success. The most prevalent indicator of student success available is that of grade point average (GPA). Over a decade ago, Wesley (1994) proposed that procrastinatory behaviors could predict grades in school. The current study tested this assertion with the new procrastination scale and found that procrastination did exhibit a significant relationship with grades in school. Specifically, individuals self-reporting higher levels of academic procrastination had lower GPAs. Moreover, the APS predicted above and beyond SAT scores predicting GPA. Admissions programs have possibly become overly reliant on predictors of academic success such as scores on the Scholastic Aptitude Test (SAT) failing to properly weight to consider other sources of information (Wesley, 1994) such as deficiencies in skills. Whereas the SAT is considered to be an assessment of underlying ability, our procrastination scale assesses a relatively modifiable tendency and in turn may offer some outlets for retaining and ultimately graduating students. Specifically, such a scale can prove valuable in identifying students with these tendencies, as they can subsequently be provided with some form of training or remediation. For example, those students who exhibit higher levels of academic procrastination could be given lessons in studying effectively and meeting deadlines and goals. If identified early enough, students can be given the right tools for overcoming procrastination and have higher chances of academic success.
B. Relations with conscientiousness. Similarly, personality indicators are commonly employed to examine the likelihood of future successes of individuals in various domains. For example, research has found that the effect of conscientiousness on academic GPA is generally small (Noftle & Robins, 2007). Nevertheless, researchers tend to agree that small effect sizes can make drastic differences in a student’s life. In this regard, Conard (2006) found that only a standard deviation increase in conscientiousness can result in a substantial increase in GPA. Thus, personality factors could be the difference between an ‘A’ student and a ‘B’ student. We supported these findings in the current study: conscientiousness exhibited a significant positive correlation with both indicators of academic success, semester GPA and cumulative GPA. As a person was more dependable, organized and responsible, he or she performed better in school. Further, we found as expected that conscientiousness and academic procrastination were negatively related. Personality psychologists have long since stated that personality characteristics are able to account for behavioral tendencies (Davis & Palladino, 2007). In fact, some even define personality as “a relatively stable pattern of thinking, feeling, and behaving” (p. 477). In this case, conscientiousness, being organized and dependable, was highly related to the behavioral response of procrastination. There appears to be some debate to the extent to which procrastination and conscientiousness form independent unique constructs (Steel, 2007). Measures are considered to be measuring the same construct when correlations exceed .70 (Nunnally & Bernstein, 1994; Tabachnick, & Fidell, 2007). The current findings from the APS support the contention that
these two constructs are unique, yet highly related constructs. As individuals possess greater conscientiousness, they are more likely to procrastinate less academically (but not necessarily). In contrast, both the Tuckman (1991) and Lay (1986) scales exhibited extremely high negative correlations with conscientiousness suggesting the contrary. In turn, it appears that the APS better differentiates between the personality variable of conscientiousness and the behavioral response of procrastinating. Although the two are highly correlated, it is believed that conscientiousness is a character trait and less malleable than academic procrastination. Thus, although the results indicating that higher conscientiousness correlates with greater academic success is interesting, individuals will find it hard, if not impossible, to change personality. Academic procrastination, being a distinct behavioral construct (arguably a skill) that can be willingly manipulated, allows individuals the prospect of altering academic success. When examining both conscientiousness and academic procrastination simultaneously, procrastination even exhibited a stronger relationship with grades. Specifically, we found that academic procrastination mediated the relationship of conscientiousness and academic performance. There have been numerous studies that have supported the notion that conscientiousness is a unique predictor of academic performance (Conard, 2006; Noftle & Robins, 2007). Some studies have established that behavioral characteristics such as class attendance mediate the relationship between conscientiousness and grades (Conard, 2006). However, no studies, to our knowledge, have looked at the behavioral tendency of procrastination as a possible mediator. The current meditational model and the development of the Academic Procrastination Scale add new theory to the assessment of academic grades. Academic procrastination can account for variance in academic outcomes above and beyond
conscientiousness. Although personality factors such as conscientiousness are diverse and stable constructs, academic procrastination has the potential to be more defensible in academic settings for its generalization towards academic work. This is because behaviors are much more objective and identifiable as compared to personality constructs. Furthermore, the findings herein suggest that, as anticipated, individuals may have a tendency to behave in a certain manner based on their traits (such as conscientiousness) whereas other factors (e.g., contextual factors, experience, etc) come into play to affect the prevalence of these behaviors. In other words, although individuals may be prone to procrastinating academically, interventions may help. C. Relations with previous scales. We further established a link of the new scale with previously validated scales - by examining the relation of the APS with the most widely used academic procrastination scale, the Tuckman (1991) scale and other scales commonly used to assess this construct. As expected, our scale did highly relate to the other scales. This in turn provides convergent validation evidence supporting the notion that the APS is assessing the underlying construct of academic procrastination, and inferences will be relatively similar to the other indicators. However, most importantly, the APS proved far superior at predicting grades in school demonstrating the need for an updated specific academic procrastination scale. In fact, when examined above and beyond the four other scales, the APS accounted for approximately 3% more variance. X.
General Psychometric Evaluation In regards to reliability, as evidenced by the high internal consistency, α = .94, a
homogenous scale was developed in the current study. Scores on the scale exhibited high reliability and participants were quite consistent in their reporting of academic procrastination,
providing support for a single underlying factor. Results from exploratory factor analyses further supported this contention. Although we identified numerous underlying antecedents (6 facets) to the construct, they are all generally highly related, indicating that there is one overarching manifestation of academic procrastination. Further, some individuals might argue that a shorter scale may be warranted, as an alpha coefficient exceeding .90 may be indicative of redundancy in the scale items (Nunnally & Bernstein, 1994). In regards to validity, we spent a great deal of time identifying and evaluating the content domain ensuring adequate content validity. We combined theoretical and conceptual considerations with empirical data to create and retain the best possible items. The marker variables collected allowed for us to thoroughly evaluate the efficacy of the resultant scale. Furthermore, the scale demonstrated the expected relations with other constructs of interest, in turn providing further support for its use. Specifically, the scale related to the older measures assessing academic procrastination as expected, related strongly to conscientiousness as anticipated, and predicted academic performance above and beyond our other indicators. Moreover, by conducting the study in two phases and making our final inferences based on the data from the second sample, we controlled for the effects of validity shrinkage (c.f., Cureton, 1950). Thus, there is substantial psychometric support for the use of this scale in various research related applications. XII.
Practical Implications. In addition to providing a superior tool for research purposes, almost all university and
college programs examine SAT scores and other academic success indicators for selection purposes. However, the current research found that the APS can add significant validity to such a
selection procedure. Although it is likely inappropriate to use for selection procedures, as these behaviors can likely be easily remediated, the measure could be used to identify higher-risk students. Once identified, these students could be provided with additional opportunities, such as training on issues such as time management, distractions, and personal initiative, or even more intensive preparatory courses. Given the likely costs incurred by employing such remediation strategies, accurate identification via a valid tool is imperative. Similarly, students could also self-identify themselves using this scale – and subsequently attempt to remediate some of their shortcomings. In many cases students are unaware of the reasons behind their academic failures, oftentimes utilizing externalization techniques (e.g., bad instruction from teachers, lack of support from family, too many job requirements, etc). By providing them with an opportunity to evaluate their own academic procrastination, it may provide another source of information for them in evaluating their likely ability to meet their academic goals. XIII. Future Research and Limitations. The current efforts demonstrated substantial support for the psychometric properties and potential efficacy of the APS. However, local validation studies should confirm the efficacy of the tool in other contexts before extensive efforts are undertaken. The current work was isolated to inferences from one sample, albeit demographically and academically diverse. In this regard, the test bias analyses, although in support of the APS relative to other scales, may indicate that there are some problems with the scale – or, that there are more substantive problems with grading and race. Specifically, it was found that Caucasians were likely to have higher GPAs
than African Americans and Hispanics, given the same APS score. It may be that there are other factors that come into play – and further research in this regard is warranted. As the supplementary analyses demonstrated, social desirability may come into play with self-report measures of academic procrastination. Since procrastination is generally a negative behavior, students might tend to downplay its presence. However, it is also plausible that individuals that continually attempt to come across in a socially-desirable light may also be more likely to ensure that they do not procrastinate. Further research is needed in this regard – but, in the interim, social desirability should be considered when using the scale.
APPENDIX I: The Academic Procrastination Scale (APS). The following questions assess your habits and routines as a student. Please answer the following as they apply to yourself. How much do you, yourself agree to the following statements? (Scored on a 1 to 5 Likert-type scale, with 1= Disagree and 5= Agree) 1. 2. 3. 4. 5. 6. 7. 8. 9. 10. 11. 12. 13. 14. 15. 16. 17. 18. 19. 20. 21. 22. 23. 24. 25.
I usually allocate time to review and proofread my work.* I put off projects until the last minute. I have found myself waiting until the day before to start a big project. I know I should work on school work, but I just don’t do it. When working on schoolwork, I usually get distracted by other things. I waste a lot of time on unimportant things. I get distracted by other, more fun, things when I am supposed to work on schoolwork. I concentrate on school work instead of other distractions. * I can’t focus on school work or projects for more than an hour until I get distracted. My attention span for schoolwork is very short. Tests are meant to be studied for just the night before. I feel prepared well in advance for most tests. * “Cramming” and last minute studying is the best way that I study for a big test. I allocate time so I don’t have to “cram” at the end of the semester. * I only study the night before exams. If an assignment is due at midnight, I will work on it until 11:59. When given an assignment, I usually put it away and forget about it until it is almost due. Friends usually distract me from schoolwork. I find myself talking to friends or family instead of working on school work. On the weekends, I make plans to do homework and projects, but I get distracted and hang out with friends. I tend to put off things for the next day. I don’t spend much time studying school material until the end of the semester. I frequently find myself putting important deadlines off. If I don’t understand something, I’ll usually wait until the night before a test to figure it out. I read the textbook and look over notes before coming to class and listening to a lecture or teacher. *
* Indicates reverse-scored items
References Allen, M. & Yen, W. (2002). Introduction to measurement theory. Long Grove, IL: Waveland. Baron, R. M., & Kenny, D. A. (1986). The moderator-mediator variable distinction in social psychological research: Conceptual, strategic and statistical considerations. Journal of Personality and Social Psychology, 51, 1173-1182. Brownlow, S. & Reasinger, R. (2000). Putting off until tomorrow what is better done today: Academic procrastination as a function of motivation toward college work. Journal of Social Behavior and Personality, 15(5), 15-34. Carden, R., Bryant, C. & Moss, R. (2004). Locus of control, test anxiety, academic procrastination, and achievement among college students. Psychological Reports, 95(2), 581582. Caruth, D. & Caruth, G. (2003). A company’s number one killer: Procrastination. Innovative Leader #577, 12(5). Cheng, W. & Ickes, W. (2009). Conscientiousness and self-motivation as mutually compensatory predictors of university-level GPA. Personality and Individual Differences, 47, 817-822. Choi, J. & Moran, S. (2009). Why not procrastinate? Development and validation of a new active procrastination scale. Journal of Social Psychology, 149(2), 195-211. Chu, A. & Choi, J. (2005). Rethinking procrastination: Positive effects of “active” procrastination behavior on attitudes and performance. Journal of Social Psychology, 145, 245264. Cleary, T. A. (1968). Test bias: Prediction of grades of negro and white students in integrated colleges. Journal of Educational Measurement, 5, 115-124. Conard, M. (2006). Aptitude is not enough: How personality and behavior predict academic performance. Journal of Research in Personality, 40(3), 339-346. Conti, R. (2000). Competing demands and complementary motives: Procrastination on intrinsically and extrinsically motivated summer projects. Journal of Social Behavior and Personality, 15(5), 47-59. Crowne, D. & Marlowe, D. (1960). A new scale of social desirability independent of psychopathology. Journal of Consulting Psychology, 24(4), 349-354. Cureton, E. E. (1950). Validity, Reliability, and Baloney. Educational and Psychological Measurement, 10(94), 94-96.
D’Abate, C. & Eddy, E. (2007). Engaging in personal business on the job: Extending the presenteeism construct. Human Resource Development Quarterly, 18(3), 361-383. Davis, S. & Palladino, J. (2007). Psychology (5th ed.). Upper Saddle River, NJ: Pearson. Ferrari, J. (1992). Procrastination in the workplace: Attributions for failure among individuals with similar behavioral tendencies. Personality and Individual Differences, 13(3), 315-319. Field, A. (2009). Discovering statistics using SPSS (3rd ed.). Thousand Oaks, CA: Sage. Haitovsky, Y. (1969). Multicollinearity in regression analysis. A comment. Review of Economics and Statistics, 51(4), 486-489. Hatcher, L. (1994). A Step-by-Step Approach to Using the SAS System for Factor Analysis and Structural Equation Modeling. Cary, NC: SAS Publishing. John, O., Donahue, E. & Kentle, R. (1991). The Big Five Inventory--Versions 4a and 54. Berkeley: University of California, Berkeley, Institute of Personality and Social Research. Klassen, R., Krawchuk, L., Lynch, S. & Rajani, S. (2008). Procrastination and motivation of undergraduates with learning disabilities: A mixed-methods inquiry. Learning Disabilities Research & Practice 23(3), 137-147. Klassen, R., Krawchuk, L. & Rajani, S. (2008). Academic procrastination of undergraduates: Low self-efficacy to self-regulate predicts higher levels of procrastination. Contemporary Educational Psychology, 33, 915-931. Klassen, R. & Kuzucu, E. (2009). Academic procrastination and motivation of adolescents in Turkey. Educational Psychology, 29(1), 69-81. Lautenschlager, G. J., & Mendoza, J. L. (1986). A step-down hierarchical multiple regression analysis for examining hypotheses about test bias in prediction. Applied Psychological Measurement, 10, 133-139. Lay, C. (1986). At last, my research article on procrastination. Journal of Research in Personality, 20, 474-495. Mish, F. (1994). Merriam Webster’s Collegiate Dictionary (10th ed.). New York: MerriamWebster. Noftle, E. & Robins, R. (2007). Personality predictors of academic outcomes: Big five correlates of GPA and SAT scores. Journal of Personality and Social Psychology, 93(1), 116-130.
Nunnally, J. & Bernstein, I. (1994). Psychometric Theory (10th ed.). New York: McGraw-Hill. Reynolds, W. (1982). Development of reliable and valid short forms of the Marlowe-Crowne Social Desirability Scale. Journal of Clinical Psychology, 38(1), 119-125. Roberts, B., Chernyshenko, O., Stark, S. & Goldberg, L. (2005). The structure of conscientiousness: An empirical investigation based on seven major personality questionnaires. Personnel Psychology, 58, 103-109. Schraw, G., Wadkins, T. & Olafson, L. (2007). Doing the things we do: A grounded theory of academic procrastination. Journal of Educational Psychology, 99(1), 12-25. Sokolowska, J. (2009). Behavioral, affective, cognitive, and motivational dimensions of academic procrastination among community college students: A Q methodology approach. Dissertation Abstracts International Section A: Humanities and Social Sciences, 70(6), 1-147. Solomon, L. & Rothblum, E. (1984). Academic procrastination: Frequency and cognitivebehavioral correlates. Journal of Counseling Psychology, 31(4), 503-509. Steel, P. (2007). The nature of procrastination: A meta-analytic and theoretical review of quintessential self-regulatory failure. Psychological Bulletin, 133(1), 65-94. Steel, P. (2010). Arousal, avoidant, and decisional procrastinators: Do they exist? Personality and Individual Differences, 48, 926-934. Tabachnick, B., & Fidell, L. (2007). Using multivariate statistics (5th ed.). Boston, MA: Pearson. Tuckman, B. (1991). The development and concurrent validity of the procrastination scale. Educational and Psychological Measurement, 51, 473-480. Van Eerde, W. (2003). A meta-analytically derived nomological network of procrastination. Personality and Individual Differences, 35, 1401-1418. Wesley, J. (1994). Effects of ability, high school achievement, and procrastinatory behavior on college performance. Educational and Psychological Measurement, 54(2), 404-408.