JOURNAL OF CHEMICAL PHYSICS
VOLUME 120, NUMBER 1
1 JANUARY 2004
The dynamics of conformational isomerization in flexible biomolecules. II. Simulating isomerizations in a supersonic free jet with master equation dynamics David A. Evansa) and David J. Wales University Chemical Laboratories, Lensfield Road, Cambridge, CB2 1EW, United Kingdom
Brian C. Dian and Timothy S. Zwier Department of Chemistry, 560 Oval Drive, Purdue University, West Lafayette, Indiana 47907-2084
共Received 7 August 2003; accepted 26 September 2003兲 Infrared-induced conformational isomerization of N-acetyl-tryptophan methyl amide is studied theoretically using a microcanonical Rice–Ramsperger–Kassel–Marcus description of the rates on potential energy surfaces calculated using the AMBER and OPLS-AA force fields. The results are compared with the experimental data from Dian et al. in the preceding paper 关J. Chem. Phys. 120, 133 共2004兲兴. An exhaustive search of the potential energy surfaces locates all minima and transition states on these surfaces. A simple model is proposed for the vibrational cooling, and an appropriate cooling rate is chosen as the standard conditions for the master equation simulations by comparison with experiment. The two potential energy surfaces differ in the relative energies of minima and the heights of key transition states, leading to differences in the dominant pathways and rates of conformational isomerization. The predicted quantum yields depend sensitively on the cooling rate, varying from the slow cooling limit in which equilibrium populations are achieved to the fast quenching limit in which conformational isomerization is shut off. The excitation energy is varied from 5 to 20 kcal mol⫺1. At the lowest energies, isomerization is completely quenched, while at the highest energies, equilibrium conditions are achieved. In between these extremes, the quantum yields are sensitive to the excitation energy, and can be used to locate the rate-limiting barriers to isomerization. © 2004 American Institute of Physics. 关DOI: 10.1063/1.1626541兴
I. INTRODUCTION
the PES, which represent the stable conformers. These transitions are mediated by transition states, defined as stationary points of the PES with one negative eigenvalue.2 Even small molecules can have relatively complex networks of connections between stable conformers and, in order to understand the overall kinetics of such systems, it is essential to be able to map the topology and barrier distributions of these pathways.3,4 If the vibrational energy per degree of freedom of a system is low compared to the barrier height for a given rearrangement pathway, then it is generally assumed that the rate can be described by a statistical theory, such as the Rice– Ramsperger–Kassel–Marcus 共RRKM兲 model,5 where energy is assumed to be equilibrated over all modes of a particular conformer. Vibrational spectroscopy naturally involves the excitation of a single mode of a molecule, and so the degree of applicability of statistical rate theories depends on the extent and rate of intramolecular vibrational relaxation. The experiments on NATMA show relatively little variation in the quantum yields when different modes of the same conformer are excited, but differing isomerization patterns when different conformers are excited, indicating that a statistical rate theory may be sufficient, provided the topology of the landscape is known. The present theoretical study seeks to model the experimental results on NATMA. A description of the low-energy region of the PES is provided using two empirical force fields. This allows an analysis of the dominant isomerization
The preceding paper 共Ref. 1兲 presented a description of the experimental methods used to study the IR-induced conformational isomerization dynamics in isolated flexible biomolecules following selective excitation of single conformations in their hydride stretch fundamentals. The methods of IR-UV hole-filling spectroscopy and IR-induced population transfer spectroscopy determine which products are formed, and in what abundance. By carrying out the IR excitation early in a supersonic expansion, cooling collisions have collected the population into the zero-point levels of the product conformational wells prior to interrogation of the final product populations. These methods were first applied to two methyl capped dipeptides, N-acetyl tryptophan methyl amide 共NATMA兲 and N-acetyl tryptophan amide. These molecules are large enough to possess several flexible sites that make them conformationally complex, but small enough that their potential energy surfaces 共PESs兲 can still be characterized and probed in some detail. The major results of the experimental work were sets of isomerization quantum yields following excitation of each of the unique amide NH stretch fundamentals of these molecules.1 Molecular conformational changes can be described theoretically in terms of transitions between local minima on a兲
Electronic mail:
[email protected]
0021-9606/2004/120(1)/148/10/$22.00
148
© 2004 American Institute of Physics
Downloaded 09 Nov 2007 to 165.124.161.175. Redistribution subject to AIP license or copyright, see http://jcp.aip.org/jcp/copyright.jsp
J. Chem. Phys., Vol. 120, No. 1, 1 January 2004
Conformational isomerization in biomolecules
149
pathways within a microcanonical RRKM description of the rates, and hence predictions for the time scale of isomerization events. The rate of cooling within the expanding supersonic free jet will clearly affect the reaction rates and product quantum yields, and so we develop a simple model for the collisional quenching of vibrational energy, and examine the effect of differing initial energies and cooling rates on the quantum yields following IR excitation. II. LANDSCAPE SEARCHING AND REPRESENTATION
The NATMA molecule was represented by two alternative all-atom empirical force fields, AMBER6 共using the parm96.dat parameters兲7 and OPLS-AA.8 The first stage in describing the system for each force field was to construct a database of minima and transition states connected via steepest-descent paths, using a parallelized landscape searching algorithm.9,10 Minima and transition states were located using eigenvector-following with a separate Lagrange multiplier for each eigenvector and the trust radius scheme for selecting step sizes.11,12 All stationary points were converged to a root-mean-squared gradient of less than 10⫺6 kcal mol⫺1 Å⫺1 . In brief, the search algorithm involves starting from a minimum in the database 共initially, just a single low-energy minimum兲 and perturbing the geometry by stepping 0.1 Å along the eigenvector corresponding to the lowest Hessian eigenvalue not already searched, then performing a transition state search. If the transition state search converges, then the two minima that it connects are found by minimization after stepping off 0.05 Å in either direction along the eigenvector corresponding to the negative Hessian eigenvalue 共the reactive mode兲. If one of these two minima is in the database, then the other minimum and transition state are added to the database, and the algorithm proceeds from the lowest-energy minimum in the database with unsearched eigenvectors. This search resulted in databases of 164 minima and 714 transition states for AMBER, and 178 minima and 836 transition states for OPLS-AA. The best way to visualize such databases is with disconnectivity graphs, which partition the minima into disjoint sets based on the energies of connecting transition states.13 A disconnectivity graph of NATMA for OPLS-AA is shown in Fig. 1. The graph is split into four main branches, corresponding to the four possible cis/trans peptide bond isomers. The most significant part of the landscape is the lowest energy all-trans region. The three lowest-energy minima found with both force fields correspond to the conformers that were predicted to be the most important in the experimental work,1,14,15 and are labeled A, B, and C according to the notation of Ref. 1. All the minima in the branch of the graph within which these three minima are connected are replotted in Figs. 2 and 3. For the majority of significant minima, it was possible to unambiguously match structures found in the two force fields, based on the root-mean-square displacement of their atomic coordinates. Nodes corresponding to these minima are labeled with capital letters, starting with experimentally observed conformers A, B, and C as previously discussed and proceeding alphabetically in ascending energy order ac-
FIG. 1. Disconnectivity graph for the NATMA molecule calculated using the OPLS-AA force field. The branches are labeled according to the orientation of the peptide bonds at the N and C ends of the amino acid. The energy is in units of kcal mol⫺1.
cording to the AMBER force field. Minima found in the OPLSAA force field but not in AMBER are labeled in Fig. 3 with lower case letters. While both force fields agree with the experimental finding that there are three dominant conformers, they differ in their prediction of the relative energy ordering. OPLS-AA has B⬍A⬍C and AMBER has A⬍B⬍C. This difference will clearly affect the predictions of the occupation probability. The experimental observation has P B⬎ P C⬎ P A , which is not in exact agreement with either force field if potential energy alone dictates the relative populations of the conformers. In reality, the populations downstream in the expansion depend on the relative energies of the minima and on the kinetics of cooling in the expansion. We will return to this point in Sec. V. Further differences between the potentials can be seen in the barriers between the different conformers. For OPLS-AA, the disconnectivity graph shows that the barrier separating minimum C from the global minimum B is much higher than the corresponding barrier between A and B. In contrast, for AMBER, the three lowest-energy minima are all separated by barriers of similar size 共5.5 kcal mol⫺1兲, with minima C and B separated by a slightly smaller barrier than A and B. The size of the barriers has consequences for the relaxation dynamics of the system, as described in Sec. VI.
Downloaded 09 Nov 2007 to 165.124.161.175. Redistribution subject to AIP license or copyright, see http://jcp.aip.org/jcp/copyright.jsp
150
Evans et al.
J. Chem. Phys., Vol. 120, No. 1, 1 January 2004
FIG. 2. Disconnectivity graph for the all-trans peptide bond region of NATMA calculated using the AMBER force field. The energy is in units of kcal mol⫺1.
III. THERMODYNAMICS AND KINETICS
If the normal mode frequencies of the minima and transition states are known along with their potential energies, it is possible to estimate the partition functions for each minimum and transition state, and hence the equilibrium occupation probabilities and rate constants for interconversion of conformers. For the purposes of modeling the behavior of NATMA in a molecular beam after excitation with an IR laser, we use the microcanonical ensemble. The equilibrium occupation probability of a minimum at energy E is P eq i 共 E 兲⫽
D i共 E 兲 , 兺 iD i共 E 兲
共1兲
where D i (E) is the density of states of minimum i. The rate constant for interconversion of minimum i to minimum j via a transition state † is given by RRKM theory as k †ji 共 E 兲 ⫽
N †共 E 兲 , hD i 共 E 兲
共2兲
where N † (E) is the sum of states available to the transition state at energy E, excluding the reactive mode. In the present work D i (E) and N † (E) were calculated within the harmonic approximation using the Beyer–Swinehart direct count method.16
FIG. 3. Disconnectivity graph for the all-trans peptide bond region of NATMA calculated using the OPLS-AA force field. The energy is in units of kcal mol⫺1.
Given the rates k †ji (E) for every process in the database, it is possible to describe the kinetics of the system via master equation dynamics, with the rate of change of occupation probability of minimum i given by d P i共 t 兲 ⫽ 关 k i j 共 E 兲 P j 共 t 兲 ⫺k ji 共 E 兲 P i 共 t 兲兴 , dt j⫽i
兺
共3兲
where k i j ⫽ 兺 † k †ji (E) is a sum over all transition states directly connecting two minima. For a microcanonical system with constant energy E, it is usual to solve Eq. 共3兲 via diagonalization of the symmetrized transition matrix W i j
冋
eq 1/2 W i j ⫽ 共 P eq ki j⫺␦i j j / Pi 兲
册
兺m k mi .
共4兲
However, the vibrational energy of molecules in the beam will naturally decrease with time, or distance away from the nozzle, as they collide with the buffer gas 共argon, in this case兲. Therefore, it is necessary to integrate Eq. 共3兲 numerically as a function of time, updating the rate constants k i j (E) as the energy changes. The Bulirsch–Stoer algorithm was used for this integration.17 It is difficult to obtain experimental predictions for the cooling rate, despite work with this aim.18,19 We model the decay of the energy theoretically, based on the collision rate of particles in a free jet. Following the analysis by Lubman et al.,20 the collision rate, z jet , is given by
Downloaded 09 Nov 2007 to 165.124.161.175. Redistribution subject to AIP license or copyright, see http://jcp.aip.org/jcp/copyright.jsp
J. Chem. Phys., Vol. 120, No. 1, 1 January 2004 2 ⫺1/2关共 ␥ ⫹1 兲 / 共 ␥ ⫺1 兲兴 ¯ 0 关 1⫹ 21 共 ␥ ⫺1 兲 Meff z jet⫽2 共 1/2兲 n 0 , 兴
Conformational isomerization in biomolecules
151
共5兲
where n 0 is the reservoir density (6.5⫻1019 molecules cm⫺3 ), is the average collision cross section 共estimated at 260 Å2兲, ¯ 0 is the mean velocity in the reservoir (1.5⫻105 cm s⫺1 ), ␥ is the heat capacity ratio (C p /C v , taken as the ideal gas value 5/3兲, and Meff is the local Mach number 共the ratio of the beam velocity to the local speed of sound兲. Meff has been fitted as function of distance from the nozzle, x, by Ashkenas and Sherman:21 Meff⫽3.26共 x/D⫺0.075兲 0.67⫺0.61共 x/D⫺0.075兲 ⫺0.67, 共6兲 where D is the diameter of the nozzle. Therefore, given the terminal velocity expansion of the supersonic free jet of helium (2⫻105 cm s⫺1 ), we can use Eqs. 共5兲 and 共6兲 to calculate z jet as a function of time. As our master equation simulation proceeds, every ⌬t⫽1/z jet a collision occurs, and the energy and rate constants are recalculated, along with z jet to determine the subsequent ⌬t. The remaining undetermined quantity is the amount of energy lost per collision, ⌬E. We approximate ⌬E⫽ 共 E⫺E zp兲 ,
共7兲
where E zp is the zero-point energy of the lowest minimum. This linear dependence appears reasonable based on previous work.18 This form is anticipated to be least accurate at low energy where the vibrational energy tends to zero, but isomerization will be complete well before these energies are reached. It is important to obtain quantitative experimental data for vibrational energy transfer in large flexible biomolecules, since little can be stated with certainty from a purely theoretical standpoint. This analysis leaves as an undetermined parameter, which controls the cooling rate in our model. The approximate value of can be estimated from experimental data, as described below. In Sec. VI A, we present the results for a range of possible values.
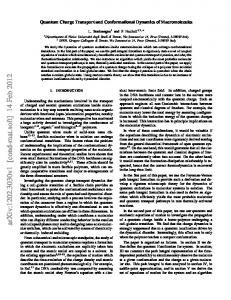
FIG. 4. A series of LIF scans taken at a range of distances from the expansion orifice.
I 0→1 ⫽exp共 ⫺⌬E/k B T 兲 . I 1→0
共8兲
A vibrational temperature of T vib⫽10– 15 K is derived from this analysis, consistent with the translational temperature calculated at that point in the expansion. Thus, vibrational cooling seems to be nearly complete at the point of excitation in the experiment. It is difficult to obtain an experimental estimate of the vibrational cooling rate in the supersonic expansion for a large flexible molecule, such as NATMA. Figure 5 shows a series of experimental IR-UV hole-filling scans taken as a
IV. EXPERIMENTAL COOLING DATA
To estimate the vibrational energy of the molecule after IR excitation, it is necessary to assess the extent of cooling in the early portion of the expansion prior to IR excitation. Figure 4 shows a series of laser-induced fluorescence 共LIF兲 scans taken at various distances from the expansion orifice. Closest to the orifice (x/D⫽0.8), the expansion is warmest, with little resolved vibronic structure. The other scans in the series show a regular progression toward colder conditions, with the vibronic structure due to the ground-state zero-point level population clearly visible by x/D⫽1.6, and hot band intensities decreasing smoothly. The IR-induced population transfer spectra were recorded with IR excitation occurring at x/D⫽2.5. The vibrational temperature can be estimated by comparing the intensities of the ⬙⫽0→⬘⫽1 cold band with that for the ⬙⫽1→⬘⫽0 hot band, labeled in Fig. 4. In a harmonic analysis, the Franck–Condon factors for these transitions are identical, leading to the following simple relationship between the observed intensity ratio and a vibrational ‘‘temperature’’ in the expansion
FIG. 5. Experimental IR-UV hole-filling scans taken with different separations 共hence, times兲 between the IR excitation and UV detection points. Taken with the IR laser tuned to a transition of conformer B.
Downloaded 09 Nov 2007 to 165.124.161.175. Redistribution subject to AIP license or copyright, see http://jcp.aip.org/jcp/copyright.jsp
152
J. Chem. Phys., Vol. 120, No. 1, 1 January 2004
Evans et al.
function of distance 共and time兲 between the IR excitation and UV detection points. The scans in Fig. 5 are taken with the IR laser tuned to an IR transition of conformer B at 3454 cm⫺1. When the IR and UV lasers are overlapped in space, with only 20 ns time delay, the IR-excited molecules are still quite hot, and produce a broad gain that stretches over the entire region surrounding the cold bands in the LIF spectrum. No conformational discrimination is possible at these early times. Analogous scans with longer delays show a narrowing of this broad absorption, but at no time is structure evident in the IR-excited molecules, except when they are cooled into the zero-point levels. This indicates that there is no significant bottleneck in the conformational cooling as the molecules approach the zero-point level. For the series of runs shown in Fig. 5, the cooling into the conformational zero-point levels begins to appear at about 400 ns, and is complete by 900 ns. Isomerization between the three main minima 共A, B, and C兲 will be frozen at much earlier times than this, when the energy falls below the rate-limiting barrier separating them. V. COOLING SIMULATIONS
The variation of E over time was calculated for values of ranging over several orders of magnitude. All runs started from an initial P B(0)⫽1, in order to model the cooling data shown in Fig. 5. ⬇0.003 gave the best fit 共see Fig. 6兲. As mentioned in Sec. II, the populations measured downstream in the expansion will be determined by both the equilibrium populations at the initial energy and the cooling rate. To determine the relative size of these effects, we carried out a simulation starting at the expansion orifice. The temperature of the reservoir, 425 K, corresponds to a mean vibrational energy of around 20 kcal mol⫺1. Therefore, we calculated the equilibrium population distribution at E⫽E zp ⫹20 kcal mol⫺1 , and used this as the initial population distribution in a cooling simulation with this initial energy, with the cooling rate give by ⫽0.003. The final populations of minima A, B, and C differed from the starting populations by around 10%, indicating that in the absence of IR excitation the energies 共and vibrational frequencies in the model used兲 of the minima are more important in determining the measured final populations than the effect of cooling. The main
FIG. 6. Variation of energy with time, calculated using the cooling model for different values of .
FIG. 7. Results for AMBER, exciting minimum C, with an approximation to the experimental cooling rate, ⫽0.003. The top plot shows the occupation probabilities for the labeled minima. The bottom plot shows the rate of population transfer, r i†j , for the labeled transition states, chosen to be representative of the two significant pathways. r i†j is positive for solid lines, negative for dotted lines, where the direction of each transition is as shown in Fig. 9.
difference between the initial and final populations is caused by the movement of population from higher-energy minima into the three dominant low-energy minima A, B, and C. In the experimental work14 conformer-specific IR excitation followed by conformer-specific UV spectroscopy allowed the population transfer out of a particular structure to
FIG. 8. Results for AMBER, exciting minimum A 共top兲, and minimum B 共bottom兲, with an approximation to the experimental cooling rate, ⫽0.003.
Downloaded 09 Nov 2007 to 165.124.161.175. Redistribution subject to AIP license or copyright, see http://jcp.aip.org/jcp/copyright.jsp
J. Chem. Phys., Vol. 120, No. 1, 1 January 2004
Conformational isomerization in biomolecules
153
TABLE I. The final occupation probabilities P if at the end of a 1 s simulation, for the A, B, and C minima. Results are given for two force fields and three different cooling rates, determined by 关see Eq. 共7兲兴. i(t ⫽0) is the initially excited minimum, P i (t⫽0)⫽1.0. E ex⫽10 kcal mol⫺1 for all simulations. P Af ⫹ P Bf ⫹ P Cf ⬍1 because of small populations in the other minima in the system. AMBER
OPLS-AA
i(t⫽0)
P Af
P Bf
P Cf
P Af
P Bf
P Cf
0.03
A B C
0.9580 0.0527 0.3454
0.0157 0.8826 0.4057
0.0175 0.0549 0.2128
0.3348 0.3347 0.2295
0.6218 0.6279 0.4289
0.0176 0.0151 0.2334
0.003
A B C
0.8011 0.4360 0.6004
0.1581 0.5044 0.3485
0.0338 0.0518 0.0437
0.3099 0.3105 0.3099
0.6222 0.6231 0.6222
0.0454 0.0442 0.0457
0.0003
A B C
0.6742 0.6741 0.6734
0.2818 0.2808 0.2780
0.0268 0.0267 0.0268
0.3155 0.3140 0.3191
0.6086 0.6118 0.5991
0.0295 0.0306 0.0267
be studied. We model this situation theoretically with each force field, using the subsets of minima depicted in Figs. 2 and 3 and the transition states that connect them. We set the initial population of a single minimum 共A, B, or C兲 P i (0) ⫽1, and all other P j (0)⫽0. This approach allows direct calculation of the quantum yields discussed in Ref. 1. From the LIF measurements discussed above, we have determined that virtually all of the vibrational energy is quenched out of the system before the point of IR excitation. Hence, we need only consider the addition of a single photon of IR energy and its subsequent removal by collisions. The energy of the IR photon is around 3500 cm⫺1, or 10 kcal mol⫺1. Therefore, we set the initial energy of the system to E init⫽E ex⫹E zero,i ,
共9兲 ⫺1
where the excitation energy E ⫽10 kcal mol and E zero,i is the zero-point energy of minimum i. We use an energy bin size of 0.0001 kcal mol⫺1 to discretize the energy levels for the purposes of Beyer–Swinehart counting. Values of P i (t) for runs starting from minimum C for the AMBER potential are plotted in Fig. 7, and from A and B in Fig. 8. For comparison, the expected equilibrium values at the initial energy P eq i are also shown, as calculated by Eq. 共1兲. The master equation approach allows not only P i (t) to be plotted for each minimum, but the net flow rate through each transition state, r †i j (t) can also be calculated as ex
r †i j 共 t 兲 ⫽ P j 共 t 兲 k †i j 共 t 兲 ⫺ P i 共 t 兲 k †ji 共 t 兲 .
ways, judged by the size of r †i j (t), are represented in Fig. 9. Two routes are shown to be dominant between C and A. The first is via minima D and I, which are significantly populated intermediates at times around 10⫺10 s. The population transfers through transition states 10 and 13 are almost indistinguishable after 10⫺10 s, showing that minimum H, which connects them, is only transiently populated; the steady-state approximation from elementary kinetics is appropriate here. A second path goes through minimum G. Again, the population transfers through transition states 19 and 38 are very close, and the population of G does not build up. The magnitude of the population transfer via this route is less than that for the first pathway, although it is shorter. The total barrier height along these two pathways is roughly the same, but it is more favorable to move over two smaller barriers 共transition states 1 and 2兲 to reach intermediate I than one large barrier 共transition state 38兲 to reach intermediate G. The analogous simulation data for the OPLS-AA potential is presented in Figs. 10 and 11, again using our best approximation to the experimental cooling rate, ⫽0.003. For this potential, it is clear that the equilibrium distribution is approached for all simulations, starting from minima A, B, or C. The dominant pathways are depicted in Fig. 12. VI. COMPARISON WITH EXPERIMENT
As noted above, neither force field gives correct predictions of the occupation probabilities when compared to ex-
共10兲
Figure 7 shows that, for ⫽0.003, the cooling is slow enough to allow relaxation to a roughly ‘‘equilibrium’’ distribution, where much of the population finds its way into the global minimum A. However, different distributions are reached in the simulations starting from minima A and B, indicating conformer specificity with this force field and this cooling rate 共see Fig. 11 and Table I兲. The final probability distribution in all cases is reached to within a few percent around 10–100 ns after IR excitation. A variety of alternative pathways for the transitions between minima A, B, and C are apparent. The significant path-
FIG. 9. Significant pathways as calculated using the AMBER potential. Minima are labeled with letters and the numbers above the arrows denote the transition states which link them. The direction of the arrows is arbitrary 共generated by the search algorithm兲 but it is necessary to have a label to describe the direction of the population transfer.
Downloaded 09 Nov 2007 to 165.124.161.175. Redistribution subject to AIP license or copyright, see http://jcp.aip.org/jcp/copyright.jsp
154
Evans et al.
J. Chem. Phys., Vol. 120, No. 1, 1 January 2004
FIG. 10. Results for OPLS-AA, exciting minimum C, with an approximation to the experimental cooling rate, ⫽0.003. The top plot shows the occupation probabilities for labeled minima. P eq i shows the equilibrium occupation probability of each minimum at the initial energy. The bottom plot shows the rate of population transfer, r i†j , for the labeled transition states, chosen to be representative of the two significant pathways. r i†j is positive for solid lines, negative for dotted lines, where the direction of each transition is as shown in Fig. 12.
periment. It is therefore unlikely that predictions of kinetic properties will be quantitatively accurate. As well as deficiencies in the potentials themselves, the harmonic approximation used to calculate densities of states may lead to inaccuracies, and a better description of anharmonicity 共particularly for the torsional degrees of freedom兲 would be desirable. However, it is true that some of the general experimental trends are replicated in the AMBER simulations for ⫽0.003. The experimental quantum yields for NATMA 关Fig. 12共a兲 of Ref. 1兴 show a small conformational specificity with a similar trend; namely, that excitation of a given conformer forms quantum yields biased toward reformation of this same conformer. The simulations indicate that this is because some of the population is trapped near the excited minimum, due to the quenching of vibrational energy at a fast enough rate for the molecules to be unable to cross all the barriers necessary to reach the equilibrium distribution. In contrast, the final populations in the AMBER simulation starting from an excited C conformer, and in all three OPLS-AA simulations, are relatively unaffected by the collisional cooling and tend toward the equilibrium values. This ‘‘slow cooling’’ limit does not give conformer-specific quantum yields. In order for the RRKM description to account for this aspect of the experimental data, we must be in the moderately ‘‘fast cooling’’ regime, as observed for the AMBER simulations starting from A and B. It is perhaps confusing that the same cooling rate should give different behavior in the AMBER force field depending on the starting minimum. In the simulation with P C (0)⫽1, the fast initial rate of popula-
FIG. 11. Results for OPLS-AA, exciting minimum B 共top兲, and minimum A 共bottom兲, with an approximation to the experimental cooling rate, ⫽0.003. P eq i shows the equilibrium occupation probability of each minimum at the initial energy.
tion transfer into minimum I results in population flow into A and B at roughly equal rates. However, the reverse reactions starting from P A(0)⫽1 or P B(0)⫽1 are slower to reach I, and therefore population transfer between A and B is hindered. A. Alternative cooling rates
Further simulations were carried out varying the cooling rate over two orders of magnitude, in order to investigate a range of possible behavior. The results are given in Table I, and are also represented diagramatically in the triangular plots of Fig. 13共a兲. At the slowest cooling rate, ⫽0.0003, both force fields are in the slow cooling regime, where no conformer-specific quantum yields are predicted. At the highest cooling rate, ⫽0.03, both force fields show significant conformer specificity, and the differences between the potentials are highlighted. With the AMBER potential, all runs show significant shifts of population toward the starting minima compared to the distribution reached at lower cooling rate, but the effect is greater for A and B, which are
FIG. 12. Significant pathways as calculated with the OPLS-AA potential. Minima are labeled with letters and the numbers above the arrows denote the transition states that link them. The labeling of transition states is not consistent between the AMBER and OPLS-AA potentials, as it was not possible to uniquely identify structures between the two databases, in contrast to the situation with minima.
Downloaded 09 Nov 2007 to 165.124.161.175. Redistribution subject to AIP license or copyright, see http://jcp.aip.org/jcp/copyright.jsp
J. Chem. Phys., Vol. 120, No. 1, 1 January 2004
Conformational isomerization in biomolecules
155
Simulations with P C(0)⫽1, however, show significant trapping of population in C, because the barrier between C and the other two conformers is higher. Considering the overall variations of behavior with cooling rate, the nonlinear curve observed for the AMBER simulations starting from C is interesting as this indicates that the ratio of A and B generated by exciting C depends on the energy decay of the system. B. Alternative excitation energies
FIG. 13. The quantum yields predicted by the cooling simulations. Simulations starting with initial population in the same minimum are connected by smooth lines. 共a兲 The data for different cooling rates for AMBER, and for OPLS-AA for excitation of C 共taken from Table I兲. The approach to the slow cooling limit as decreases is evident. 共b兲 The data for different excitation energies only for AMBER 共taken from Table II兲. The approach to the slow cooling limit as E ex increases is evident.
separated from the rest of the system by higher barriers than C. In OPLS-AA runs at ⫽0.03 starting with P A(0)⫽1 or P B(0)⫽1, the population equilibrates between A and B, because of the relatively low barrier between these minima.
All of the simulations described above used E ex ⫽10 kcal mol⫺1 , corresponding to the fundamental frequency of an NH stretch, which was the region probed experimentally. We also carried out simulations at different excitation energies: E ex⫽5 kcal mol⫺1 for a carbonyl stretch fundamental, E ex⫽7 kcal mol⫺1 for an ND stretch fundamental, and E ex⫽20 kcal mol⫺1 for an NH stretch overtone. The results of these runs are shown in Table II and Fig. 13共b兲 and constitute predictions for the qualitative behavior which might be seen in future experiments. It is clear that for the lowest energy, E ex ⫽5 kcal mol⫺1 , the population is almost entirely trapped near the starting point. Interestingly, a population of around 10% is predicted for minimum D in the runs starting from C 共not shown in Table II兲. There is a low barrier between these two structures, as shown in Figs. 2 and 3, and so it appears that, at this excitation energy, it is possible to trap population in a minimum which is not observed experimentally in the absence of IR radiation. There must be a delicate balance between cooling rate and excitation energy to allow this to happen, as at higher energies the system will be able to leave D via minimum I, whereas at slower cooling rates, the population would all return to C at longer times. The results for the highest energy, E ex⫽20 kcal mol⫺1 , are in the opposite slow cooling limit, where all the runs reach the same population regardless of the starting point. The runs at intermediate energies show behavior that lies
TABLE II. The final occupation probabilities P if at the end of a 1 s simulation, for the A, B, and C minima. Results are given for two force fields and four different excitation energies, E ex. i(t⫽0) is the initially excited minimum, P i (t⫽0)⫽1.0, and ⫽0.003 for all simulations. AMBER
OPLS-AA
i(t⫽0)
P Af
P Bf
P Cf
P Af
P Bf
P Cf
5
A B C
0.9995 0.0000 0.0006
0.0000 0.9995 0.0006
0.0000 0.0000 0.8970
0.8703 0.0237 0.0000
0.1276 0.9757 0.0000
0.0000 0.0000 0.8670
7
A B C
0.9919 0.0036 0.2446
0.0003 0.9742 0.2767
0.0034 0.0195 0.4290
0.3319 0.3282 0.0617
0.6621 0.6690 0.1235
0.0004 0.0000 0.6718
10
A B C
0.8011 0.4360 0.6004
0.1581 0.5044 0.3485
0.0338 0.0518 0.0437
0.3099 0.3105 0.3097
0.6223 0.6231 0.6222
0.0454 0.0442 0.0457
20
A B C
0.6532 0.6532 0.6532
0.2989 0.2989 0.2989
0.0407 0.0407 0.0407
0.3093 0.3094 0.3093
0.6238 0.6238 0.6239
0.0452 0.0451 0.0451
E
ex
Downloaded 09 Nov 2007 to 165.124.161.175. Redistribution subject to AIP license or copyright, see http://jcp.aip.org/jcp/copyright.jsp
156
Evans et al.
J. Chem. Phys., Vol. 120, No. 1, 1 January 2004 TABLE III. Results for simulations at different excitation energies. Y or N for a given I→J transition denotes whether measureable population 共⬎1%兲 was obtained in minimum J at the end of a cooling simulation starting with P I ⫽1. ⫽0.003 for all simulations. AMBER/OPLS-AA
E ex
A→B
B→A
A→C
C→A
B→C
C→B
5 7 10 20
N/Y N/Y Y/Y Y/Y
N/Y N/Y Y/Y Y/Y
N/N N/N Y/Y Y/Y
N/N Y/Y Y/Y Y/Y
N/N N/N Y/Y Y/Y
N/N Y/Y Y/Y Y/Y
Note: N⫽no. Y⫽yes.
between these two limits, and this is likely to be the most interesting regime for future work. The results are presented in alternative form in Table III. This format shows whether measurable population transfer between particular pairs of minima is predicted by the simulations when one member of the pair is excited. Again, these results could be compared to future experiments spanning a wider range of well-defined excitation energies. The points in Table III where there is discrepancy between the force fields 共the B→A runs兲 are interesting, as they indicate that the accuracy of potentials can be assessed to some extent. The points where different results are seen for the same pair of minima depending on the direction 共A→C, C→A and B→C, C→B兲 are also interesting, as they allow one to directly determine the relative energy of the two minima. For such variable excitation energy experiments, it would be desirable to use expansion conditions which produced slow cooling, to maximize the extent of isomerization once a particular barrier has been crossed. VII. CONCLUSIONS
Using empirical force fields and a simple statistical rate theory, we have identified the most important pathways for population transfer between the three main conformers of the NATMA molecule. We have investigated the dependence of the degree of conformational flexibility on the cooling rate in the beam, given a typical initial energy due to excitation of an NH stretch by an IR photon. Even in this simple system, multiple pathways are predicted to be significant which demonstrates the importance of having a global representation of the PES. The discrepancies between the two empirical force fields AMBER and OPLS-AA are significant, and they appear to predict different behavior at the experimental cooling rate. However, they do give valuable predictions for the lowenergy pathways, which could be refined by higher level ab initio calculations. For a simple model of the cooling behavior observed experimentally, it appears that the AMBER force field predicts barrier heights between the significant conformers that are consistent with some degree of conformer specificity in the quantum yields, whereas the OPLS-AA potential does not. We have shown that these conclusions are dependent on the cooling rate, and an accurate description of the decay of vibrational energy in the molecular-beam expansion would be desirable to better model these experiments. Simulations carried out at energies corresponding to
different regions of the IR spectrum also show varying behavior, providing an impetus for future experimental work. Clearly, regardless of the cooling rate, the simple RRKM picture will be unable to account for the mode-specific quantum yields. The experimental results show only a hint of such vibrational mode specificity 共i.e., with results falling just outside the error bars separating them兲 when the two amide NH stretch modes of conformer C were excited. Molecular dynamics simulations, where a particular normal mode is specifically stretched before the system evolves in time, could be used to investigate this, and the results compared with those obtained here to determine the extent of mode selectivity. Techniques applied recently to the anharmonic decay of normal modes in proteins could also provide useful information.22 The results presented here demonstrate that population transfer out of one minimum can occur through many transition states simultaneously 共see Figs. 7, 9, 10, and 12兲. It is plausible that IR excitation of a particular reactive mode could affect the balance of population transfer over these competing transition states, and hence the final quantum yield. ACKNOWLEDGMENTS
One of the authors 共D.A.E.兲 is grateful to the EPSRC for financial support. Two other authors 共T.S.Z. and B.C.D.兲 gratefully acknowledge the NSF Experimental Physical Chemistry program 共CHE0242818兲 and the Petroleum Research Fund, administered by the American Chemical Society 共35988-AC6兲 for their support of this work. 1
B. C. Dian, A. Longarte, P. R. Winter, and T. S. Zwier, J. Chem. Phys. 120, 133 共2004兲, preceding paper. 2 J. N. Murrell and K. J. Laidler, J. Chem. Soc. Faraday Trans. 64, 371 共1968兲. 3 D. J. Wales, J. P. K. Doye, M. A. Miller, P. N. Mortenson, and T. R. Walsh, Adv. Chem. Phys. 115, 1 共2000兲. 4 D. J. Wales, Energy Landscapes: Applications to Clusters, Biomolecules and Glasses 共Cambridge University Press, Cambridge, UK, 2003兲. 5 T. Baer and W. L. Hase, Unimolecular Reaction Dynamics 共Oxford University Press, New York, 1996兲. 6 W. D. Cornell, P. Cieplak, C. I. Bayly, I. R. Gould, K. W. Merz, Jr., D. M. Ferguson, D. C. Spellmeyer, T. Fox, J. W. Caldwell, and P. A. Kollman, J. Am. Chem. Soc. 117, 5179 共1995兲. 7 P. Kollman, R. Dixon, W. Cornell, T. Fox, C. Chipot, and A. Pohorille, Comput. Sim. Biomol. Syst. 3, 83 共1997兲. 8 W. L. Jorgensen, D. S. Maxwell, and J. Tirado-Rives, J. Am. Chem. Soc. 118, 11225 共1996兲. 9 M. A. Miller, J. P. K. Doye, and D. J. Wales, J. Chem. Phys. 110, 328 共1999兲.
Downloaded 09 Nov 2007 to 165.124.161.175. Redistribution subject to AIP license or copyright, see http://jcp.aip.org/jcp/copyright.jsp
J. Chem. Phys., Vol. 120, No. 1, 1 January 2004 P. N. Mortenson and D. J. Wales, J. Chem. Phys. 114, 6443 共2001兲. C. J. Cerjan and W. H. Miller, J. Chem. Phys. 75, 2800 共1981兲. 12 D. J. Wales and T. R. Walsh, J. Chem. Phys. 105, 6957 共1996兲. 13 O. M. Becker and M. Karplus, J. Chem. Phys. 106, 1495 共1997兲. 14 B. C. Dian, A. Longarte, and T. S. Zwier, Science 296, 2369 共2002兲. 15 B. C. Dian, A. Longarte, S. Mercier, D. A. Evans, D. J. Wales, and T. S. Zwier, J. Chem. Phys. 117, 10688 共2002兲. 16 T. Beyer and D. Swinehart, Commun. ACM 16, 379 共1973兲. 10 11
Conformational isomerization in biomolecules
157
R. Bulirsch and J. Stoer, Introduction to Numerical Analysis 共Springer, New York, 1991兲. 18 J. R. Barker, J. Phys. Chem. 88, 11 共1984兲. 19 M. Damm, F. Deckert, and J. Troe, J. Phys. Chem. 95, 2005 共1991兲. 20 D. M. Lubman, C. T. Rettner, and R. N. Zare, J. Phys. Chem. 86, 1129 共1982兲. 21 H. Ashkenas and F. S. Sherman, in Rarefield Gas Dynamics, 4th Symposium, edited by J. H. de Leeuw 共Academic, New York, 1966兲, Vol. II. 22 X. Yu and D. M. Leitner, J. Phys. Chem. B 107, 1698 共2003兲. 17
Downloaded 09 Nov 2007 to 165.124.161.175. Redistribution subject to AIP license or copyright, see http://jcp.aip.org/jcp/copyright.jsp