articles
The dynamics of object-selective activation correlate with recognition performance in humans Kalanit Grill-Spector1,5, Tammar Kushnir2, Talma Hendler3 and Rafael Malach4 1
Departments of Computer Science and Neurobiology, Weizmann Institute of Science, Rehovot 76100, Israel
2
Diagnostic Imaging Department, The Chaim Sheba Medical Center, Tel Hashomer 52621, Israel
3
Laboratory for Functional Imaging, Wohl Institute for Advanced Imaging, Tel-Aviv Sourasky Medical Center, Israel
4
Department of Neurobiology, Weizmann Institute of Science, Rehovot 76100, Israel
5
Present address: Dept. of Brain and Cognitive Sciences, Massachusetts Institute of Technology, Cambridge, Massachusetts 02139, USA Correspondence should be addressed to K.G.-S. (
[email protected])
To investigate the relationship between perceptual awareness and brain activity, we measured both recognition performance and fMRI signal from object-related areas in human cortex while images were presented briefly using a masking protocol. Our results suggest that recognition performance is correlated with selective activation in object areas. Selective activation was correlated to object naming when exposure duration was varied from 20 to 500 milliseconds. Subjects’ recognition during identical visual stimulation could be enhanced by training, which also increased the fMRI signal. Overall, the correlation between recognition performance and fMRI signal was highest in occipitotemporal object areas (the lateral occipital complex).
How long must we observe an object to recognize it? This seemingly simple question puts quantitative constraints on the duration of visual processing stages involved in object recognition and has profound implications both for understanding visual processing and for computational models of object recognition. Backward masking experiments1, in which briefly presented object images are immediately followed by a masking stimulus, indicate that a 150-ms exposure is sufficient to allow correct recognition in humans. Physiological recordings during similar behavioral tasks in macaques indicate that exposure durations of 50–200 ms are enough to evoke shape-selective responses in some inferotemporal neurons2–5. Functional neuroimaging allows us to ask which human brain regions show activity correlated with conscious recognition performance, and whether brain activation can occur without conscious recognition6. Right lateral occipital activation in MEG correlates with object detection in a backward-masking task7, and frontal activation in ERP recordings 150 ms after stimulus onset correlates with performance in a go/no-go categorization task8. However, neither technique accurately localizes brain areas. Other brain regions, such as primary visual cortex (Tootell et al., Soc. Neurosci. Abstr. 25, 3, 1999) and the amygdala9,10, can also reportedly be activated without visual awareness. Here we used psychophysical measurements and fMRI to answer these questions. Our results reveal a direct correlation between the ability to name briefly presented object pictures at various exposure durations, and the fMRI signal from ventrolateral object-related regions (the lateral occipital complex, LOC11,12). Moreover, training subjects to improve their ability to recognize objects presented for 40 ms correlated with increased fMRI signal compared to responses before training. Overall, across exposure duration and across trained and untrained conditions, the nature neuroscience • volume 3 no 8 • august 2000
correlation between recognition performance and fMRI signal in the LOC was highest among cortical object-related regions. Some of these results have been published as abstracts (T.K. et al., International Society for Magnetic Resonance in Medicine, 1, 106, 1998; K.G.-S. et al., Soc. Neurosci. Abstr. 25, 529, 1999).
RESULTS Mapping object-related areas We measured recognition performance (subjects’ ability to name objects) and fMRI signal from object-related cortical areas during the masking experiment (Methods; Fig. 1). Images of either objects or scrambled objects were presented for 20 to 500 ms, followed by a mask. We first localized brain areas that were preferentially activated by objects compared to scrambled images or blanks, regardless of presentation duration (Fig. 2a; Table 1). To relate these foci to established visual areas, we mapped the visual meridians that delineate borders of retinotopic areas13–16 for all subjects and then superimposed these maps on the functional maps (Fig. 2b). Object-selective regions lay anterior and lateral to retinotopic regions (blue, green and yellow in Fig. 2b), indicating that they were largely non-retinotopic. These object-selective foci included the lateral occipital complex (LOC), which has two putative subdivisions17. The lateral occipital (LO; red in Fig. 2) subdivision is lateral and posterior to MT, extending into the posterior inferotemporal sulcus, and also lateral to a lower field representation (green in Fig. 2b). The anterior–ventral subdivision in the posterior to mid-fusiform gyrus18 (pFs; orange in Fig. 2) is anterior and lateral to areas v4/v8 (refs. 15, 19, 20), extending into the occipitotemporal sulcus. In addition, a small object-selective region within the collateral sulcus (CoS; magenta in Fig. 2) was detected in 10 of 13 subjects. In 8 subjects, it partially overlapped an upper meridian representation and extended beyond it. Finally, dor837
articles
sal object-selective foci (DF; turquoise in Fig. 2) were also located outside retinotopic regions, and included the intraparietal sulcus (DF2) and an area anterior to v3a, possibly v7 (DF1). We analyzed the activation time course from each of these foci separately. Sensitivity to presentation duration For each stimulus duration, we subtracted the response to the control stimuli (mask followed by mask) from object epochs (object followed by mask) with the same timing (Methods). This removed non-selective components of the visual response, that is, the response to the mask and transients that might have occurred when images were changed. The object-selec- Fig. 1. Masking experiment. Subjects were presented with images of objects (top) or of scramtive signal decreased only slightly when objects bled objects (bottom) for 20, 40, 120 or 500 ms, followed by a mask created by randomly scramwere displayed for 120 ms compared to 500 bling the images. Subjects were instructed to covertly name the stimuli. This task becomes very ms, but its amplitude was substantially reduced difficult as the stimulus duration decreases. when exposure duration was 40 ms or less (Fig. 3). In contrast, activation of lower visual Subjects consistently improved their recognition performance areas was less affected by presentation duration; at exposures of 40 on the 60 images shown for 40 ms during training (Fig. 4). The and 20 ms, V1 activation remained high (84 ± 10% and 68 ± 9% of average recognition performance after training (scan 2) was the response at 500 ms, respectively; Fig. 3, green). 63 ± 3% (s.e.m.) compared to 18 ± 4% before training (scan 1). Concurrently, we measured recognition performance. SubThis training effect was largely specific to the learned pictures, jects named most (84 ± 4%) objects at the basic level (car, face, but learning also transferred somewhat to a second group of bird), 13 ± 2% of objects more generally (animal) and merely untrained images (34 ± 3%; Fig. 4). The magnitude of this trans3 ± 1% of objects at the subordinate level (space shuttle, duck). fer varied substantially among subjects. Subjects correctly recognized almost all images at exposures of Was this recognition performance improvement reflected in 500 ms (100 ± 1%, s.e.m.) and 120 ms (91 ± 2%), but perforthe fMRI signal? After training, we compared activation elicited mance decreased substantially at 40 ms exposure (18 ± 4%) and by trained images presented for 40 ms, untrained images shown was abolished at 20 ms. Both recognition performance (solid black for 40 ms and images presented for 120 ms (Methods). In a repline) and fMRI signal in object areas were highly non-linear funcresentative subject (Fig. 5a), activity in LOC voxels before (top) tions of image duration (Fig. 3). Furthermore, the functions for and after (bottom) training shows that object selectivity was simobject-selective signal in ventral foci (LO, pFs and CoS) and for ilar in both scans, that is, fMRI signal amplitude was similar for recognition performance at various durations were substantially 120-ms object presentation (medium gray) and scrambled epochs similar. Activity in dorsal object-selective foci (turquoise in (unshaded). However, training significantly increased LOC signal Fig. 3) deviated from the recognition curve at 40 ms (recognition amplitude in the 40-ms object epoch. decreased to 18 ± 4%, whereas DF signal decreased only to 52 ± 11%). We compared normalized fMRI signal (Methods) elicited by To exclude the possibility that these activation differences were trained images viewed for 40 ms before and after training across due to eye movements, we measured eye movements in five subjects object areas and subjects (Fig. 5b). The training effect was most (Methods). Overall, subjects maintained stable fixation during each pronounced in the LOC (LO and pFs), which showed about a epoch. Throughout the six minute experiment, gaze was confined twofold increase in signal amplitude after versus before trainwithin a circle whose average diameter was 2.28 ± 0.35o (s.d.). Occaing (ratio, LO, 2.20 ± 0.35 s.e.m.; pFs, 1.66 ± 0.23) for identical sionally (< 15 times during the experiment) and without any clear visual stimulation. Dorsal foci showed a similar, but much smallcorrelation to a specific set of stimuli, subjects made a saccade outer trend (ratio, 1.37 ± 0.37). In contrast, CoS and V1 showed side this circle, but immediately returned to fixation. virtually no change in activity (ratio, CoS, 1.17 ± 0.40; V1, 1.09 ± 0.06) despite the substantial change in recognition perTraining changed the recognition rate formance. The fMRI signal increased with improved recogniThese results suggest a correlation between selective activation of ventral object foci and recognition performance, but this might be due to unrelated fac- Table 1. Talairach coordinates. tors. For example, visual stimuli presented for Left hemisphere Right hemisphere 20 or 40 ms might be too brief to drive the x y z x y z hemodynamic signal, leading to decreased –44 ± 9 –67 ± 12 –3 ± 4 42 ± 3 –67 ± 7 –4 ± 7 fMRI signal unrelated to the recognition per- LO –41 ± 8 –46 ± 11 –20 ± 3 46 ± 7 –48 ± 6 –22 ± 5 formance. To address this issue, we dissociat- PFs –31 ± 3 –46 ± 12 –19 ± 4 29 ± 6 –43 ± 9 –15 ± 10 ed recognition performance and image CoS duration by training subjects to recognize DF1 –36 ± 4 –74 ± 5 16 ± 6 28 ± 6 –70 ± 9 19 ± 7 images presented for 40 ms (Methods). Thus, DF2 –26 ± 6 –73 ± 7 41 ± 6 24 ± 8 –76 ± 11 35 ± 6 recognition was enhanced while image dura49 tion remained constant. After training, we Talairach coordinates of object-selective regions in the masking experiments. Values are mean ± s.d. in mm. scanned the same subjects again. 838
nature neuroscience • volume 3 no 8 • august 2000
articles
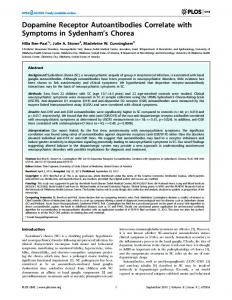
Fig. 2. Object-selective regions and visual meridian representations. (a) An example of object-selective foci in the masking experiment for one subject. Lateral occipital, LO (red); posterior to mid parts of the fusiform gyrus, pFs (orange); collateral sulcus, CoS (magenta); dorsal foci, DF (turquoise) included the intra-parietal sulcus (DF2) and an area anterior to v3a, possibly v7 (DF1); selective face voxels defined by an independent localizer scan (pink). In a few subjects, object-selective activation was detected also in the superior temporal sulcus (STS). (b) Object-selective regions superimposed on visual meridian representations. Blue, upper visual meridian representation; green, lower visual meridian; yellow, horizontal meridian; dashed lines, borders of retinotopic areas. Note that object-selective foci are located beyond retinotopic regions (green, blue, yellow). Ventrally, LO (red) is located lateral to a lower visual field representation and outside it. The pFs (orange) is located lateral and anterior to V4/V8.
tion in all subjects in LO and 9 of 11 subjects in pFs and DF, but only for 3 subjects in the CoS. Next, we examined activation elicited by untrained pictures presented for 40 ms in the second scan. Recognition performance was better for trained images than novel images (Fig. 4, scan 2) although exposure duration was identical and images were from the same object categories. In addition, fMRI signal was higher for trained than for novel images (Fig. 5a, bottom, compare 40 to 40n). We compared the object-selective signal ratio for these two image sets for all object-selective regions and subjects (Fig. 5c). Activation in LOC was higher for trained compared to novel images (ratio, LO, 1.74 ± 0.24 s.e.m.; pFs, 1.54 ± 0.34). However, 3 of 11 subjects showed a partial transfer of training from learned to novel images. Again, DF regions showed a similar but smaller trend (ratio, 1.25 ± 0.18). However, activation in CoS and V1 was similar for both image sets (ratio, CoS, 1.08 ± 0.22; V1, 1.04 ± 0.08). Across subjects, fMRI signal was higher for trained versus untrained images in 8 of 11 subjects in LO and pFs, in 9 subjects in DF and in 5 subjects in CoS, but only in 1 of 6 subjects in V1 (Fig. 6a). Because the LOC is a large complex (average number of voxels per subject, nv = 206 ± 41), it might contain specialized subregions with heterogeneous activation profiles, particularly category-specific activation. To explore whether such specificity may have affected the temporal dynamics of object activation, we separately analyzed face-selective voxels defined by an independent localizer scan (Methods; Fig. 2a, pink). Overall behavior was similar between the LOC excluding highly face-selective voxels (nv = 196 ± 40, Fig. 6b, red) and all LOC voxels (Fig. 6b, magenta). The small proportion of face-selective voxels that overlapped with LOC (nv = 11 ± 9; Fig. 6b, blue) displayed a similar profile of activation as LOC voxels in object epochs, but the response in control epochs was reduced. Face voxels that did not overlap with LOC (nv = 41 ± 12; Fig. 6b, green) displayed, as expected, a low signal in this experiment. Thus, the measured LOC profile is unlikely to be an average of distinct category-specific regions having highly different temporal response functions. We further examined whether training changed the extent of activated areas21. In LOC and DF, the numbers of object-selective
voxels increased slightly, but not significantly, with training (LOC, before training, 304 ± 71(s.d.), after, 329 ± 78; DF, before, 103 ± 32, after, 119 ± 32). In CoS, training decreased voxel number (before, 58 ± 35, after, 24 ± 17). Qualitatively, time courses from left and right hemispheres were similar, but we found slightly more objectselective voxels in right pFs and DF (pFs, 64 ± 21%, s.d., of all pFs voxels; DF, 64 ± 21%). Finally, to obtain an overall view of the relationship between brain activity and recognition, we plotted object-selective signal ratio versus recognition performance for individual subjects in each condition (before training, after training, novel) at the 40ms duration (Fig. 7). Higher recognition performance was associated with increased fMRI signal for each subject in the LOC (Fig. 7a and b). Note that this correlation was not a general phenomenon that occurred in all object-selective regions. In partic-
Fig. 3. Sensitivity of recognition and fMRI activation to object duration. To bring recognition and fMRI signal to a common scale, we calculated the ratio of activation and recognition compared to the maximum, obtained at an image presentation duration of 500 ms. x-axis, image duration on a logarithmic scale; error bars, s.e.m. Graphs indicate average of 13 subjects, except V1, for which there were 6 subjects. Solid black line, normalized recognition performance. LO, lateral occipital; pFs, posterior fusiform; CoS, collateral sulcus; DF, dorsal foci. V1, primary visual cortex. nature neuroscience • volume 3 no 8 • august 2000
839
articles
Fig. 4. Training effect: psychophysics. Training profile of the 11 subjects who participated in the training procedure (Methods). Each color denotes a different subject; points corresponds to the percent correct recognition for each subject on a given day. Scan 1, recognition on the first scan; scan 2-trained, recognition of the trained images on the second scan; scan 2-novel, recognition of a second set of untrained images from the same object categories, also shown for 40 ms. Subjects denoted by blue were trained on image set II (Methods).
ular, in the CoS (Fig. 7d), the correlation between recognition and fMRI signal was extremely weak.
DISCUSSION Cortical activity and recognition performance Our results suggest a clear correlation between subjects’ ability to correctly name objects and the selective cortical activation found in object-related areas, particularly the LOC. This correlation was shown in three ways. First, recognition performance was correlated with selective cortical activation when exposure duration Fig. 5. Training effect: brain activation. (a) Top, time course from subject RF before training, obtained from the pFs (left) and LO (right). Bottom, time course from subject RF after training. Numbers on top indicate the duration of image presentation. Shaded epochs contained images of objects plus mask. Unshaded epochs contained mask plus mask (Fig. 1). Dark gray, 500-ms objects; medium gray, 120-ms objects plus 380-ms mask; light gray, 40-ms objects plus 460ms mask; x-axis, time in seconds; y-axis, percent signal change from equi-luminance blank baseline; scale bar, 10 s; error bars, standard error between repetitions of the same condition. LO, lateral occipital; pFs, posterior fusiform. (b) Signal elicited by identical images viewed for 40 ms in scan 1 (before training) and scan 2 (after training) in different brain regions. x-axis, brain area; y-axis, object-selective signal ratio compared to the 120-ms epoch. For V1, we plotted the signal ratio compared to 120 ms (Methods). Dark bars, 40 ms before training; gray bars, identical images after training. Error bars, s.e.m. Asterisks (p < 0.001) and circles (p < 0.03), significantly stronger signal elicited after training, compared to the same image set before training by t-test. Abbreviations same as (a). (c) Average signal in scan 2 elicited by two sets of images (trained and novel) shown for 40 ms, in different brain regions. Axes and abbreviations, same as (b). White bars, 40-ms novel images, gray bars, trained images; error bars, s.e.m. Triangle (p < 0.01) and circle (p < 0.05), significantly stronger signal for trained images compared to novel images by t-test. 840
was changed. Thus, both recognition performance and activity in LOC were non-linear functions of image duration with a similar profile (Fig. 3). Second, this correlation was demonstrated more directly by showing that identical visual stimuli produced significantly higher cortical activation after training (Fig. 5b), which was highly correlated with improved recognition performance on the same stimuli. Third, LOC activation was stronger in response to trained than novel images, concomitant with enhanced recognition of the trained set (Fig. 5c). However, we did observe some variability across subjects in the extent of the differences between learned and novel images. Together, these results clearly show that LOC activation is highly correlated with recognition performance. This argues against the idea that cortical activation may be correlated with the effort exerted by subjects in their attempt to recognize objects. Such recognition effort should be reduced after training, yet subjects clearly showed increased activation levels. Although these results clearly point to a correlation between recognition performance and signal strength in object-responsive regions, we should emphasize that recognition is not the only factor that determines fMRI signal strength in these areas. One example is the fMRI-adaptation phenomenon, in which the amplitude of fMRI signal in the LOC is reduced by repeated presentation of the same object17,22. Perceptual priming in higher-order brain areas Our training procedure led to gradual stimulus-specific improvement (Fig. 4), even though subjects could not recognize most of the objects before training. Subjects did not seem to learn a general strategy that enabled them to ‘see’ images at 40 ms, as their recognition was about half as good for novel objects as for trained objects, although there was a small non-specific improvement as well. These results are consistent with a psychophysical study demonstrating that perceptual learning is specific to trained object shapes23. We further demonstrated that perceptual learning enhances the visually driven fMRI signal. Similar effects occur in rapid perceptual learning24 or learning new object categories25. However,
a
b
c
nature neuroscience • volume 3 no 8 • august 2000
articles
Fig. 6. Individual subjects time course data after training (scan 2). Left, raw time courses from individual subjects. Each color denotes a different subject. Right, subtraction of the raw activation in the 40-ms novel objects epoch from the raw 40-ms trained objects epoch for individual subjects. (a) LO, lateral occipital; pFs, posterior fusiform; V1, primary visual cortex. Numbers on the top indicate the duration of the image. (40n indicates novel object images presented for 40 ms.) In pFs and LO, 8 of 11 subjects showed an enhanced signal in the 40-ms trained objects epoch, when recognition was higher. In V1, there was no significant difference between the 40-ms objects epochs. (b) Comparison between LOC activation and face-selective voxels defined by an independent localizer scan (Methods) in 4 subjects. Magenta, all LOC voxels; red, LOC voxels excluding voxels that overlapped with face-selective voxels; blue, LOC voxels that overlapped with face voxels; green, face-selective voxels that did not overlap with LOC voxels. The face-selective region was small compared to LOC, and most of these voxels did not overlap with LOC voxels defined in this experiment.
a
several imaging studies show that in some cases perceptual priming is accompanied by a reduction in the fMRI signal26–29. The source of these differences is not clear at present. Implications of short integration times Brain activation in object areas was a highly non-linear function of exposure duration (Fig. 3). An approximately 4-fold change in image duration from 500 to 120 ms had a minimal effect on signal strength, whereas a 3-fold change from 120 to 40 ms had a dramatic effect. In contrast, V1 activation was less affected by shortening image exposure. This non-linearity probably indicates a threshold mechanism, that is, a minimal exposure time is required to trigger brain activation in higher visual areas. Our results indicate that this threshold is about 40 ms and that longer durations are sufficient to produce selective cortical activation and conscious recognition of complex objects. This extremely short integration time translates to a maximum neuronal discharge of ∼20 action potentials per image. Similar integration times were suggested based on single-neuron recordings in macaque monkeys2,5. Such short durations put severe constraints on models that assume relatively long-lasting reverberations or oscillations. Comparison between areas As we reported previously12,16 and confirmed here, several cortical areas other than LOC respond preferentially to complex, natural objects compared to scrambled objects and texture patterns. Here we compared the correlation of activity in each of these areas with recognition performance. Overall, LOC showed the highest correlation, both in the reduced activation amplitude at shorter stimulus durations, and in the changes associated with training. Within LOC, the putative subdivisions17 (LO and pFs) showed a fairly similar profile. Thus, if we take correlation with recognition level to indicate a role in object recognition, LOC is the best candidate. We should emphasize that this high correlation indicates that the LOC is involved in object recognition, but it does not prove by itself that this activity is either necessary or sufficient for object recognition. However, other evidence points to LOC as a pivotal
b
station in the object-recognition process. Damage to fusiform cortex and occipitotemporal junction causes various recognition deficits30–33, and electrical stimulation in these regions interferes with recognition34,35. Additional research is required to resolve several controversial issues that were not addressed here. Are distinct regions within occipitotemporal cortex specialized for specific recognition tasks? For example, are there dedicated regions for subordinate-level recognition36,37? Are there modules for recognition of specific categories such as faces38,39, houses39–41, tools42 or letters43? Do naming
a
b
c
d
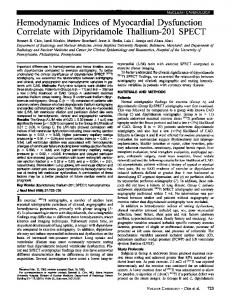
Fig. 7. Brain activation versus recognition. Object-selective signal ratio versus recognition ratio (Methods) across all subjects. Each data point represents one subject at a certain condition and performance level: 40 ms, before training; 40 ms, after training; 40 ms, novel. Each subject is denoted with a distinct color and symbol. Solid lines, regression lines of the scatter plots; R values and parameters of the regression line are given for each area. LO, lateral occipital; pFs, posterior fusiform; DF, dorsal foci; CoS, collateral sulcus. nature neuroscience • volume 3 no 8 • august 2000
841
articles
objects and visually identifying them recruit the same or different cortical substrates44,45? Is the preferential activation in ventral–anterior visual regions correlated with increased perceptual distinctness46,47 (M.Bar et al. Soc. Neurosci. Abstr. 25, 529, 1999)?
METHODS Subjects. Thirteen subjects (7 male, 6 female, ages 24–47) who gave written informed consent participated in the study. The Chaim Sheba Medical Center ethics committee approved the experimental protocol. Functional MRI. Subjects were scanned on a 1.9 T whole-body Prestige, Elscint scanner with a standard birdcage headcoil. Experiments included sagittal localizers, high resolution (0.8 × 1.5 × 4 mm) T1 weighted images, and functional imaging EPI pulse sequences (T2*-weighted, multi-slice, gradient echo sequence; TR = 2000, TE = 45, flip angle, 900) with field of view 38.4 × 19.2 cm2, matrix size 128 × 72, and in-plane resolution 3 × 2.7 mm. Slices were oriented perpendicular to the calcarine sulcus. The scanned area included 6–12 slices, 4 or 6 mm thick, that covered most of the occipital lobe, extending into parietal and temporal lobes. Visual stimulation was generated on an SGI workstation and back-projected via an Epson 5300 LCD projector onto a translucent screen located at the back of the scanner. The projecting system was synchronized at 50 Hz. We verified that the projector was presenting images accurately at the prescribed rate. Images were viewed through a tilted mirror, providing a maximal visual angle of 40o × 30o. The average luminance of the images was 80 candella/m2 with blanks of 20 candella/m2. Experimental protocol. The experiments consisted of two scanning sessions with training between scans. All subjects participated in the masking experiment (scan 1; details below), in which they viewed images presented briefly for 20, 40, 120 or 500 ms immediately followed by a mask. In this experiment, we measured both fMRI signal and recognition performance. After the first scan, eleven of these subjects participated in a training procedure that facilitated their recognition of specific images shown for 40 ms. They were rescanned after training in a similar masking experiment (scan 2). For all subjects, we also mapped the representation of visual meridians in the same scanning sessions. This mapping was used to define borders of retinotopic areas. Masking experiment (scan 1). Subject were presented with achromatic pictures of objects of various categories (people 27% of all object pictures, animals 34%, insects 6%, vehicles 12%, flowers 12%, manmade 9%) or scrambled images (Fig. 1). Pictures were presented centrally in random order, at a rate of 2 Hz and subtended a visual angle of 7.5o × 7.5o. Images were presented at 4 durations: 500 or 120 ms followed by a 380ms mask, 40 ms with 460-ms mask or 20 ms with 480-ms mask. Masks were created by randomly scrambling each image into 400 blocks. Visual stimulation was presented in blocks of 14 s that alternated with 10-s mean-luminance blanks. Each condition was repeated twice, in pseudorandom order, using different images. In total, subjects viewed 448 different images and 448 masks. Images were not repeated during the scan. Subjects were instructed to covertly name all images at the basic level (for example, flower, boat) while they were scanned, as it is suggested that different levels of categorization might produce different activations36. In addition, we measured recognition performance (percent correct naming) after the fMRI scan, while they were in the scanner. Six subjects were presented with images shown for only 3 durations: 40, 120 and 500 ms. Training procedure. After participating in the first scan, subjects were trained daily for 5–7 days. In each session, the same 60 images were shown 5 times for 40 ms in random order followed by randomly selected masks to prevent them from learning the association of a picture with a mask. The training setup replicated the scanner projection system; images were presented on a computer and back-projected on a translucent screen via an Epson 5300 projector. Images subtended the same viewing angle at a similar distance as inside the scanner. Subjects were instructed to name all images, and their recognition performance (percent correct naming) was measured. 842
Masking experiment after training (scan 2). The design was similar to that of the first masking experiment. Subjects were instructed to covertly name all images at the basic level while they were scanned, and we again measured the recognition performance of subjects while they were in the scanner, after the fMRI scan. Two different image sets were presented for 40 ms (set I and II): the set of images subjects were trained on, and a novel set of images, containing pictures from the same object categories. Eight subjects viewed image set I in the first scan and were subsequently trained on it, whereas three subjects viewed set II in the first scan and later were trained on set II. Mapping borders of visual areas. For all subjects, we mapped the representation of vertical and horizontal visual field meridians to delineate borders of retinotopic areas13–16. Visual stimulation was presented at a rate of 2 Hz in blocks of 16 s, and consisted of triangular wedges that compensated for the expanded foveal representation. The wedges were presented either vertically (upper or lower visual field) or horizontally (left or right). Half the wedges were gray-level natural images, and the other half were black-and-white, objects-from-texture pictures12. A small crosshair (0.2o) was presented centrally, and subjects were instructed to fixate on it. Four cycles of the stimuli (upper, lower, left or right) were shown, with blanks alternating between cycles. The flattened map was produced with the Brainvoyager software Package (R. Goebel, Brain Innovation, Masstricht, Netherlands). Eye and head movement. Eye movements were recorded in five subjects during the masking experiment task. Measurements were taken using video-based eye tracker (EyeLink, SR-Research, Toronto, Canada). The records were taken outside the magnet, but using identical visual stimuli and task as during the scan. Head movement was assessed from the fMRI scans, and did not exceed 6 mm during a six-minute experiment. Head motion was not observed within or between individual epochs. Data analysis. The first six image acquisitions were discarded. Images were pre-processed using principal component analysis12,48 to remove high-frequency noise and drift. Activation time courses were obtained by regressing the data to an ideal box-car time-course. Statistical maps were spatially smoothed with a 3 × 3-pixel Gaussian filter with a variance of 1 pixel; false positives were verified via a bootstrap method. Object-selective regions were defined for each individual subject as voxels that responded preferentially to objects compared to scrambled images and blanks, regardless of image duration at a highly significant (p < 0.0001) activation. These regions were separated in both masking experiments into four areas (LO, pFs, CoS, DF) based on their location relative to retinotopic areas, which were defined by visual meridians and anatomical criteria. From each area, we extracted the time course of activation during the experiment. The choice of images from a variety of object categories was specifically designed to optimally activate general object representations, rather than any highly selective, category-specific representations. We expected that voxels that are selectively activated by only one category, such as houses or faces, would show poor activation by these diverse stimuli. Furthermore, we separately analyzed the CoS, which is reported to be preferentially activated by houses39–41. In four subjects, we used an independent localizer scan within the same session to define the most faceselective voxels (faces > cars). We then used this region of interest to analyze the activation profile of face-selective voxels in the masking experiment (Fig. 6b). Using the meridian-mapping experiment, we delineated primary visual cortex voxels, including the V1/V2 border, in six subjects and analyzed them separately during the masking experiments. The percent change was calculated as the percent change from a blank baseline: Percent signal =
signal – mean [signal (blanks)] mean [signal (blanks)]
× 100
To remove non-selective components of the visual activation, including responses to the mask and activation due to transients associated with changing pictures, for each image duration, we subtracted the responses to control stimuli from those to object stimuli with the same timing paranature neuroscience • volume 3 no 8 • august 2000
articles
meters. The Object-selective activation was defined as the mean difference between the signals evoked by an object and by a scrambled epoch of the same exposure duration: Object-selective signal = mean [%signal (objectsXms) – %signal(scrambledXms)], where Xms indicates the image duration. To bring scans 1 and 2 into a common baseline, we calculated the ratio between the object-selective signal in each exposure duration and the 120-ms object-selective signal in each experiment (Figs. 5 and 7): mean[%signal(objectsXms) – %signal(scrambledXms)] object selective signal ratio = × 100 mean[%signal(objects120ms) – %signal(scrambled120ms)] For V1, which is not object selective, we calculated the signal ratio in object epochs compared to the 120-ms epoch as . mean [%signal (objects40ms)] mean [%signal (objects120ms)]
× 100
In Fig. 3 the normalization was relative to the 500ms epoch. All epochs belonging to the same condition were averaged together to provide an average condition epoch time course (for example, Figs. 5a and 6). Error bars indicate standard deviation at each time point between recurrences of the condition.
ACKNOWLEDGEMENTS This study was funded by ISF 131/97 and GIF I567 grants. We thank E. Okon and O. Smikt for technical help. We thank M. Harel for assistance with the brain-flattening procedure. We thank G. Avidan-Carmel, U. Zohari and N. Kanwisher for discussions and comments.
RECEIVED 24 MAY; ACCEPTED 20 JUNE 2000 1. Breitmeyer, B. G. Visual Masking: An Integrative Approach. (Oxford University Press, New York, 1984). 2. Kovacs, G., Vogels, R. & Orban, G. A. Cortical correlates of pattern backward masking. Proc. Natl. Acad. Sci. USA 92, 5587–5591 (1995). 3. Rolls, E. T. & Tovee, M. J. Processing speed in the cerebral cortex and the neurophysiology of visual masking. Proc. R. Soc. Lond. B Biol. Sci. 257, 9–15 (1994). 4. Tovee, M. J. Neuronal processing. How fast is the speed of thought? Curr. Biol. 4, 1125–1127 (1994). 5. Rolls, E. T., Tovee, M. J. & Panzeri, S. The neurophysiology of backward visual masking: information analysis. J. Cogn. Neurosci. 11, 300–311 (1999). 6. Bar, M. & Biederman, I. Localizing the cortical region mediating visual awareness of object identity. Proc. Natl. Acad. Sci. USA 96, 1790–1793 (1999). 7. Vanni, S., Revonsuo, A., Saarinen, J. & Hari, R. Visual awareness of objects correlates with activity of right occipital cortex. Neuroreport 8, 183–186 (1996). 8. Thorpe, S., Fize, D. & Marlot, C. Speed of processing in the human visual system Nature 381, 520–522 (1996). 9. Morris, J. S., Ohman, A. & Dolan, R. J. Conscious and unconscious emotional learning in the human amygdala. Nature 393, 467–470 (1998). 10. Whalen, P. J. et al. A. Masked presentations of emotional facial expressions modulate amygdala activity without explicit knowledge. J. Neurosci. 18, 411–418 (1998). 11. Malach, R. et al. Object-related activity revealed by functional magnetic resonance imaging in human occipital cortex. Proc. Natl. Acad. Sci. USA 92, 8135–8139 (1995). 12. Grill-Spector, K., Kushnir, T., Edelman, S., Itzchak, Y. & Malach, R. Cueinvariant activation in object-related areas of the human occipital lobe. Neuron 21, 191–202 (1998). 13. DeYoe, E. A., Bandettini, P., Neitz, J., Miller, D. & Winans, P. Functional magnetic resonance imaging (fMRI) of the human brain. J. Neurosci. Methods 54, 171–187 (1994). 14. Engel, S. A. et al. fMRI of human visual cortex. Nature 369, 525–525 (1994). 15. Sereno, M. I. et al. Borders of multiple visual areas in humans revealed by functional magnetic resonance imaging. Science 268, 889–893 (1995). 16. Grill-Spector, K. et al. A sequence of object processing stages revealed by fMRI in the human occipital lobe. Hum. Brain Mapp. 6, 316–328 (1998). 17. Grill-Spector, K. et al. Differential processing of objects under various viewing conditions in the human lateral occipital complex. Neuron 24, 187–203 (1999).
nature neuroscience • volume 3 no 8 • august 2000
18. Halgren, E. et al. Location of human face-selective cortex with respect to retinotopic areas. Hum. Brain Mapp. 7, 29–37 (1999). 19. DeYoe, E. A. et al. Mapping striate and extrastriate visual areas in human cerebral cortex. Proc. Natl. Acad. Sci. USA 93, 2382–2386 (1996). 20. Hadjikhani, N., Liu, A. K., Dale, A. M., Cavanagh, P. & Tootell, R. B. Retinotopy and color sensitivity in human visual cortical area V8. Nat. Neurosci. 1, 235–241 (1998). 21. Karni, A. et al. The acquisition of skilled motor performance: fast and slow experience-driven changes in primary motor cortex. Proc. Natl. Acad. Sci. USA 95, 861–868 (1998). 22. Buckner, R. L. & Koutstaal, W. Functional neuroimaging studies of encoding, priming, and explicit memory retrieval. Proc. Natl .Acad. Sci. USA 95, 891–898 (1998). 23. Furmanski, C. S. & Engel, S. A. Perceptual learning in object recognition: object specificity and size invariance. Vision Res. 40, 473–484 (2000). 24. Dolan, R. J. et al. How the brain learns to see objects and faces in an impoverished context. Nature 389, 596–599 (1997). 25. Gauthier, I., Tarr, M. J., Anderson, A. W., Skudlarski, P. & Gore, J. C. Activation of the middle fusiform ‘face area’ increases with expertise in recognizing novel objects. Nat. Neurosci. 2, 568–573 (1999). 26. Buckner, R. L. et al. Functional-anatomic correlates of object priming in humans revealed by rapid presentation event-related fMRI. Neuron 20, 285–296 (1998). 27. Schacter, D. L. & Buckner, R. L. Priming and the brain. Neuron 20, 185–195 (1998). 28. Jiang, Y., Haxby, J. V., Martin, A., Ungerleider, L. G. & Parasuraman, R. Complementary neural mechanisms for tracking items in human working memory. Science 287, 643–646 (2000). 29. Henson, R., Shallice, T. & Dolan, R. Neuroimaging evidence for dissociable forms of repetition priming. Science 287, 1269–1272 (2000). 30. Damasio, A. R., Tranel, D. & Damasio, H. Category-related recognition defects as a clue to the neural substrates of knowledge. Annu. Rev. Neurosci. 13, 89–109 (1990). 31. Damasio, A. R. Category-related recognition defects as a clue to the neural substrates of knowledge. Trends Neurosci. 13, 95–98 (1990). 32. Farah, M. J., Klein, K. L. & Levinson, K. L. Face perception and withincategory discrimination in prosopagnosia. Neuropsychologia. 33, 661–674 (1995). 33. Moscovitch, M., Winocur, G. & Behrmann, M. What is special about face recognition? Nineteen experiments on a person with visual object agnosia and dyslexia but normal face recognition. J. Cog. Neurosci. 9, 555–604 (1999). 34. Halgren, E., Wilson, C. L. & Stapleton, J. M. Human medial temporal-lobe stimulation disrupts both formation and retrieval of recent memories. Brain Cogn. 4, 287–295 (1985). 35. Puce, A., Allison, T. & McCarthy, G. Electrophysiological studies of human face perception. III: Effects of top-down processing on face-specific potentials. Cereb. Cortex 9, 445–458 (1999). 36. Gauthier, I., Anderson, A. W., Tarr, M. J., Skudlarski, P. & Gore, J. C. Levels of categorization in visual recognition studied using functional magnetic resonance imaging. Curr. Biol. 7, 645–651 (1997). 37. Gauthier, I., Skudlarski, P., Gore, J. C. & Anderson, A. W. Expertise for cars and birds recruits brain areas involved in face recognition Nat. Neurosci. 3, 191–197 (2000). 38. Kanwisher, N., McDermott, J. & Chun, M. M. The fusiform face area: a module in human extrastriate cortex specialized for face perception. J. Neurosci. 17, 4302–4311 (1997). 39. Ishai, A., Ungerleider, L. G., Martin, A., Schouten, J. L. & Haxby, J .V. Distributed representation of objects in the human ventral visual pathway. Proc. Natl. Acad. Sci. USA 96, 9379–9384 (1999). 40. Aguirre, G. K., Zarahn, E. & D’Esposito, M. An area within human ventral cortex sensitive to “building” stimuli: evidence and implications. Neuron 21, 373–383 (1998). 41. Epstein, R. & Kanwisher, N. A cortical representation of the local visual environment. Nature 392, 598–601 (1998). 42. Martin, A., Wiggs, C. L., Ungerleider, L. G. & Haxby, J. V. Neural correlates of category-specific knowledge. Nature 379, 649–652 (1996). 43. Allison, T., McCarthy, G., Nobre, A., Puce, A. & Belger, A. Human extrastriate visual cortex and the perception of faces, words, numbers, and colors. Cereb. Cortex 4, 544–554 (1994). 44. Chao, L .L., Haxby, J. V. & Martin, A. Attribute-based neural substrates in temporal cortex for processing and knowing objects. Nat. Neurosci. 2, 913–919 (1999). 45. Moore, C. & Price, C. J. Three distinct ventral occipitotemporal regions for reading and object naming. Neuroimage 10, 181–192 (1999). 46. Tong, F., Nakayama, K., Vaughan, J. T. & Kanwisher, N. G. Neural correlates of perceptual awareness during binocular rivalry between faces and houses. Neuron 21, 753–759 (1998). 47. Rosier, A. M. et al. Regional brain activity during shape recognition impaired by a scopolamine challenge to encoding. Eur. J. Neurosci. 11, 3701–3714 (1999). 48. Reyment, R. & Joreskog, K. Applied Factor Analysis in the Natural Sciences (Cambridge University Press, Cambridge, Massachusetts, 1993). 49. Talairach, J. & Tournoux, P. Co-Planar Stereotaxic Atlas of the Human Brain (Thieme, New York, 1988).
843