Journal of the International Neuropsychological Society (1998), 4, 547–558. Copyright © 1998 INS. Published by Cambridge University Press. Printed in the USA.
The ecological validity of tests of executive function
PAUL W. BURGESS,1 NICK ALDERMAN,2 JON EVANS,3,4 HAZEL EMSLIE,3,4 and BARBARA A. WILSON 3 1
Psychology Department, University College London Kemsley Brain Injury Rehabilitation Unit, St. Andrew’s Hospital, Northampton, U.K. 3 Medical Research Council Applied Psychology Unit, Cambridge, U.K. 4 Oliver Zangwill Centre for Neuropsychological Rehabilitation Trust, Ely, U.K. 2
(Received April 16, 1997; Revised December 30, 1997; Accepted March 13, 1998)
Abstract Ninety-two mixed etiology neurological patients and 216 control participants were assessed on a range of neuropsychological tests, including 10 neuropsychological measures of executive function derived from 6 different tests. People who knew the patients well (relatives or carers) completed a questionnaire about the patient’s dysexecutive problems in everyday life, and this paper reports the extent to which the tests predicted the patients’ everyday life problems. All of the tests were significantly predictive of at least some of the behavioral and cognitive deficits reported by patients’ carers. However, factor analysis of the patients’ dysexecutive symptoms suggested a fractionation of the dysexecutive syndrome, with neuropsychological tests loading differentially on 3 underlying cognitive factors (Inhibition, Intentionality, and Executive Memory), supporting the conclusions that different tests measure different cognitive processes, and that there may be limits to the fractionation of the executive system. (JINS, 1998, 4, 547–558.) Keywords: Executive functions, Test validity, Frontal lobe syndrome, Dysexecutive syndrome
WCST under strict examination conditions might be so different from most situations in the real world that there is little correspondence between the cognitive resources tapped in the examination condition, and those tapped in realworld ones (for further discussion on this point see Burgess, 1997; Shallice & Burgess, 1991b). There are a few studies that have examined this issue directly. For instance, Sivak et al. (1981) examined the relationship between Porteus maze task performance and driving ability; Naglieri and Das (1987) correlated performance on a visual search paradigm, trail making and a “matching numbers” task with academic achievement in children; Bayless et al. (1989) and Cicerone and De Luca (1990) have correlated tinkertoy (see Lezak, 1995) performance with employment status; and Pontius and Yudowitz (1980) looked at the relationship between trail making performance and selfreported criminal behavior. Additionally, there are executive tests that are inherently “ecologically valid” since they are little more than formalized versions of real-world activities [e.g., Boyd & Sautter’s (1993) route-finding task; Butler et al.’s (1989) wheelbarrow test, or Shallice & Burgess’s (1991a) Multiple Errands test; see also tests developed by Robertson et al., in press, and Schwartz et al., 1991]. However, there is a complicating issue as regards the use of tests as indicators of executive dysfunction in neurologi-
INTRODUCTION Probably the most common use of neuropsychological tests of executive function is where performance on them is viewed as representing the state of some brain process(es) that are presumed to be utilized in situations outside the strict test situation; after all, an isolated impairment in performing the Wisconsin Card Sorting Test (WCST; Milner, 1963), with no other problems in any other situation, would be of little clinical significance. Instead, failure on, for instance, the WCST is normally taken as suggesting that the cognitive processes involved in correct performance of that test (e.g., “set shifting”) are damaged, and the assumption is made that since coping with many real-life situations will also involve these processes, the individual is likely to experience difficulties in the real world to some degree comparable to the difficulties they experience in the test situation. It is perhaps surprising that the empirical validity of this assumption is rarely examined. It is perfectly plausible, for instance, that the circumstance of a person performing the
Reprint requests to: P.W. Burgess, Institute of Cognitive Neuroscience, Psychology Department, University College London, Gower Street, London WC1E 6BT, U.K. E-mail:
[email protected]
547
548 cal groups: Recent evidence suggests that the dysexecutive syndrome may be fractionable, at least as regards the features of cognitive dysfunction (e.g., Burgess, 1997; Burgess & Shallice, 1994, 1996c; Damasio, 1996; Duncan et al., 1995; Owen et al., 1995; Robbins, 1996; Robbins et al., 1995; Shallice & Burgess, 1991a; Stuss et al., 1995). This possibility raises important methodological issues: If the executive system consists of a number of processes or modules that may be variously impaired in any individual patient with impairment in each process–module having its own behavioral and cognitive sequelae, then it makes little sense to estimate the ecological utility of an executive task using a single criterion variable. Instead it would seem sensible to gain measures of behavior in a wide range of situations where dysexecutive patients have problems, and consider not only how performance on a given test relates to overall severity of deficit but also how it may relate to subgroups of symptoms. However, an analysis of this type requires simultaneous consideration of the overall sensitivity of a measure since if some behavioral symptoms are particularly good indicators, in a nonspecific way, of any neurological problem, and certain neuropsychological tests are particularly sensitive in an equally nonspecific way, spurious correlations may arise between symptom and test score that reflect little but, for instance, some general level of impairment. In other words the correlations may be a product of the sensitivity rather than specificity of the measures. Examination of the fractionation of the dysexecutive syndrome at the behavioral level and its neuropsychological correlates therefore requires exclusion of such artifacts by showing a pattern of relationships that would not be predicted by mere test sensitivity alone (Shallice, 1988, pp. 231–237). The present study takes such sensitivity into account, and compares the ecological validity of eleven measures of executive function taken from six different tests, and relates these findings to the set of behavioral characteristics known as the “dysexecutive syndrome.”
METHODS Research Participants A key aim of this paper is the study of the discriminant validity of tests of executive function. Therefore a general neurological population was studied, which might be expected to include cases with dysfunction in primarily nonexecutive (e.g., language, perception) cognitive systems. Accordingly 92 neurological patients of varying etiologies were seen as part of this study. All patients had an independent diagnosis of brain injury–dementia. Patients with mild head injury or any patient for whom a diagnosis of organic brain disease was uncertain were excluded. They were recruited from U.K. neurological centers in Cambridge, Northampton, Southampton, and Belfast. Fifty-nine percent had suffered head injuries, 13% were diagnosed as suffering from dementia (primarily dementia of the Alzheimer type or frontal lobe dementia), 8.5% had suffered cerebrovascular accidents, 6.5% had suffered a bout of encephalitis, and the
P.W. Burgess et al. remaining 13% consisted of a range of other conditions (e.g., anoxia and carbon monoxide poisoning, gunshot wound, Korsakoff syndrome). The mean age of the patient sample was 38.5 years (SD 5 15.1); the mean NART reading IQ (Nelson & Willison, 1991) was 103.2 (SD 5 13.0); and the mean WAIS–R FSIQ was 92.1 (SD 5 15.5). A total of 216 nonpatient control participants were studied. They were recruited primarily from a group of individuals who had participated in previous collections of population norms (a group with a wide range of age, years of education, and NART scores), with additional participants recruited from the staff at St. Andrew’s Hospital, Northampton, U.K., and from an organization in a large U.K. city that provided adults and young people with work experience. Control participants were paid at the rate of 4 Pounds Sterling per hr for their participation. The mean age of the control sample was 46.1 years (SD 5 19.8), which is significantly higher than the patient group (t 5 3.46, df 5 306, p 5 .001). However this is of little significance for the comparisons to follow, and is conservative for group differences. The mean NART reading IQ of the controls was 102.7 (SD 5 16.2), which is not significantly different from the patients (t52.28, df 5 306, p5.78).
Procedure Assessment of everyday signs of the dysexecutive syndrome The severity of the dysexecutive symptoms shown by the participants was investigated by means of a questionnaire. One version of the questionnaire was completed by someone who knew the patient or control well (usually either a relative or carer), and another version was designed to be completed by the participant themselves. This Dysexecutive Questionnaire (or DEX; Burgess et al., 1996b) aimed to cover 20 of the most commonly reported symptoms of the dysexecutive (or “frontal lobe”) syndrome, and forms a part of the Behavioural Assessment of the Dysexecutive Syndrome test battery (Wilson et al., 1996). Following Stuss and Benson (1984; 1986) the questions sampled four broad areas of likely changes: (1) emotional or personality, (2) motivational, (3) behavioral, and (4) cognitive. It is of course not assumed that these categories are discrete. The individual characteristics of the dysexecutive syndrome that the questions aimed to investigate are shown in Table 1, and are similar to those derived from interviews with the carers of frontal lobe patients outlined in Martzke et al. (1991). Participants were asked to rate on a Likert-type scale from zero (representing never) to 4 (representing very often) how often they observed each characteristic. So, for instance, the question representing “impulsivity” was: “S0he acts without thinking, doing the first thing that comes to mind.”
Neuropsychological measures In addition to the questionnaire, six measures of executive function were administered to the patients and controls in
Ecological validity of executive tests Table 1. Characteristics of the dysexecutive syndrome measured by the DEX Questionnaire (in question order) Number
Behavioral Characteristic
1. 2. *3. 4. 5. 6. 7. 8. 9. 10. 11. 12. 13. 14. 15. 16. 17. 18. 19. 20.
Abstract thinking problems Impulsivity Confabulation Planning problems Euphoria Temporal sequencing deficits Lack of insight and social awareness Apathy and lack of drive Disinhibition Variable motivation Shallowing of affective responses Aggression Lack of concern Perseveration Restlessness–hyperkinesis Inability to inhibit responses Knowing–doing dissociation Distractibility Poor decision-making ability No concern for social rules
*e.g., (S0he) sometimes talks about events of details that never actually happened, but s0he believes did happen.
their standard format. The tests were chosen to represent two (primarily) verbal tasks, two nonverbal ones, plus a task (SET) that has been demonstrated to dissociate from performance on the others at the single case level (e.g., Shallice & Burgess, 1991a). Beyond this level, the choice of verbal or nonverbal tasks was made on pragmatic grounds: They were among the most commonly used clinical tests of executive function in the U.K. at the time of experimental design (1993) and the administration of them could take no longer than 1 hr for practical reasons. These tests were as follows: 1. The Modified Wisconsin Card Sorting Test (MWCST; Nelson, 1976), from which the three measures of number of categories attained, total errors, and number of perseverative errors were derived. 2. The Cognitive Estimates Test (Shallice & Evans, 1978), where patients are asked 10 questions to which they are unlikely to know the answer (e.g., “What is the length of the average man’s spine?”) and are required to produce a reasonable estimate. The resulting error score represents the degree to which the participants gave answers falling outside the range of estimates given by controls. 3. The Verbal Fluency Test (e.g., Miller, 1984): In the oral version of this well-known test, participants are asked to produce as many words as they can that begin with a given letter. They are specifically told not to produce proper nouns. The letters F, A, and S were used, with
549 60 s allowed for each letter. The overall score is the sum of all permissible words produced. 4. Verbal Fluency for Animals (e.g., McKenna et al., 1994): In this test, participants were asked to tell the examiner the names of as many different types of animal as possible within a 60-s period. 5. Trail Making (Armitage, 1946): This test consists of two parts. Part A requires, after brief practice, the connection by pencil lines of 20 encircled numbers (1–20) positioned randomly on an A4-sized page. Part B requires the participant to alternate between numbers and letters (e.g., 1–A–2–B–3–C . . .). The scoring procedure introduced by Reitan (see Lezak, 1995, p. 381) was used, which involves recording the total time taken for the participant to complete each part (including any time during the task for the examiner to point out mistakes made by the participant and for the participant to correct those mistakes). 6. The Simplified Six Element Test (SET; Burgess et al., 1996a): This test is an easier version of the procedure outlined in Shallice and Burgess (1991a). The test consists of three tasks (simple arithmetic, written picture naming, dictation) each of which has two parts. The participant is required to attempt at least part of each of the six subtasks within 10 min, following the rule that they are unable to switch directly from a subtask of one type to the counterpart of that type. For instance, a participant would not be allowed to do the first section of the picture naming followed directly by the second section of the same task. They would have to attempt some items of a different type before returning. The score is calculated as the number of subtasks attempted (maximum 5 6) minus the number of occasions the participant broke the switching rule. In order to establish the discriminant validity of the executive tasks, a number of tests of background neuropsychological functioning were also given with the aim of covering the broad areas of premorbid general intellectual functioning (the NART; Nelson & Willison, 1991); current intellectual functioning (WAIS–R; Wechsler, 1981); memory [AMIPB Complex Figure recall; Coughlan & Hollows, 1985; Recognition Memory Test, Warrington, 1984; Rivermead Behavioural Memory Test; Wilson et al., 1985 (a standardized battery of memory tests sensitive to the sorts of memory problems that patients experience in everyday life)]; language (the Graded Naming Test; McKenna & Warrington, 1983) and visual perception (Cube Analysis and Position Discrimination subtests from the Visual Object and Space Perception Battery; Warrington & James, 1991).
Administration The tests were administered to the patients over a number of sessions (varying with ability), with the total testing time
550
P.W. Burgess et al.
for each patient approximately 2.25 hr, and for control participants, approximately 1 hr.
RESULTS Performance on Neuropsychological Measures of Executive Functioning As a group, the patient’s performance on all measures of executive function was poorer than that of the controls, with the surprising exception of the Cognitive Estimates test [FAS: t(154) 5 22.53, p 5 .012; Fluency for Animals: t(139) 5 22.82, p 5 .006; MWCST: Categories, t(148) 5 23.60, p 5 .0004; Errors, t(154) 5 2.30, p 5 2.023; Perseverative Errors, t(109) 5 3.13, p 5 .0022; Trails A, t(62) 5 4.58, p , .0001; Trails B, t(71) 5 4.23, p 5 .0001; Trails B–A, t(85) 5 4.23, p , .005; SET, t(115) 5 210.34, p , .0001; Cognitive Estimates, t(127) 5 2.98, p 5 .33]. It should be noted that under conditions of Bonferroni correction for multiple comparison, only the differences between patients and controls for the following variables are significant: MWCST Categories and Perseverative Errors; Trails (all three measures), and SET. The pattern of these results was essentially unchanged by correction for the small age difference between the control and patient groups using linear regression. However, the critical findings for the present study are the patterns of relations between performance on the tests and the behavioral observations.
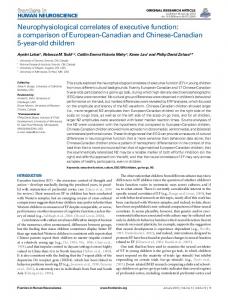
Behavioral Indicators of the Dysexecutive Syndrome An overall score on the DEX was calculated for each participant, representing the sum of ratings across the 20 questions (higher scores representing greater impairment), on the two versions: self-rating and others’ ratings. In addition, the discrepancy between the degree of executive failure admitted to by the participants and that observed by the independent raters was calculated as a measure of “insight.” Unsurprisingly, and as can be seen in Figure 1, the patient group’s scores on the self-rating, and those of others’ ratings of the patients were significantly higher than the control counterpart scores. However the more interesting pattern lies in the relations between the patients’ selfratings and those about the patient made by observers. Here the control group rated themselves as showing a significantly greater number, or severity, of dysexecutive signs in everyday life than did those that knew them well [t(331) 5 3.65, p , .001]. This contrasted sharply with the pattern occurring in the patients: They rated themselves as showing significantly fewer, or less severe, dysexecutive signs than were noted by their observers [t(160) 5 22.72, p , .01], thus suggesting some degree of lack of insight into their difficulties.
Fig. 1. Dysexecutive Questionnaire: Scores by group.
Correlations Between Overall Severity of Dysexecutive Disorder and the Neuropsychological Test Measures The scores for each of the 20 individual items were added together to create an overall measure of the severity of dysexecutive symptoms. Three overall DEX measures are considered here: the carer’s ratings (Other Score), the patients’ own ratings (Self Score), and the difference between the two (Other–Self Score). These measures were correlated with the neuropsychological test measure scores (see Table 2). Considering first the correlations between the Other’s Scores and the tests, all of the tests measuring executive and general intellectual functions, visual perception, and language abilities showed correlations significantly different from zero. However all except one of the memory tests (RMT faces) were not related to this overall measure. (In fact the RMT faces score is interesting in that it does not show the same relationship pattern with the three DEX measures as the other variables: It is the only one that correlates with the patients’ own self-ratings—see below.) Thus there is a general nonspecific concordance between overall level of dysexecutive problems in everyday life and impairment on many neuropsychological measures. Moreover, the strength of these relations was not trivial. For instance, for 7 of 10 executive measures the variance in the DEX score explained by the test score was higher than the variance explained by group classification: The tests tended to be better predictors of everyday problems in patients than they were at predicting whether a participant was a control or patient.
Ecological validity of executive tests
551
Table 2. Correlations between DEX total measures and neuropsychological test performances in the patient group (scores reflected where appropriate) Test Executive tests Cognitive Estimates (N 5 52) Fluency FAS (N 5 74) Animals (N 5 66) MWCST Categories (N 5 78) Total Errors Perservative Errors Six Element Test (N 5 79) Trail Making (N 5 51) A B B–A General cognitive functions NART (N 5 80) WAIS–R FSIQ (N 5 77) Memory Complex Figure Recall Immediate Delayed RBMT (N 5 69) RMT (N 5 52) Words Faces Story Recall (N 5 73) Immediate Delayed Language Graded Naming Test (n 5 73) Visual perception Cube Analysis (N 5 70) Position Discrimination (n 5 70)
DEX Other Score
DEX Self Score
DEX Other–Self
.29 n.s.
.18 n.s.
.10 n.s.
.35** .29* .37*** .40*** .36** .40***
.00 n.s. .00 n.s. .02 n.s. .05 n.s. .01 n.s. .02 n.s.
.35** .27* .32** .31 .35** .37**
.37** .35* .26 n.s.
.04 n.s. .11 n.s. .20 n.s.
.34 .38** .37**
.24* .42***
.04 n.s. .14 n.s.
.19 n.s. .27
.09 n.s. .14 n.s. .06 n.s.
.07 n.s. .02 n.s. .07 n.s.
.18 n.s. .17 n.s. .01 n.s.
.23 n.s. .50***
.03 n.s. .32*
.25 n.s. .24 n.s.
.12 n.s. .04 n.s.
.08 n.s. .09 n.s.
.07 n.s. .03 n.s.
.27
.18 n.s.
.13 n.s.
.30* .36**
.10 n.s. .13 n.s.
.36** .25*
*p , .05, **p , .01, ***p , .001.
Considering second the Self Score test correlations, quite a different pattern is evident. With the exception of RMT faces, none of the neuropsychological test measures were significantly correlated with the patients’ own ratings of their dysexecutive problems. Last, we consider the relationship between the neuropsychological tests and the difference between the Other Score and Self Score, which is proposed as a crude measure of insight. As might be expected given the previous pattern of correlations, the Other–Self Scores were generally significantly correlated with the executive test scores. They were not, however, related to memory test scores, nor to measures of current general intellectual efficiency, or confrontation naming (GNT). Performance on the two tests of visuoperceptual ability were also correlated significantly with the Other–Self Score discrepancy.
Relation Between Individual Dysexecutive Symptoms The general notion of a dysexecutive “syndrome,” at least at the level of observed everyday behavior, was supported by the questionnaire results. Of the 190 possible correlations between the 20 individual variables, 74% of them were significant at p , .01 (2-tailed). However, this general trend masked a more subtle grouping of variables. Varimax rotated factor analysis of the independent raters’ scores of the patients, (using simultaneous criteria for factor solution as being a minimum of 60% of total variance explained, with all factors passing the latent root criterion; see Hair et al., 1992, pp. 236–237) revealed a five-factor structure. These five factors explained a total of 67.2% of the variance (factors individually: 21.3, 15.5, 11.6, 10.6,
552
P.W. Burgess et al.
8.2%). Table 3 shows this solution, together with the factor loadings. It is clear that the first factor relates to the varying manifestations of disinhibition, or the inability to inhibit a prepotent response (disinhibition and response suppression abilities are argued to be manifestations of the same underlying cognitive deficit; see Burgess & Wood, 1990). The second factor relates to the dysexecutive patients’ inability to formulate appropriate goal-oriented plans and follow these complex behavioral sequences to a satisfactory conclusion. It is interesting to note that lack of insight loaded highly on this factor. The third factor primarily represents the memory disturbances associated with the dysexecutive syndrome; the relationship with “perseveration” will be discussed later. The fourth and fifth factors seem to relate, respectively, to the positive and negative emotional and personality changes that can occur in the dysexecutive syndrome. Given that the dysexecutive syndrome appears fractionable at the behavioral level, the question arises as to whether the neuropsychological test measures show differential patterns of relations with the individual behavioral factors. Factor scores for the patients were derived for each of the five factors described above (see Table 3) and the correlations between these factor scores and the patients’ perfor-
mance on the executive tests were examined. An important issue here is the discriminant validity (Campbell, 1960) of the executive function tests. In other words it is not enough to just demonstrate relations between the DEX questionnaire factor scores and the executive tests: Additionally, one should ideally demonstrate that tests that are considered not to have a strong executive component should be unrelated to the factor scores. If this can be shown to be the case, it seems likely that the executive tests are measuring something that tests of general intelligence, memory, language, and perception are not. Accordingly Tables 4, 5, and 6 show those correlations that were significantly different from zero for the executive tasks but all correlations for the others. These relationships are just shown for Factors 1, 2, and 3: None of the executive or background measures were significantly correlated with the scores for Factors 4 and 5 (Positive and Negative Emotional Changes), except for a modest correlation between Graded Naming Test scores and Factor 5 scores (2.28, N 5 80, p 5 .02). Considering in turn the factor score–test correlations, for Factor 1 (Inhibition), all of the executive tasks except the MWCST showed significant relationships with Factor 1
Table 4. Correlations (Pearson) between neuropsychological test measures and factor scores for Factor 1 (Inhibition) 1 Table 3. Five factors of the dysexecutive syndrome as indicated by the Dysexecutive Questionnaire Behavioral characteristic Factor 1: Inhibition Response suppression problems Impulsivity No concern for others’ feelings No concern for social rules Disinhibition Impaired abstract reasoning Restlessness Factor 2: Intentionality Planning problems Poor decision-making Lack of insight Distractibility Knowing–doing dissociation Factor 3: Executive Memory Confabulation Temporal sequencing problems Perseveration Factor 4: Positive Affect Variable motivation Aggression Euphoria Factor 5: Negative Affect Shallow affect Apathy *Only factor loadings .5 or greater are included.
Factor loading* .83 .77 .77 .75 .63 .55 .50 .78 .78 .59 .58 .52 .78 .73 .70 .72 .66 .60 .86 .62
Test Executive Cognitive Estimates Fluency–Animals Fluency–FAS Six Element Test Trails A Trails B Trails B–A General intellect NART WAIS–R FSIQ Memory Complex Figure Recall Immediate Delayed RBMT Profile Score Recognition Memory Test Faces Recognition Memory Test Words Story Recall Immediate Delayed Language Graded Naming Test Visuospatial and perception Cube Analysis Position Discrimination
N
r
p
52 66 74 79 51 51 51
.34 .27 .35 .24 .48 .43 .30
.015 .03 .002 .04 ,.001 .002 .04
80 77
.23 .43
.04 ,.001
.03 .03 .06 .49 .03
n.s. n.s. n.s. ,.001 n.s.
.05 .08
n.s. n.s.
73
.34
.003
70 70
.21 .38
n.s. .001
42
69 51 52 73
1 Only correlations significantly different from zero are shown for executive tests. For clarity, scores are reflected where appropriate to make correlations positive.
Ecological validity of executive tests
553
Table 5. Correlations (Pearson) between neuropsychological tests and factor scores for Factor 2 (Intentionality) 1
Table 6. Correlations (Pearson) between neuropsychological tests and factor scores for Factor 3 (Executive Memory) 1
Test
Test
Executive Six Element Test General intellect NART WAIS–R FSIQ Memory Complex Figure Recall Immediate Delayed RBMT Profile Score Recognition Memory Test Words Faces Story Recall Immediate Delayed Language Graded Naming Test Visuospatial perception Cube Analysis Position Discrimination
N
r
p
79
.46
,.001
80 77
.06 .14
n.s. n.s.
.09 .14 .06
n.s. n.s. n.s.
.23 .13
n.s. n.s.
.04 .00
n.s. n.s.
72
.04
n.s.
70 69
.26 .01
.03 n.s.
42
69 51 50 73
1 Only correlations significantly different from zero are shown for executive tests. For clarity, scores are reflected where appropriate to make correlations positive.
scores. However a range of other tests showed relations of similar or greater strengths (e.g., WAIS–R FSIQ, RMT faces; see Table 4). Thus it would seem that the cognitive substrates underlying Factor 1 are either measured by a wide range of tasks that need not necessarily be “executive” ones, or that these substrates are executive ones that are fundamental to performance in many situations. The relations with Factor 2 (Intentionality) are more straightforwardly interpretable. Here the only executive task to correlate significantly with the factor scores was the Six Element Test (r 5 .46, N 5 79; 95% confidence intervals 5 .72, .27). None of the other neuropsychological measures showed a significant relation except for a modest correlation with Cube Analysis of .26 (95% confidence intervals 5.47, .04; see Table 5). For Factor 3 (Executive Memory) the pattern was quite different. Here the only executive tests that showed significant relationships with the factor scores were the MWCST and Verbal Fluency measures. In addition there were modest significant correlations with measures of general intellectual functioning (NART, WAIS–R FSIQ) and confrontation naming. Critically, however, for factor interpretation, there were a number of significant relations with the memory test scores (where few or none were significant for Factors 1 and 2; see Table 6).
Executive Fluency–Animals Fluency–FAS MWCST Categories Total Errors Perservative Errors General intellect NART WAIS–R FSIQ Memory Complex Figure Recall Immediate Delayed RBMT Profile Score Recognition Memory Test Words Faces Story Recall Immediate Delayed Language Graded Naming Test Visuospatial perception Cube Analysis Position Discrimination
N
r
67 83 84
.40 .30
.001 .008
.54 .49 .37
,.001 ,.001 .001
.28 .24
.01 .04
.29 .35 .41
n.s. .025 ,.001
.54 .20
,.001 n.s.
.26 .25
.025 .034
72
.27
.02
70 69
.03 .21
n.s. n.s.
80 75
p
42
68 51 50 72
1 Scores reflected where appropriate. Only significant relationships are shown for the executive measures.
Test Sensitivity It is perhaps possible, however, that the pattern of factor score–test measure relations might be a complex artifact of test sensitivity. One might perhaps suspect such a pattern if there was a very close correspondence between the rank order of test sensitivity and the rank order of the individual variance explained by each factor as might happen, for instance, if some behavioral characteristics are particularly good indicators of any dysexecutive problem. A simple investigation of the plausibility of this account can be performed by considering how well the executive measures distinguished between patients and controls in this study. Perhaps the simplest level of analysis might be to consider the proportion of patients who fall below the 5% level of the controls, a common clinical cut-off indicator. An analysis of this type however showed that it is unlikely that the pattern of relations can be explained merely as a test sensitivity artifact. Thirty-three point seven percent of patients were at or below the 5th percentile level of the controls on the SET, making it the second most sensi-
554 tive test (Trails B stood at 38.9%, with Trails A at 32.1%, and B–A at 25.9%), and yet SET performance was only modestly correlated with Factor 1 scores (.24), and was more highly related to Factor 2 scores (.46), which explained a smaller proportion of the variance in the factor solution. For MWCST Perseverative Errors (the most sensitive of the MWCST measures here), 28.6% of the patients were at or below the 5th percentile of the controls, making it the fourth most sensitive measure, and yet this measure was only significantly correlated with Factor 3. Furthermore, some tests appeared to share the involvement of two factors. Thus FAS fluency was related to Factor 1 and 3, with SET significantly related to 1 and 2. As an aside, it should perhaps be mentioned that for FAS and Animal Fluency, only a small proportion of the patients fell at or below the 5% control level (10.8% and 8.2% respectively), and for Cognitive Estimates proportionally fewer patients than controls fell at the 5% control level (3.6%). These results would argue against use of these particular tests as screening measures for general neurological dysfunction.
DISCUSSION The first finding of this study was that dysexecutive symptoms are very commonly observed among neurological patients; the syndrome is not a rare occurrence. Moreover, although controls generally rate themselves as having more dysexecutive problems in everyday life than do their friends and relatives, this is not true for neurological patients as a group. Secondly, the assumption that poor performance on neuropsychological executive test measures is reflected in impairments in everyday life received general support: Performance on the executive test measures consistently showed significant correlations with observers’ ratings of the patients’ dysexecutive problems in everyday life. Moreover, in general the executive tasks were better predictors of lack of insight than tests of premorbid intellectual functions, IQ, memory, or language. However these general correlations overlie a much more subtle and instructive set of relationships. The third finding of this study was that the 20 signs of the dysexecutive syndrome measured here could be grouped into five orthogonal factors. Thus it would seem that in the same way as there is growing evidence for the fractionation of executive cognitive functions (see, e.g., Burgess, 1997; Burgess & Shallice, 1994, 1996a, 1996c; Duncan et al., 1995; Goldstein et al., 1993), the syndrome may fractionate also at the behavioral level. But before examining these factors in detail, it is appropriate to first consider the sensitivity of the executive tasks.
Executive Task Sensitivity It was necessary to examine the overall sensitivity of the tests to any kind of neurological dysfunction in order to determine whether the results of any relations between the ques-
P.W. Burgess et al. tionnaire and the psychometric measures could be merely due to the differing sensitivities of the tests. Some of the results were perhaps surprising. The Cognitive Estimates and Verbal Fluency tasks in particular were remarkably insensitive to general neurological pathology. The use of either of these tests as general screening devices is not supported by these data (see O’Carroll et al., 1994 for further discussion of the psychometric properties of the Cognitive Estimates test). However, this does not suggest that the tests are insensitive to all types of neurological disorder—there may be certain groups (for instance, with certain location or type of lesion) who may fail the tests quite consistently. By contrast, some of the tests examined here were markedly sensitive to neurological disorder. The Trail Making, SET, and to a lesser extent, the modified MWCST tests were particularly noteworthy in this regard, and all the tests were significant predictors of at least one of the factors to be described below. The pattern of relationships between the tests and the symptom factor scores did not follow that of test sensitivity. For instance, the MWCST was found to be a more sensitive test (to nonspecific presence of neurological pathology) than either the fluency tasks or Cognitive Estimates. Yet MWCST did not load on Factor 1, where the others did. Similarly, the SET proved to be the second most sensitive test measure of all those under consideration, yet it was less highly related to Factor 1 than several of the less sensitive measures, and was more highly predictive of Factor 2 scores than Factor 1 scores, even though Factor 1 explained a greater degree of variance in the factor solution overall. It is clear that the relations between the executive test performances and the different components of the dysexecutive syndrome reveal a much more informative pattern than can be accounted for by test sensitivity alone. But what are these behavioral components?
Components of the Dysexecutive Syndrome In addition to consideration of the individual dysexecutive symptoms that loaded most highly on each factor, interpretation of the factors is helped by consideration of the relations not only with the executive test scores, but also with those tests less specifically “executive.”
Factor 1: Inhibition The first factor extracted from factor analysis of the DEX questionnaire included all those questions that related to the ability to suppress a habitual response, given that one accepts that impulsivity and disinhibition might be the behavioral consequences of such a problem at the cognitive level (see Burgess & Wood, 1990). Interpretation of this factor is not, however, straightforward. For instance, in addition to the Inhibition symptoms, the Abstract Reasoning variable also loaded on this factor. One explanation might be that given that the question item itself is “S0he has problems understanding what other people mean unless they keep things simple and straightforward” and the raters may have
Ecological validity of executive tests interpreted the question as relating more to language (e.g., comprehension) deficits than executive ones. On this account, one might expect higher correlations between this item and the Graded Naming Test than between it and the executive measures that load on Factor 1. However, this was not the case (Abstract Reasoning rating with tests as follows: GNT 2.38; Fluency Animals 2.41; Trails A .50; Trails B .54; Trails A–B .43). Thus it seems unlikely that the Abstract Reasoning item reflects wholly nonexecutive deficits. An alternative explanation might be that the raters may have interpreted the question as relating to the first factor of most psychometric factor analyses—more general “fluid intelligence.” An interpretation of this kind is supported by the correlation of Factor 1 with performance on the WAIS–R (see Table 4) and perhaps also with the weak but significant correlation with the NART. However this factor cannot be merely characterized as an overall measure of deficit, since if this were the case one might expect the strength of relations with this factor to be reflected in the sensitivities of the executive tasks to neurological disorder. As Tables 3 and 4 show, this was not the case: A relatively insensitive measure (FAS fluency) was somewhat more strongly related to Factor 1 than a very sensitive one (SET). Moreover, Factor 1 should perhaps have been related to performance on the RBMT and the other memory measures, which are quite sensitive to many forms of neurological problems (Wilson et al., 1989); this was not the case. A more plausible account is therefore that Factor 1 represents a primary form of executive function and the relationship with WAIS FSIQ is due to the disruption in performance on such measures caused by problems in response inhibition (see Burgess & Shallice, 1996a, 1996c for supporting evidence). Challenging a simple version of this view, however, are the significant correlations between the Factor 1 scores and Recognition Memory Test for faces (RMT faces), the Graded Naming Test, and Position Discrimination. One might speculate that performance on the RMT faces and Position Discrimination tests might be disrupted by an impulsive answering style (or disinhibition) but this seems prima facie a poor account of the relation with the Graded Naming Test. This relation is more plausibly related to the WAIS finding. Overall it is perhaps premature to present a strong interpretation of this factor. However, it does seem likely that Factor 1 represents some primary executive function that is highly related to performance on a wide range of (mostly nonmemory) neuropsychological tests and is well measured by many executive ones. This cognition process (or set of processes) is also inextricably bound up with concepts of “general intelligence,” and the behavioral manifestations of deficits in these processes are seen most often as poor control of social behavior.
Factor 2: Intentionality Interpretation of the second factor, Intentionality, is more straightforward. This factor included those items that related to the creation and maintenance of goal-related behav-
555 ior. Interestingly, Insight was also loaded on this factor. One interpretation of this finding is that awareness of one’s own executive deficits requires some degree of foresight: In other words, that insight requires foresight (or at least that the two functions share a cognitive resource). If this is the case, it is hardly surprising that the patient group underrated their own deficits: The same cognitive skill they require to be able to accurately assess their own difficulties is also at the root of their other dysexecutive problems. In contrast to the Inhibition factor, where all but one of the executive tests correlated with the factor scores, for the Intentionality factor, only two of the neuropsychological tests appeared related to it. The first, very modest relationship, was with Cube Analysis, usually regarded as a test of visuospatial perception although it is perfectly plausible that the task may have some executive component (see below). By far the strongest relation, however, was with the SET, which supports previous interpretations of the test as tapping processes involved in the creation, maintenance and activation of intentions (Burgess, 1997; Burgess & Shallice, 1997; Goldstein et al., 1993; Shallice & Burgess, 1991a, 1991b). Shallice & Burgess (1991a) have shown that patients with preserved WAIS performances may be impaired on this test, supporting the finding of no necessary relationship between Intentionality and WAIS–R performance in this study. It would appear that at least some conventional IQ tests do not tap many aspects of the cognitive and everyday problems shown by dysexecutive patients (see Burgess, 1997; Duncan et al., 1995, for further discussion of the relationship between IQ and executive function). In addition, these findings perhaps support a distinction between prospective and retrospective remembering, in that the SET has a strong prospective memory component (see Burgess & Shallice, 1997) but this factor showed no significant relation with memory test scores.
Factor 3: Executive Memory The third factor, Executive Memory, was derived largely from those items in the questionnaire that related to confabulation and inability to recall the correct order of events. Interestingly, where the raters observed these characteristics in their patients, they also tended to notice perseveration: The individual correlations between the items, though not high, were all statistically significant (perseveration correlated with confabulation at .23, p , .01; temporal sequencing deficits, .38, p , .001; and confabulation and temporal sequencing correlated at .38, p , .001). It is therefore striking to find that of all the executive tests given to this group, the strongest relationship with this factor was found with the modified MWCST: Traditionally of course, the MWCST has been considered a measure of perseverative tendencies (e.g., Milner, 1963; Nelson, 1976). However recent reports have emphasized sensitivity of the MWCST to any kind of neurological pathology (e.g., Anderson et al., 1991; Corcoran & Upton, 1993; Crockett et al., 1986; Robinson, 1980). Moreover recent studies have suggested that perseverative
556 tendencies might not necessarily be the primary reason for dysexecutive patients’ failure on set attainment tasks (e.g., Burgess & Shallice, 1996a). One might reconcile these views by suggesting that perseveration may be an indicator of overall severity of cognitive dysfunction, but the results here argue against such a view: Although the MWCST was found to be moderately sensitive to any kind of neurological pathology, it did not load on either of Factors 1 and 2, but quite specifically on Factor 3, suggesting that while there may be a general component to the modified MWCST, the test also measures something more specific. On the evidence here, this additional component would seem to be related to the role of executive functions in memory: Not only does Factor 3 contain two questions about memory functions (including confabulation), but performances on five of seven of the memory tests were also significantly correlated with the scores for this factor. Thus Kimberg and Farah’s (1993) interpretation of the demands of the MWCST based on computer modeling of the task receives some support [although it is not clear how the loosening of associations in working memory—Kimberg and Farah’s (1993) interpretation of MWCST failure—might relate to confabulation; see Burgess & Shallice, 1996b]. A difficulty for this account however is that many patients who confabulate do not also show perseveration on the MWCST, or in everyday settings (see, e.g., patients reported by Dalla Barba et al., 1990, and Delbecq-Derouesne et al., 1990). One possible explanation for these apparently conflicting data might be that it is only the converse that is true—that markedly perseverative patients tend to be those that confabulate. On this account, it may be that the present findings reflect a oneway relation between confabulation and perseveration of this kind (see Burgess & Shallice, 1996b, for further discussion on this point). Factors 4 and 5 related to the emotional and personality changes that can be seen in dysexecutive patients. There are two points of note here. The first is that performance on none of the neuropsychological tests was apparently related to the degree that patients showed these characteristics [except for a modest relation between confrontation naming performance and Factor 5 (negative affect), which may reflect previous connections made between negative symptoms and poverty of speech in schizophrenia (e.g.,Andreasen, 1982)]. If this is correct, the lesson for the practicing clinician might be that patients may show emotional and personality changes that may not be reflected in executive test performance—thus supporting the use of some form of interview (structured, questionnaire, etc.) in general patient examination. The second point about Factors 4 and 5 (positive and negative affective problems, respectively) is that in this analysis they appear to be orthogonal. These findings would seem to suggest, for instance, the fascinating possibility of a patient showing euphoria and apathy together (although not necessarily simultaneously, of course). Clearly this area would benefit from further research. In summary, at the very broadest of levels, the findings of this study support three conclusions. The first is that per-
P.W. Burgess et al. formance on neuropsychological tests of executive function do correlate with dysexecutive symptoms seen in everyday life. In the main, these correlations were higher than those found with tests of memory, reading, and naming, although on the evidence here, dysexecutive symptoms are also manifest in performance on a range of neuropsychological tests whose primary aim is not to measure executive functions. This is consistent, however, with a view of the executive system as providing “control” functions for a wide range of more informationally encapsulated resources (see Burgess, 1997). The second finding is that, although dysexecutive symptoms do broadly seem to appear together (at least in mixed etiology neurological groups with widespread damage), the dysexecutive syndrome can be fractionated at the behavioral level into five factors. The first three of these were well measured by executive tasks, whereas the relations with the motivation and personality aspects of the syndrome were much weaker. Moreover, different executive tests appear to measure different aspects of the syndrome. A third finding was that the executive tasks showed rather better general relationships with the patients’ lack of insight into their problems than did most of the other tests under consideration. If the findings of this study are correct, some straightforward practical implications for neuropsychological assessment follow: If different executive tasks measure different aspects of the dysexecutive syndrome, it makes sense to administer, standardly, a variety of tests rather than relying on just one or two. Moreover the choice of tests can be made on theoretical grounds. It would seem prudent to select a range of tests aimed to cover each of three cognitive factors: inhibition or response suppression, intentionality, and executive memory. In addition, it would appear some clinical interview, questionnaire, or other measure of affective changes is necessary, since these aspects appear not well measured by a number of the currently popular neuropsychological tests of executive function.
ACKNOWLEDGMENTS This work was supported by grants from the East Anglian Regional Health Authority Locally Organised Research Scheme (BW) and the Wellcome Trust (Grant Number 049241020960Z0WRE0 HA0JAT to P.W.B.). We are very grateful to Dennis Chiapello (Phoenix), Susie Chase (Pittsburgh), Hazel Dusoir and Paul Richardson (Belfast) for providing patient data for this study, and to Sheila McCree for providing access to controls. John Hodges kindly referred many of his patients to us. We would like to thank Emma Veitch for help with the preparation of this manuscript, and three anonymous reviewers for their insightful comments on an earlier version of this paper.
REFERENCES Anderson, S.W., Damasio, H., Jones, R.D., & Tranel, D. (1991). Wisconsin Card Sorting Test performance as a measure of frontal lobe damage. Journal of Clinical and Experimental Neuropsychology, 13, 909–922.
Ecological validity of executive tests Andreasen, N.C. (1982). Negative symptoms in schizophrenia: Definition and reliability. Archives of General Psychiatry, 39, 784– 788. Armitage, S.G. (1946). An analysis of certain psychological tests used for the evaluation of brain injury. Psychology Monographs, 60 (whole no. 277). Bayless, J., Varney, N.R., & Roberts, R. (1989). Tinker Toy Test performance and vocational outcome in patients with closed head injuries. Journal of Clinical and Experimental Neuropsychology, 11, 913–917. Boyd, T.M. & Sautter, S.W. (1993). Route-finding: A measure of everyday executive functioning in the head-injured adult. Applied Cognitive Psychology, 7, 171–181. Burgess, P.W. (1997). Theory and methodology in executive function and research. In P. Rabbitt (Ed.), Methodology of frontal and executive function (pp. 81–116). Hove, U.K.: Psychology Press. Burgess, P.W., Alderman, N., Evans, J.J., Wilson, B.A., Emslie, H. & Shallice, T. (1996a). Modified Six Element Test. In B.A. Wilson, N. Alderman, P.W. Burgess, H. Emslie, & J.J. Evans (Eds.), Behavioural assessment of the dysexecutive syndrome. Bury St. Edmunds, U.K.: Thames Valley Test Company. Burgess, P.W., Alderman, N., Wilson, B.A., Evans, J.J., & Emslie, H. (1996b). The Dysexecutive Questionnaire. In B.A. Wilson, N. Alderman, P.W. Burgess, H. Emslie, & J.J. Evans (Eds.), Behavioural assessment of the dysexecutive syndrome. Bury St. Edmunds, U.K.: Thames Valley Test Company. Burgess, P.W. & Shallice, T. (1994). Fractionnement du syndrome frontal [Fractionation of the frontal syndrome]. Revue de Neuropsychologie, 4, 345–370. Burgess, P.W. & Shallice, T. (1996a). Bizarre responses, rule detection and frontal lobe lesions. Cortex, 32, 241–259. Burgess, P.W. & Shallice, T. (1996b). Confabulation and the control of recollection. Memory, 4, 359–411. Burgess, P.W. & Shallice, T. (1996c). Response suppression, initiation and strategy use following frontal lobe lesions. Neuropsychologia, 34, 263–273. Burgess, P.W. & Shallice, T. (1997). The relationship between prospective and retrospective memory: Neuropsychological evidence. In M.A. Conway (Ed.), Cognitive models of memory. (pp. 247–272). Hove, U.K.: Psychology Press. Burgess, P.W. & Wood, R.Ll. (1990). Neuropsychology of behaviour disorders following brain injury. In R.Ll. Wood (Ed.), Neurobehavioural sequelae of traumatic brain injury (pp. 110– 133). London: Taylor & Francis. Butler, O.T., Anderson, L., Furst, C.J., & Namerow, N.S. (1989). Behavioral assessment in neuropsychological rehabilitation: A method for measuring vocational related skills. Clinical Neuropsychologist, 3, 235–243. Campbell, D.T. (1960). Recommendations for the APA test standards regarding construct, trait and discriminant validity. American Psychologist, 15, 546–553. Cicerone, K.D. & DeLuca, J. (1990). Neuropsychological predictors of head injury rehabilitation outcome. Journal of Clinical and Experimental Neuropsychology, 12, 92 [Abstract]. Corcoran, R. & Upton, D. (1993). A role for the hippocampus in card sorting. Cortex, 29, 293–304. Coughlan, A.K. & Hollows, S.K. (1985). The Adult Memory and Information Processing Battery (AMIPB). St James’s University Hospital, Leeds, U.K.: A.K. Coughlan. Crockett, D., Bilsker, D., Hurwitz, T., & Kozak, J. (1986). Clinical utility of three measures of frontal lobe dysfunction in neuro-
557 psychiatric samples. International Journal of Neuroscience, 30, 241–248. Dalla Barba, G., Cipolotti, L., & Denes, G. (1990). Autobiographical memory loss and confabulation in Korsakoff’s syndrome: A case report. Cortex, 26, 1–10. Damasio, A.R. (1996). The somatic marker hypothesis and the possible functions of the prefrontal cortex. Philosophical Transactions of the Royal Society of London B, 351, 1413–1420. Delbecq-Derouesne, J., Beauvois, M.F., & Shallice, T. (1990). Preserved recall versus impaired recognition: A case study. Brain, 113, 1045–1074. Duncan, J., Burgess, P.W., & Emslie, H. (1995). Fluid Intelligence after frontal lobe lesions. Neuropsychologia, 33, 261–268. Goldstein, L.H., Bernard, S., Fenwick, P., Burgess, P.W., & McNeil, J.E. (1993). Unilateral frontal lobectomy can produce strategy application disorder. Journal of Neurology, Neurosurgery and Psychiatry, 56, 274–276. Hair, J.F., Anderson, R.E., Tatham, R.L., & Black, W.C. (1992). Multivariate Data Analysis. New York: Macmillan. Kimberg, D.Y. & Farah, M.J. (1993). A unified account of cognitive impairments following frontal lobe damage: The role of working memory in complex, organized behaviour. Journal of Experimental Psychology: General, 122, 411–428. Lezak, M.D. (1995). Neuropsychological assessment (3rd ed.). New York: Oxford University Press. McKenna, P.J., Mortimer, A.M., & Hodges, J.R. (1994). Semantic memory and schizophrenia. In A.S. David & J.C. Cutting (Eds.), The neuropsychology of schizophrenia (pp. 163–178). Hove, U.K.: Erlbaum. McKenna, P. & Warrington, E.K. (1983). The Graded Naming Test. Windsor, U.K.: NFER-Nelson. Martzke, J.S., Swan, C.S., & Varney, N.R. (1991). Post-traumatic anosmia and orbital frontal damage: Neuropsychological and neuropsychiatric correlates. Neuropsychology, 5, 213–225. Miller, E. (1984). Verbal fluency as a function of a measure of verbal intelligence and in relation to different types of pathology. British Journal of Clinical Psychology, 23, 53–57. Milner, B. (1963). Effects of different brain lesions on card sorting. Archives of Neurology, 9, 90–100. Naglieri, J.A. & Das, J.P. (1987). Construct and criterion-related validity of planning, simultaneous, and successive cognitive processing tasks. Journal of Psychoeducational Assessment, 4, 353– 363. Nelson, H.E. (1976). A modified card sorting test sensitive to frontal lobe damage. Cortex, 12, 313–324. Nelson, H.E. & Willison, J.R. (1991). National Adult Reading Test (NART). Windsor, U.K.: NFER-Nelson. O’Carroll, R., Egan, V., & MacKenzie, D.M. (1994). Assessing cognitive estimation. British Journal of Clinical Psychology, 33, 193–197. Owen, A.M., Sahakian, B.J., Hodges, J.R., Summers, B.A., Polkey, C.E., & Robbins, T.W. (1995). Dopamine-dependent frontostriatal planning deficits in early Parkinson’s disease. Neuropsychology, 9, 126–140. Pontius, A.A. & Yudowitz, B.S. (1980). Frontal lobe system dysfunction in some criminal actions as shown in the narratives test. Journal of Nervous and Mental Disease, 168, 111–117. Robbins, T. (1996). Dissociating executive functions of the prefrontal cortex. Philosophical Transactions of the Royal Society of London B, 351, 1463–1473. Robbins, T.W., Shallice, T., Burgess, P.W., James, M., Rogers, R.D., Warburton, E., & Wise, R.S.J. (1995). Selective impairments
558 in self-ordered working memory in a patient with a unilateral striatal lesion. Neurocase, 1, 217–230. Robertson, I.H., Ward, T., Ridgeway, V., & Nimmo-Smith, I. (in press). The structure of normal human attention: The test of everyday attention. Journal of the International Neuropsychological Society. Robinson, A.L., Heaton, R.K., Lehman, R.A.W., & Stilson, D.W. (1980). The utility of the Wisconsin Card Sorting Test in detecting and localizing frontal lobe lesions. Journal of Consulting and Clinical Psychology, 48, 605–614. Shallice, T. (1988). From neuropsychology to mental structure. New York: Cambridge University Press. Shallice, T. & Burgess, P.W. (1991a). Deficits in strategy application following frontal lobe damage in man. Brain, 114, 727– 741. Shallice, T. & Burgess, P.W. (1991b). Higher order cognitive impairments and frontal lobe lesions in man. In H.S. Levin, H.M. Eisenburg, & A.L. Benton (Eds.), Frontal lobe function and dysfunction (pp. 125–138). New York: Oxford University Press. Shallice, T. & Evans, M.E. (1978). The involvement of the frontal lobes in cognitive estimation. Cortex, 14, 294–303. Sivak, M., Olson, P.L., Kewman, D.G., Won, H., & Henson, D.L. (1981). Driving and perceptual0cognitive skills: Behavioral consequences of brain damage. Archives of Physical and Medical Rehabilitation, 62, 476–483. Stuss, D.T. & Benson, D.F. (1984). Neuropsychological studies of the frontal lobes. Psychological Bulletin, 95, 3–28.
P.W. Burgess et al. Stuss, D.T. & Benson, D.F. (1986). The frontal lobes. New York: Raven Press. Stuss, D.T., Shallice, T., Alexander, M.P., & Picton, T.W. (1995). A multidisciplinary approach to executive functions. Annals of the New York Academy of Sciences, 769, 191–211. Schwartz, M.F., Reed, E.S., Montgomery, M., Palmer, C., & Mayer, N.H. (1991). The quantitative description of action disorganization after brain damage: A case study. Cognitive Neuropsychology, 8, 381–414. Warrington, E.K. (1984). Recognition Memory Test. Windsor, U.K.: NFER-Nelson. Warrington, E.K. & James, M. (1991). Visual Object and Space Perception Battery. Bury St. Edmunds, U.K.: Thames Valley Test Company. Wechsler, D. (1981). The Wechsler Adult Intelligence Scale– Revised. New York: The Psychological Corporation. Wilson, B.A., Alderman, N., Burgess, P.W. Emslie, H., & Evans, J.J. (1996). Behavioural Assessment of the Dysexecutive Syndrome (BADS). Bury St. Edmunds, U.K.: Thames Valley Test Company. Wilson, B.A., Cockburn, J., & Baddeley, A.D. (1985). The Rivermead Behavioural Memory Test. Bury St. Edmunds, U.K.: Thames Valley Test Company. Wilson, B.A., Cockburn, J.M., Baddeley, A.D., & Hiorns, R. (1989). The development and validation of a test battery for detecting and maintaining everyday memory problems. Journal of Clinical and Experimental Neuropsychology, 11, 855–870.