231
J. PRIŠENK et al.: The economic viability of value-based food chain, Mljekarstvo 66 (3), 231-238 (2016)
UDK: 637.1
Preliminary communication – Prethodno priopćenje
The economic viability of value-based food chain for dairy farms in mountain regions: an econometric analysis approach
doi: 10.15567/mljekarstvo.2016.0308
Jernej Prišenk1*, Andreja Borec1, Marjan Janžekovič1, Ivo Grgić2, Karmen Pažek1, Črtomir Rozman1 and Jernej Turk1 University of Maribor, Faculty of Agriculture and Life Sciences, Pivola 10, 2311 Hoče, Slovenia 2 University of Zagreb, Faculty of Agriculture, Department of Agricultural Economics and Rural Development, Svetošimunska 25, 10000 Zagreb, Croatia 1
Received - Prispjelo: 10.12.2015. Accepted - Prihvaćeno: 16.05.2016. Abstract The attention of this paper is drawn to analyze the economic potential of involvement of farmers into the small-medium sized value-based food chain (VBFC). The survey represents a solid data basis from which econometric modelling approach was further developed. Empirical results reveal the positive economic viability on a general level; this means more stable purchase price of raw milk for dairy farms, which are the part of value-based food chain. Results point at inelastic demand for milk and milk related products. Furthermore, there are some accompanying and underlying indirect social benefits, such as production of high-quality food products, more stable and constant demand for raw milk, steady payments and better social situation. The last one is especially important for the farms operating in less-favored mountain areas where the survey was actually conducted. Key words: mountain dairy farms, demand for milk, Value-based food chain, econometric modelling
Introduction The milk sector has been the subject of intense discussions during the preparation of new Common Agricultural Policy (CAP) reform 2014-2020 (European Commission, 2015). The end of milk quotes in EU countries commencing from 1st April 2015 exposed the issue of milk price stability. What will actually happen with the milk price in next years is difficult to predict, as is the big unknown, what will be the consequences for the dairy industry. The potential milk price instability could be the problem especially for small farmers, often located on mountain regions, working as “one man band” or being the part of short food supply chains (Prišenk, 2015). We assumed the price for raw milk would decrease; such it has happened recently - after the 6 months of the abolishment of milk quotas. The
average milk price in Slovenia was before the last reform between 0,31 €-0,33 €/L, at the end of year 2015, the price ranges between 0,24-0,28 €/L. The existence and preservation of dairy farms in the mountain areas are important not only from an economic point of view, but also in terms of saving the agricultural land, reducing unemployment, diminishing emigration of young people from rural areas (demographic changes) and maintaining the tradition of promoting entrepreneurship in the local area. From these aspects, the support of small farmers and local producers is crucial from both social and economic development processes for mountain rural areas, as well as saving the local food chains and deriving income from agricultural activity. Milk production is the most important agricultural sector in Slovenia, which created 31 % of the total
*Corresponding author/Dopisni autor: Tel: +386 2 613 08 34; E-mail:
[email protected]
232
J. PRIŠENK et al.: The economic viability of value-based food chain, Mljekarstvo 66 (3), 231-238 (2016)
income standard. In the EU-27 this share was almost half of them (16 %), but nevertheless milk production still represents the most important agricultural economic sector also in EU-27 (Stele and Žavcer, 2014). One of rural located food chain can be Value-based food chain (VBFC) (characteristics presented by Stevenson et al., 2011; Vacas et al., 2014 and Stevenson and Pirog, 2008). VBFC is not necessarily short food supply chain (according to Kneafsey et al., 2013), but added values of food chain could be often expressed as the support of small farmers with the aim to improve their economic situations (according to Pirog and Bregendahl, 2012). VBFCs evenly spread the output values to all partners (actors) in the chain, and consumers often recognize the food products as: high quality food products produced under environmentally friendly production systems, with a positive direct and indirect returns to the local economy (Pearson et al., 2011; Stevenson et al., 2011; Witzke et al., 2009; Viitaharju et al., 2005). Due to a lack of relevant research studies, except the one about dairy products market implementation by Pažek et al. (2014), we assessed the economic potential of value-based food chains on dairy farms from mountain regions. Using the pilot case study, we selected a value-based food chain called “Planika” (Planika Dairy in Slovenia plays a major role in organizational chain structure, named as “key” actor in the chain - further “Planika VBFC”). Selected case of VBFC fully satisfied to all characteristics of VBFC definition described by Stevenson in Pirog (2008), Pirog in Bregendahl (2012) and Stevenson et al. (2011). Further one point of definition explained, “In the chain is one strategic partner who contributes a large share to the well-organized and functioning of the chain” in our case it is Planika dairy. Selected pilot study includes components of economic added values (economic stability and independence), although it represents a medium size food supply chain. By buying milk from local producers (approx. 150 small dairy farms with, on average, 10-15 dairy cows) Planika has been successfully integrated into the local rural area (established in 1995), with many years of relevant series of qualitative and quantitative data. Farmers are mostly located in North-Western part of Slovenia (Idrija, Tolmin and Kobarid mountain areas).
The major objective of this research is to analyse how involvement in VBFC can improve the economic situation of dairy farms in mountain regions. The results give empirical outcomes about the positive/negative consequences which farmers can receive by their engagement in VBFC. The analysis has been focused on disclosing the economic returns yielded by the econometric modelling approach. The obtained empirical results indicate i) the relevance of maintaining milk production in Slovenian mountain regions and ii) the importance of preserving the value-based food chain from the aspect of mountain dairy farms economic privileges. Further, some recommendations for small local producers are given in discussion and conclusion sections of this paper mainly on the topic as how to stay the competitive in milk production after abolishment the milk quotas. Results of econometric models have been used to calculate price elasticities of demand: 1. milk purchase from dairy farms with respect to changes in dairy products prices in the Planika Dairy, and 2. milk purchase from producers in relation to the changes in average market dairy products prices on the Slovenian market.
Materials and methods Data collection The combination of account service data and public survey data was used, as such approach, provide high degree of credibility for the empirical results gained (Pöldaru et al., 2005; Henningsen, 2014). Empirical data sets have been obtained from the Planika Dairy, Agricultural Institute of Slovenia (AIS) and Statistical portal of Slovenia (SI-STAT). We compiled a time series of 60 monthly data within a range of 5 years - between 2009 and 2013, amounting to total 3600 pieces of statistical information. Input data have been split into two groups. First group includes data from Planika Dairy and second group includes data from AIS and SI-STAT. The first data group has been named “Planika dairy’ data” and the second one “Slovenian average data” (Prišenk, 2015). Consequently, the models have their genuine names (PLANIKA models and SLO models).
J. PRIŠENK et al.: The economic viability of value-based food chain, Mljekarstvo 66 (3), 231-238 (2016)
233
Specifying the models
Testing the models
Two groups of different econometric models have been specified in analyzing demand price elasticities. The first one [1] includes variables of monthly selling quantities of different milk products, while the second one [2] includes additional variables of average selling prices of milk products. To distinguish between the data obtained from the Planika dairy and Slovenian average input data sets, the first one received the following format (x11, x22, x33, etc.), while variables of Slovenian input data retain the same form (x1, x2, x3, etc.).
Econometric results have been evaluated given economic, statistical and econometric criteria. Econometric and statistical tests can be gleaned from the Table 1, which is structured into two parts (statistical evaluation tests and econometric evaluation tests).
The models have been tested by considering four different formulations: I) linear (LIN), II) logarithmic (LOG), III) linear-logarithmic (LINLOG) and IV) logarithmic-linear (LOG-LIN). Depending upon the input data (“Planika dairy’ data” and “Slovenian average data”), altogether 16 different models were developed and tested.
After testing models with statistical evaluation tests, autocorrelation, heteroscedasticity and multicollinearity appeared to exist in the models. To solve the problems regarding the perfect multicollinearity, the x8 independent variable has been excluded. For reducing the multicollinearity, the increasing of sample size to make the estimates sufficiently accurate. If these are not feasible (in our case the time series data are limited with the survey period between 2009 and 2013), the other options exist that may be helpful. These are removing the highly correlated predictors from the models for reducing the
Y = c + αx2 + βx4 + γx6 + δx8 + ut
[1]
Y = c + αx1 + βx2 + γx3 + δx4 + εx5 + ϑx6 + ρx7 + σx8 + ut
[2]
Where: y - average monthly quantity of milk purchased from producers by Planika dairy or other dairies in Slovenia, c - constant, x1 - monthly selling quantities of milk, x2 - average monthly selling price of milk, x3 - monthly selling quantities of cream, x4 - average monthly selling price of cream, x5 - monthly selling quantities of butter, x6 - average monthly selling price of butter, x7 - monthly selling quantities of fresh curd, x8 - average monthly selling price of fresh curd and ut - random residual.
Table 1. Statistical and econometric test for identifying econometric models weaknesses Purpose of the test
Name of the test
Acronym
Optimal values
Part 1 - Statistical evaluation tests Statistical significance
The explanatory power of econometric regression models
Standard error
Std. Error - S.E. of regression coefficient
Low values of S.E. - inversely proportional with t- test values
Gossett t - test
T-test
~2
Standard error of regression
S.E. of regression
Low values of S.E. - inversely proportional with t- test values
Multiple determination coefficient
R-Squared (R2)
Near 1
Adjusted multiple determination coefficient
Adjusted R-Squared (R2adj)
Near 1
Part 2 - Econometric evaluation tests Autocorrelation
Durbin-Watson test
DW test
1,8-2,2
Heteroscedasticity
Gossett t - test
T-test
~2
Multicollinearity
Regression between two variables
/
0-0,5
234
J. PRIŠENK et al.: The economic viability of value-based food chain, Mljekarstvo 66 (3), 231-238 (2016)
Yt= c + αx2 + βx4 + γx6 + δY(t-1) + ut
[3]
Yt= c + αx1 + βx2 + γx3 + δx4 + εx5 + ϑx6 + ρx7 + σY(t-1) + ut
[4]
Where: Y(-1) - time lag of dependent variable for one year, ut - disturbance (error) term. multicollinearity or also the use of PLS (partial least squares regression) as a method that cut number of predictors to a smaller set of uncorrelated components (Baguley, 2012). However, the DW test and Gossett-t test also showed the existence of autocorrelation and heteroscedasticity in the models. Therefore, it is necessary to specify a new type of model. We decided to specify the model with a time lag by one period [3] and [4].
Results and discussion We choose the elasticity calculation demand approach to reach our study aim. At the end one of the estimation process some model(s) is/are chosen as the best predictor(s) (LIN PLANIKA “first”, LIN-LOG PLANIKA “second” model, LOG SLO “first” and LIN-LOG SLO “second” model). However, because that all models show the similar results of estimating tests (no heteroscedasticity, no multicollinearity and no autocorrelations) we calculated the average demand elasticities values of all four forms (grouped into “Planika models” and “SLO models”). Average elasticity values do not deviate a lot from the elasticity values calculated from the best-estimated models.
Results of PLANIKA models The features of PLANIKA “first” models and PLANIKA “second” models are presented in appendices 1 and 2, respectively. For all types of models, the elasticities have been calculated to analyse the milk purchase from dairy farms depending on the market price of dairy products and their realization. From the results obtained (appendix 1) it can be seen that we had excluded x44 (average monthly selling price of cream) because of the poor P-value and due to presence of multicollinearity, the variable x88 (average monthly selling price of fresh curd) has also been excluded from PLANIKA “first” model. The equations of PLANIKA “first” and “second” models are presented in Table 2. In the case of PLANIKA “second” model, we excluded x33 and x44 variables because of poor P-values, and x77 and x88 variables to avoid perfect multicollinearity (appendix 2). Results of SLO models The results of the SLO “first” and “second” models are presented in Table 3, while their statistical and econometric features are given in appendices 3 and 4, respectively. To avoid perfect multicollinearity, the variable x8 (average monthly selling price of fresh curd) has been omitted from the model.
Table 2. The formulation of PLANIKA “first” and “second” models PLANIKA »first« models LIN
y11 = 1018916.42 - 462932.52 * x22 - 258412.06 * x66 + 0.74 * y11(-1)
LOG
log(y11) = 3.58 - 0.47 * log(x22) - 0.61 * log(x66) + 0.75 * log(y11(-1))
LIN-LOG
y11 = - 6418366.29 - 172529.53 * log(x22) - 380140.51 * log(x66) + 543490.26 * log(y11(-1))
LOG-LIN
log(y11) = 14.26 - 0.97 * x22- 0.42 * x66 + 1.02e – 06 * y11(-1) PLANIKA »second« models
LIN
y11 = 1206682.25 + 2.45 * x11 - 691464.92 * x22 - 8.18 * x55 - 473411.76 * x66 + 0.67 * y11(-1)
LOG
log(y11) = - 2.24 + 0.64 * log(x11) - 0.81 * log(x22) - 0.09 * log(x55) 1.13 * log(x66) + 0.68 * log(y11(-1))
LIN-LOG
y11 = -10569788.89 + 487300.67 * log(x11) - 416177.15 * log(x22) - 95399.32 * log(x55) 723835.95 * log(x66) + 484427.93 * log(y11(-1))
LOG-LIN
log(y11) = 14.55 + 3.25e – 06 * x11 - 1.30 * x22 - 7.42e-06 * x55 - 0.74 * x66 + 9.32e-07 * y11(-1)
J. PRIŠENK et al.: The economic viability of value-based food chain, Mljekarstvo 66 (3), 231-238 (2016)
Discussion of elasticity results and differences between the purchase prices of milk
235
which would imply inelastic demand. The negative inelastic demand (-0,61 %) can be also expected for the purchase of milk when the monthly selling price of butter produced by Planika dairy will increase by 1-percent.
Considering all relevant statistical and econometric tests (appendices) and at the same time solving the issues of autocorrelation, heteroscedasticity and perfect multicollinearity, computation of demand elasticities can be ultimately carried out. Elasticity for variables x22 and x66 (Table 4) have been calculated with the methodology presented by Turk et al. (2013) and Stern (2004). Results explain that the increase of the selling price of drinking milk produced by Planika Dairy for 1 %, means the losses of buying milk for -0,49 % from dairy farms,
On the basis of elasticity values derived, the lower consumer demand (the consequence of the increasing the monthly selling prices of dairy products) has obviously negative impacts on the milk purchase from dairy farms. Therefore, we included variables that express the realization (selling quantities) of Planika’ dairy products, such as milk and butter (PLANIKA “second” models).
Table 3. The formulation of SLO “first” and “second” models SLO »first« models LIN
y1 = 45745.48 - 30660.50 * x2 - 3429.44 * x4 - 1433.42 * x6 + 0.52 * y1(-1)
LOG
log(y1) = 5.21 - 0.57 * log(x2) - 0.38 * log(x4) - 0.19 * log(x6) + 0.52 * log(y1(-1))
LIN-LOG
y1 = - 119552.14 - 16518.93 * log(x2) - 10809.61 * log(x4) - 5196.41 * log(x6) + 15260.62 * log(y1(-1))
LOG-LIN
log(y1) = 10.87 - 1.06 * x2 - 0.12 * x4 - 0.05 * x6 + 1.79e-05 * y1(-1) SLO »second« models
LIN
y1 = 46864.34 - 0.002 * x1- 34806.47 * x2 + 0.04 * x3 - 1814.64 * x4 - 0.005 * x5 2009.66 * x6 + 0.48 * y1(-1)
LOG
log(y1) = 5.38 - 0.02 * log(x1) - 0.70 * log(x2) + 0.03 * log(x3) - 0.25 * log(x4) 0.03 * log(x5) - 0.25 * log(x6) + 0.51 * log(y1(-1))
LIN-LOG
y1 = -116696.82 - 411.29 * log(x1) - 20132.99 * log(x2) + 1027.34 * log(x3) - 7175.84 * log(x4) 747.41 * log(x5) - 6863.11 * log(x6) +14936.72 * log(y1(-1))
LOG-LIN
log(y1) = 10.92 - 5.62e-08 * x1 - 1.21 * x2 + 1.28e-06 * x3 - 0.064 * x4 - 1.56e-07 * x5 0.07 * x6 + 1.63e-05 * y1(-1)
Table 4. The average elasticity values of both PLANIKA models Type of the model
Variables
Elasticity average values
PLANIKA »first«
X22
-0,49
X66
-0,61
X22
-0,72
X66
-1,13
PLANIKA »second«
Table 5. The average elasticity values of both SLO models Type of the model SLO »first«
SLO “second«
Variables
Elasticity average values
X2
-0,57
X4
-0,37
X6
-0,14
X2
-0,66
X4
-0,22
X6
-0,25
236
J. PRIŠENK et al.: The economic viability of value-based food chain, Mljekarstvo 66 (3), 231-238 (2016)
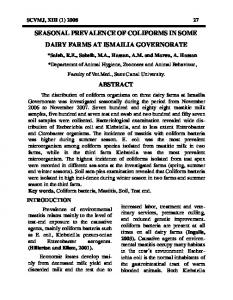
Calculated elasticities are higher in PLANIKA “second” models compared to PLANIKA “first” models. In the case of an increase of the monthly selling price of milk for 1 %, a decline in demand for 0.72 % can be expected. Conversely, elastic trend happened in the case of monthly selling price of butter (-1.13 %). Elasticity values of the SLO “first” models show similar results as PLANIKA “first” models, namely, inelastic demand for milk in the case of increasing the selling prices of dairy products. Farmers can expect the decline in demand for milk purchase by 0.57 %. A demand decrease can also be expected in monthly selling price of cream (0.37 %) and butter (0.14 %), which can be gleaned from Table 5. Our assumption is that the lower consumer demand (in SLO “second models”), which is consequence of the increasing the monthly selling prices of dairy products, has negative impacts on the milk purchase from dairy farms. The important finding is that demand for milk is also influenced by consumer purchasing power (higher elasticities for x2 and x6 variables in comparison to SLO “first” models). Results of econometric models suggest that by increasing the average monthly selling price of drinking milk for 1 %, a smaller drop in demand for the purchase of milk by Planika dairy can be envisaged. Slightly higher decline in demand for milk (for approx. 0.08 %) would suffer the farms which are not part of VBFC. Conversely would happen in the case of increasing the average monthly selling prices for butter, where the results shown better economic situation for farms, which are not part of Planika value-based food chain. The “second” econometric models have shown approximately the same drop in demand for milk irrespective if the farms are part of the VBFC or not. Figure 1. Purchase prices graphical movements of milk (2013-2015) in Slovenia (€/100 kg)
Between 2009 and 2010, the average purchase price of milk from Planika dairy increased approximately for 4 to 5 cents per liter, while during the time period 2011-2013 an increase by 2 to 3 cents per liter can be observed. Nowadays, half a year after the milk quota reform, the situation is quite different. The supply of raw milk has risen rapidly (in the EU 27 for 5.7 %) and this has brought about relative instability in prices; the last statistical data (28.52 € per 100 kg milk) is from October 2015 (AAMRD, 2015). Figure 1 present the comparison between the price of raw milk from 2013, 2014 and 2015, respectively on Slovenian milk market. The most recent data from Planika dairy (October 2015) show higher purchase price for raw milk for approx. 3 cents per liter (0,28€/L-0,31€/L).
Conclusion Planika dairy plays an increasingly important role and has positive economic potential for the farms operating in mountain regions, and for further demographical development of these regions in general. Dairy products from Planika are recognized as high-quality food products from local milk producers. Both hypotheses in introductory part were addressed here. First, the gained empirical results from econometric models confirm the economic viability of maintaining milk production in Slovenian mountain regions, especially if they are a part of local food system, or a part of local food chain (VBFC). Second, pilot case study of VBFC has been indicated as an important actor for preserving the farming in mountain regions especially from the standpoint of economic returns and logistical aspects. Farmers included in this research would definitely benefit from being the part of VBFC, since they lack competitiveness with their counterparts in low land areas, but on the other hand more effectively exploit their high quality production systems (the components of organic production, high quality food products and consumer’s perceptions). Many researchers estimate the importance of local food to be much broader than mere consumer perception. Local food has also a significant environmental and socio-economic role and is closely linked to broader rural development issues, such as sustaining local
J. PRIŠENK et al.: The economic viability of value-based food chain, Mljekarstvo 66 (3), 231-238 (2016)
businesses, retaining money in the local economy, the presence of successors on farms, and maintaining or preserving agricultural land in mountain areas (Prišenk et al., 2014; Rozman et al., 2012). Higher purchase prices of milk and dairy products from mountain areas could be perceived as a coherent way of expressing higher quality mountain product values. For any future in-depth analysis, the inclusion the production costs of milk in mountain and lowland areas would be necessary. This would entail a special methodological (econometric) challenge, because it is expected that production costs in mountain areas are higher (i.e., higher costs of manual work) compared to lowland areas. The aim of further study should be to choose one (best) method, based on its suitability for the nature of data or based on relevant literature/previous research such as developing translog-profit function, Probit and Tobit econometric models. However, the feed rations will be cheaper because of higher percentage of pasture in summer feed rations. Higher irreversible financial supports and payment entitlements for the farms from mountain regions, which are mostly engaged in organic production and complying with other environmental measures, would also have to be accounted for.
Ekonomske koristi prehrambenih lanaca temeljenih na vrijednosti za mliječne farme u planinskim područjima: ekonometrijska analiza
mlijekom, što u konačnici poljoprivrednicima donosi stabilan prihod i bolju socijalnu situaciju. Posljednje je posebno važno za poljoprivredna gospodarstva u područjima s težim uvjetima gospodarenja gdje je istraživanje i provedeno. Ključne riječi: mliječne farme u planinskom području, potražnja za mlijekom, prehrambeni lanci temeljeni na vrijednosti, ekonometrijsko modeliranje
References 1.
AAMRD (Agency for agricultural markets and rural development) (2015): Market report, October 2015, Milk. Available online: http://www.arsktrp.gov.si/si/storitve_ ukrepi/trzni_ukrepi/trzno_informacijski_sistem_trzna_ porocila/mleko_in_mlecni_izdelki/ (30.11.2015).
2.
Baguley T. (2012): Serious stats: A guide to advanced statistics for the behavioral sciences. Basingstoke: Palgrave.
3.
European Commission (2015): Conference “The EU dairy sector: developing beyond 2015” (Brussels, 24 September 2013). Available online: http://ec.europa. eu/agriculture/events/dairy-conference-2013_en.htm (11.11.2015.).
4.
Henningsen, A. (2014). Introduction to Econometric Production Analysis with R (Draft Version). Department of Food and Resource Economics, University of Copenhagen. Available online: http://files.itslearning.com/data/ku/103018/teaching/lecturenotes.pdf (29.10.2014.).
5.
Kneafsey, M., Venn, L., Schmutz, U., Balázs, B., Trenchard, L., Eyden-Wood, T., Bos, E., Sutton, G., Blackett, M. (2013): JRC Scientific and Policy Reports - Short Food Supply Chains and Local Food Systems in the EU. A State of Play of their Socio-Economic Characteristics. Publications Office of the European Union, Luxembourg: 179.
6.
Pažek, K., Turk, J., Hari, S., Rozman, Č., Prišenk, J. (2014): Multi-criteria and econometric evaluation of dairy products, Mljekarstvo 64 (2), 127-136.
7.
Pearson, D., Henryks, J., Trott, A., Jones, P., Parker, G., Dumaresq, D., Dyball, R. (2011): Local Food: Understanding Consumer Motivations in Innovative Retail Formats, British Food Journal 133 (7), 886-899. doi: 10.1108/00070701111148414
8.
Pirog, R., Bregendahl, C. (2012): Creating Change in the Food System: The role of regional food networks in lowa. Available online: http://www.ams.usda.gov/AMSv1.0/ getfile?dDocName=STELPRDC5105337 (15.9.2014.).
Sažetak Cilj rada je analizirati ekonomske koristi uključenosti poljoprivrednika u male i srednje velike prehrambene lance temeljene na vrijednosti proizvoda. Istraživanjem su prikupljeni podatci pomoću kojih je razvijen ekonometrijski model. Empirijski rezultati pokazuju pozitivne ekonomske koristi. Na općoj razini, to znači stabilniju otkupnu cijenu sirovog mlijeka za mliječne farme koje su dio prehrambenog lanca temeljenog na vrijednosti. Rezultati pokazuju neelastičnu potražnju za mlijekom i proučavanim mliječnim proizvodima. Nadalje, tu se pokazuju i neke društvene koristi, kao što je proizvodnja visokokvalitetnih prehrambenih proizvoda, stabilnija i postojana potražnja za sirovim
237
238 9.
J. PRIŠENK et al.: The economic viability of value-based food chain, Mljekarstvo 66 (3), 231-238 (2016)
Pöldaru, R., Roots, J., Viira, AN. (2005): Estimating econometric model of average total milk cost: A support vector machine regression approach, Economics and rural development 1 (1), 23-31.
10. Prišenk, J. (2015): The effects of value based agro-food chain on the socio-economic situation of dairy farms in mountain regions. Ph. D. Thesis. University of Maribor, Faculty of Agriculture and Life Sciences, 138 pp. 11. Prišenk, J., Rozman, Č., Pažek, K., Turk, J., Bohak, Z., Borec, A. (2014): A multi-criteria assessment of the production and marketing systems of local mountain food, Renewable Agriculture and Food System 29 (4), 345-354. doi: 10.1017/S1742170513000197 12. Rozman, Č., Cvelbar, U., Tojnko, S., Stajnko, D., Pažek, K., Pavlovič, M., Vračko, M. (2012): Application of neural networks and image visualization for early forecast of apple yield, Der Erwerbs-Obstbau 54 (2), 69-76. doi: 10.1007/s10341-012-0162-y 13. Stele, A., Žavcer, I. (2014): O kmetijstvu doma in drugje po EU. Statistical office of the Republic of Slovenia. National and University Library, 56 pp. 14. Stern, D.I. (2004): Elasticities of Substitution and Complementarity. Working Papers in Economics. Rensselaer Polytechnic Institute, 52 pp. 15. Stevenson, G.W., Clancy, K., King, R., Lev, L., Ostrom, M., Smith, S. (2011): Midscale food value chains: An introduction, Journal of Agriculture, Food Systems and Community Development, 27-34. doi: 10.5304/jafscd.2011.014.007
16. Stevenson, G.W., Pirog, R. (2008): Values-Based Supply Chains: Strategies for Agrifood Enterprises- of-the-Middle. In Renewing an Agriculture-of-the Middle: Situation and Strategy for the Center of the U.S. Food System (Penn State Press), T. Lyson, G. Stevenson, and R. Welsch, eds. 17. Turk, J., Prišenk, J., Čeh, H., Prezelj, M. (2013): The econometric analysis of cereals purchase in Slovenia. 6th Conference of the Slovene Association of Agricultural Economists (DAES). Krško, 18.-19. April 2013, 123-132. 18. Vacas, L.R., Muenchhausen, S.V., Haering, A.M. (2014): Strategies for medium-sized value-based food chains during growing process with a particular focus on the business logic and management. Organicprintsl.org. Available online: http://orgprints.org/24924/7/24924. pdf (10.11.2015). 19. Viitaharju, L., Lähdesmäki, M., Kurki, S., Valkosalo, P. (2005): Food Supply Chains in Lagging Rural Regions of Finland: an SME Perspective. University of Helsinki. Available online: https://helda.helsinki.fi/bitstream/ handle/10138/17733/Publications4.pdf?sequence=1 (8.10.2015). 20. Witzke, P., Kempen, M., Dominguez Perez, I., Jansson, T., Sckokai, P., Helming, J., Heckelei, T., Moro, D., Tonini, A., Fellmann, T. (2009): Regional Economic Analysis of Milk Quota Reform in the EU. JRC Scientific and Technical Reports. European Commission. 116 pp.