David M. Bazett-Jones, and Jennifer E. Earl-Boehm are with the Department of Kinesiology, University of Wisconsin-. Milwaukee, Milwaukee, WI. The Effect of ...
Journal of Applied Biomechanics, 2012, 28, 608-615 © 2012 Human Kinetics, Inc.
An Official Journal of ISB www.JAB-Journal.com TECHNICAL NOTE
The Effect of Boundary Shape and Minima Selection on Single Limb Stance Postural Stability Stephen C. Cobb, Mukta N. Joshi, David M. Bazett-Jones, and Jennifer E. Earl-Boehm University of Wisconsin-Milwaukee The effect of time-to-boundary minima selection and stability limit definition was investigated during eyes open and eyes closed condition single-limb stance postural stability. Anteroposterior and mediolateral timeto-boundary were computed using the mean and standard deviation (SD) of all time-to-boundary minima during a trial, and the mean and SD of only the 10 absolute time-to-boundary minima. Time-to-boundary with rectangular, trapezoidal, and multisegmented polygon defined stability limits were also calculated. Spearman’s rank correlation coefficient test results revealed significant medium-large correlations between anteroposterior and mediolateral time-to-boundary scores calculated using both the mean and SD of the 10 absolute time-toboundary minima and of all the time-to-boundary minima. Friedman test results revealed significant mediolateral time-to-boundary differences between boundary shape definitions. Follow-up Wilcoxon signed rank test results revealed significant differences between the rectangular boundary shape and both the trapezoidal and multisegmented polygon shapes during the eyes open and eyes closed conditions when both the mean and the SD of the time-to-boundary minima were used to represent postural stability. Significant differences were also revealed between the trapezoidal and multisegmented polygon definitions during the eyes open condition when the SD of the time-to-boundary minima was used to represent postural stability. Based on these findings, the overall results (i.e., stable versus unstable participants or groups) of studies computing postural stability using different minima selection can be compared. With respect to boundary shape, the trapezoid or multisegmented polygon shapes may be more appropriate than the rectangular shape as they more closely represent the anatomical shape of the stance foot. Keywords: balance, postural sway, postural control Postural stability computed using stabilometry is a common method of quantifying balance. Traditionally used measures of postural stability, however, either do not account for the rate of center of pressure (COP) change and/or fail to account for the position of the COP with respect to an individual’s stability limits. Furthermore, recent research has suggested that some of the traditionally used measures, such as COP displacement, may not be appropriate for identifying postural instability (Haddad et al., 2006; Riccio, 1993; van Emmerik & van Wegan, 2000). Time-to-boundary (contact) is an approach to quantify postural stability that takes the previously mentioned spatiotemporal COP characteristics into account (Hertel et al., 2006; Riccio, 1993; Slobounov et al., 1997; van Emmerik & van Wegan, 2000). Although timeto-boundary is proving to be an important measure of double- (van Wegen et al., 2001) and single-limb (Hertel & Olmsted-Kramer, 2007) stance postural stability, two factors involved in computing the measure have yet to be Stephen C. Cobb (Corresponding Author), Mukta N. Joshi, David M. Bazett-Jones, and Jennifer E. Earl-Boehm are with the Department of Kinesiology, University of WisconsinMilwaukee, Milwaukee, WI.
608
completely investigated. The two factors are the definition of the stability limits and the number of minima used to represent an individual’s postural stability. With respect to stability limit definition, the foot is typically modeled as a rectangle with anteroposterior limits defined as the length of the foot and mediolateral limits defined as the widest portion of the foot (Figure 1). For bilateral stance position testing, however, the use of a multisegmented polygon as opposed to a rectangle has been recommended (Haddad et al., 2006). Although there does not appear to be data available to support the recommendation, Haddad et al. (2006) hypothesized that defining boundary limits as a multisegmented polygon may provide more clinically relevant data as it more closely represents the support base formed by a participant’s feet. The same argument could be made for single-limb stance position testing; however, the effect of boundary shape definition during single limb stance has not been investigated. With respect to minima selection, some investigations have used the means of all of the trial time-toboundary minima (Hertel & Olmsted-Kramer, 2007) while others included only the 10 absolute trial minima (van Wegen et al., 2001). The effect of using 10 versus multiple data points to represent an individual’s postural
Single Limb Stance Postural Stability 609
stability, however, has not been determined. It may be hypothesized that the use of more data points could provide a more complete representation of an individual’s postural stability. The purpose of the current study, therefore, was to investigate the effect of stability limit definition and minima selection on time-to-boundary measures computed during single-limb stance position testing.
Methods
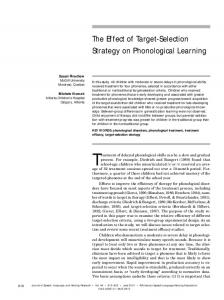
Figure 1 — For each sandal, the anteroposterior axis (y) of the local sandal coordinate system was the unit vector oriented from the midpoint of the rearfoot of the sandal to the midpoint of the forefoot of the sandal. The mediolateral axis (x) was defined as the cross product of the y axis of the local sandal coordinate system and the global vertical axis of the force plate coordinate system (Z). The origin of the local sandal coordinate system was located at the posterior heel of each sandal. Rectangular boundary limits (1a) were defined using the length of the sandal and the width of the forefoot. Trapezoidal boundary limits (1b) were defined using the length of the sandal, the widths of the forefoot and rearfoot. Multisegment polygon stability limits (1c) were defined using the length of the sandal, and the widths of the distal sandal, forefoot, rearfoot, and proximal sandal. The definition partitioned the sandal into toe (> 74.5% of the total sandal length), forefoot (21.3–74.5% of the total sandal length), and heel (< 21.3% of the total sandal length) regions.
Fifty apparently healthy participants (22 m, 28 f; age: 23.0 ± 5.1 years; mass: 73.23 ± 13.44 kg; height: 169.3 ± 11.3 cm) were recruited. Before testing, all participants provided written informed consent in accordance with institutional guidelines, and the equipment and procedures of the study were explained. Right single-limb stance position postural stability was assessed during eyes open and eyes closed conditions. All participants wore the same style sandal (Hana, Maui and Sons, Pacific Palisades, CA), and foot position on a force plate (AMTI OR6–7-2000, Advanced Mechanical Technology) was standardized using a 90° angle (Framing Wizard, Swanson Tool). The decision to test participants in a sandal versus barefoot, which is more common, was based on two considerations. First, using sandals only required the dimensions of interest to be measured one time for each sandal size versus for each participant. In addition, the size of each sandal was included in the data reduction program so that selecting the appropriate shoe size automatically associated the boundary limits to the participant versus requiring input of separate measures for each individual. Second, testing in a shod condition may be more clinically relevant since the majority of activities of daily living and recreational and sporting activities are performed in shod conditions. Postural stability trials were sampled at 100 Hz and consisted of a 30 s trial during an eyes open condition (Wikstrom et al., 2010) and three 10 s trials during an eyes closed condition (McKeon & Hertel, 2008). Performance of eyes open versus eyes closed condition testing was counterbalanced to control for learning or fatigue effects. If participants stepped down with the non-weightbearing limb or touched the non-weight-bearing limb to the weight-bearing limb during an eyes open or eyes closed condition trial, the trial was repeated. A trial was also repeated if participants opened their eyes during the eye closed condition. Following the balance trials, a custom written program (Matlab, v. 7.6.0, The MathWorks Inc, Natick, MA) was used to transform the ground reaction force data from the global force plate reference system into a local sandal reference system and compute time-to-boundary using the mean and standard deviation (SD) of all the time-toboundary minima during a trial and the mean and SD of only the 10 absolute time-to-boundary minima (Figure 1). The program also computed time-to-boundary with rectangular, trapezoidal, and multisegmented polygon defined stability limits (Figure 1). For the trapezoidal shape medial and lateral boundaries, a line from the
610 Cobb et al.
widest point of the forefoot to the widest point of the rearfoot was constructed using the equation:
more appropriate than ANOVA comparisons. Follow-up Wilcoxon signed rank tests were performed to investigate statistically Friedman test results. The significance level for all analyses was established at α = .05. In addition, Bland–Altman plots were performed to visually assess the agreement between the stability limit shape definitions (Bland & Altman, 1986).
Yi - yr = m(xi - xr ) where m is the slope of the line [( y f - yr ) / ( x f - xr )], y f - yr are the anterior and posterior coordinates of the ends of the sandal and xf and xr are the coordinates of the widest portion of the sandal forefoot and sandal rearfoot, respectively) (Figure 1). To compute the timeto-boundary in the mediolateral direction, the known anteroposterior COP position at time i was input as the yi and the mediolateral position (xi) at the known yi position was calculated. The calculated xi position was then subtracted from the known horizontal COP position at time i to compute the time-to-boundary. The same procedures were used to construct the medial and lateral borders of the multisegmented polygon and compute the time-to-boundary with the exception that three sets of medial and lateral borders were defined (Figure 1). The same procedures were also used to compute trapezoidal and multisegmented polygon stability limit anteroposterior time-to-boundary, only the above equation was solved for yi in lieu of xi, and the calculated yi position was subtracted from the known anteroposterior COP position at time i. The effect of minima selection on anteroposterior and mediolateral postural stability defined using the time-to-boundary mean and SD was investigated using the rectangular boundary shape and Spearman’s rank correlation coefficient (rho) test (SPSS v. 16.0, Chicago, IL). The strength of the relationships were determined using the recommendations of Cohen (1988) for small (r = .10–0.29), medium (r = .30–0.49), and large (r = .50–1.0) correlation coefficients. Spearman’s rho test was selected over univariate analyses of variance (ANOVA) and Pearson’s product–moment correlation coefficient because it was known a priori that the means of the 10 absolute minima versus all of the minima would be different. To investigate the effect of boundary shape definition (rectangle, trapezoid, and multisegmented polygon defined stability limits) on eyes open and eyes closed condition anteroposterior and mediolateral postural stability, Friedman Tests were conducted. Once again it was determined that the mean time-to-boundary scores could be assumed to be different due to the differing boundary definitions, therefore, the nonparametric Friedman Test was deemed
Results Spearman rho test results performed for the rectangular boundary shape anteroposterior and mediolateral timeto-boundary revealed significant medium-large positive correlations between postural stability scores based on the mean of the 10 absolute time-to-boundary minima and the mean of all time-to-boundary minima during the eyes open (anteroposterior time-to-boundary: r = .830, p < .001; mediolateral time-to-boundary: r = .873, p < .001) and closed (anteroposterior time-to-boundary: r = .923, p < .001; mediolateral time-to-boundary: r = .703, p < .001) conditions (Table 1). Similarly, Spearman rho test results of anteroposterior and mediolateral direction postural stability defined as the SD of the 10 absolute time-toboundary minima and the SD of all the time-to-boundary minima revealed significant medium-large correlations during eyes open (anteroposterior time-to-boundary: r = .404, p = .004; mediolateral time-to-boundary: r = .518, p < .001) and eyes closed (anteroposterior time-to-boundary: r = .592, p < .001; mediolateral time-to-boundary: r = .367, p = .009) conditions (Table 2). Due to the medium and large correlations between quantifying postural stability using 10 versus all timeto-boundary minima, only the data computed using all of the minima were used to investigate the effect of the three boundary shapes. While the mean and SD of the 10 absolute time-to-boundary minima or all of the time-to-boundary minima could have been selected, the mean and SD of all the time-to-boundary minima were chosen because the use of more data points to compute both the time-to-boundary mean and variability may provide additional time-to-boundary information when comparing apparently healthy and pathological groups. Results of the Friedman Tests indicated that the stability limit definition significantly affected mean mediolateral time-to-boundary scores during eyes open (χ2 (2, n = 50) = 55.720, p < .001) and eyes closed (χ2 (2, n = 50) =
Table 1 Mean (SD) anteroposterior and mediolateral time-toboundary scores (s) using the mean of the 10 absolute minima versus the mean of all minima during eyes open and eyes closed conditions with rectangular defined boundary limits Time-to-Boundary Direction (s) Anteroposterior
Mediolateral
Minima
N
Eyes open
Eyes closed
Eyes open
Eyes closed
Ten minima
50
1.02 (0.37)
0.65 (0.20)
0.35 (0.10)
0.23 (0.06)
All minima
50
4.68 (1.47)
2.34 (0.71)
1.83 (0.73)
0.98 (0.27)
Single Limb Stance Postural Stability 611
Table 2 Mean (SD) anteroposterior and mediolateral time-toboundary (s) using the standard deviation of the 10 absolute minima versus the standard deviation of all minima during eyes open and eyes closed conditions with rectangular defined boundary limits Time-to-Boundary Direction (s) Anteroposterior
Mediolateral
Minima
N
Eyes open
Eyes closed
Eyes open
Eyes closed
Ten minima
50
0.20 (0.08)
0.15 (0.04)
0.05 (0.02)
0.05 (0.01)
All minima
50
5.32 (2.08)
2.48 (1.07)
2.58 (1.61)
1.37 (0.64)
55.560, p < .001) conditions. Mean anteroposterior timeto-boundary during the eyes open (χ2 (2, n = 50) = 0.484, p = .785) and eyes closed (χ2 (2, n = 50) = 3.647, p = .161) conditions, however, were not significantly affected by boundary limit definition (Table 3). Results of follow-up Wilcoxon signed rank test results revealed significantly different rank differences between the rectangular and trapezoid stability limit shapes during the eyes open (z = –5.874, p < .001) and eyes closed (z = –5.768, p < .001) conditions and between rectangular and multisegment polygon during the eyes open (z = –5.121, p < .001) and eyes closed (z = –5.333, p < .001) conditions (Table 4). The difference between the trapezoid and multisegment polygon definitions were not significantly different during the eyes open (z = –0.719, p = .472) or eyes closed (z = –1.443, p = .149) conditions (Table 3). Examination of the Bland–Altman plots suggest much greater variability between the rectangular and multisegment polygon shape definitions than between the rectangular and trapezoid definitions (Figure 2). Friedman Test results for time-to-boundary SD also indicated that the stability limit definition significantly affected mean mediolateral time-to-boundary scores during eyes open (χ2 (2, n = 50) = 32.760, p < .001) and
eyes closed (χ2 (2, n = 50) = 28.840, p < .001) conditions. Mean anteroposterior time-to-boundary during the eyes open (χ2 (2, n = 50) = 0.013, p = .993) or eyes closed (χ2 (2, n = 50) = 0.510, p = .775) conditions, however, were not significantly affected by boundary limit definition (Table 5). Results of follow-up Wilcoxon signed rank test results for the mediolateral time-to-boundary scores revealed significantly different rank differences between the rectangular and trapezoid stability limit shapes during the eyes open (z = –4.793, p < .001) and eyes closed conditions (z = –5.382, p < .001) and between rectangular and multisegment polygon during the eyes open (z = –3.412, p = .001) and eyes closed (z = –2.968, p = .003) conditions (Table 6). Examination of the Bland–Altman plots suggests much greater variability between the rectangular and multisegment polygon shape definitions than between the rectangular and trapezoid definitions (Figure 3). For the trapezoid and multisegment polygon stability limit shapes, the difference was significant during the eyes open (z = –2.003, p = .045) condition but not the eyes closed (z = –1.713, p = .087) condition (Table 4). The Bland–Altman plot of the trapezoid and multisegment polygon during the eyes open also suggests that there was large variability between the ± 2 SD thresholds (Figure 3).
Table 3 Friedman rank test results using mean time-to-boundary as the measure of postural stability Time-to-Boundary Direction Anteroposterior
Mediolateral
Percentile
Percentile
N
Mean rank
25th
50th (Md)
75th
Mean rank
25th
50th (Md)
75th
Rectangle
50
2.07
3.59
4.30
5.45
2.86
1.33
1.60
2.13
Trapezoid
50
1.97
3.59
4.25
5.35
1.62
1.18
1.35
1.90
Multisegmented Polygon
50
1.96
3.41
4.29
5.44
1.52
1.17
1.48
1.83
Rectangle
50
2.15
1.94
2.15
2.84
2.86
0.78
0.95
1.18
Trapezoid
50
2.03
1.94
2.15
2.69
1.60
0.70
0.84
1.06
Multisegmented Polygon
50
1.82
1.92
2.10
2.84
1.54
0.72
0.81
1.02
Minima Eyes open
Eyes closed
Table 4 Mean (SD) anteroposterior and mediolateral time-to-boundary scores (s) using the mean of all minima during eyes open and eyes closed conditions with rectangular, trapezoidal, and multisegmented polygon defined boundary limits Time-to-Boundary Direction (s) Anteroposterior N
Boundary Shape
Eyes open
Mediolateral
Eyes closed
Eyes open
Eyes closed
Rectangular
50
4.68 (1.47)
2.34 (0.71)
1.83 (0.73)*†‡
0.98 (0.27)*†‡
Trapezoidal
50
4.56 (1.38)
2.28 (0.65)
1.58 (0.61)*†
0.87 (0.23)*†
Multisegmented Polygon
50
4.64 (1.48)
2.33 (0.71)
1.61 (0.65)*‡
0.86 (0.22)*‡
*Significant Friedman rank test. †Significant follow-up Wilcoxon signed rank test between the rectangular and trapezoidal boundary shapes. ‡Significant follow-up Wilcoxon signed rank test between the rectangular and multisegmented polygon boundary shapes.
a)
b)
c) Figure 2 — Mediolateral direction eyes closed condition Bland–Altman plots using the mean time-to-boundary minima score for the following: (a) rectangle (TTBMLc.mean.rectangle) and trapezoid (TTBMLc.mean.trapezoid) boundary shapes; (b) rectangle (TTBMLc.mean.rectangle) and multisegment polygon (TTBMLc.mean.polygon) boundary shapes; and (c) trapezoid (TTBMLc.mean. trapezoid) and multisegment polygon (TTBMLc.mean.polygon) boundary shapes. The mediolateral direction eyes open condition plots are not pictured, but were very similar to the mediolateral direction eyes closed condition plots.
612
Single Limb Stance Postural Stability 613
Table 5 Friedman rank test results using time-to-boundary SD as the measure of postural stability Time-to-Boundary Direction Anteroposterior
Mediolateral
Percentile
Percentile
N
Mean rank
25th
50th (Md)
75th
Mean rank
25th
50th (Md)
75th
Rectangle
50
2.01
3.92
4.95
6.66
2.66
1.58
1.99
3.21
Trapezoid
50
1.99
3.92
4.77
6.58
1.70
1.37
1.74
2.90
Multisegmented Polygon
50
2.00
3.74
4.88
6.77
1.64
1.28
1.73
2.37
Rectangle
50
2.07
1.87
2.23
2.73
2.62
0.88
1.24
1.79
Trapezoid
50
1.95
1.87
2.23
2.66
1.68
0.79
1.14
1.61
Multisegmented Polygon
50
1.98
1.74
2.29
2.94
1.70
0.82
1.03
1.32
Minima Eyes open
Eyes closed
Table 6 Mean (SD) anteroposterior and mediolateral time-to-boundary (s) using the standard deviation of all minima during eyes open and eyes closed conditions with rectangular, trapezoidal, and multisegmented polygon defined boundary limits Time-to-Boundary Direction (s) Anteroposterior
Mediolateral
Boundary Shape
N
Eyes open
Eyes closed
Eyes open
Eyes closed
Rectangular
50
5.32 (2.08)
2.48 (1.07)
2.58 (1.62)*†‡
1.37 (0.64)*†‡
Trapezoidal
50
5.23 (2.04)
2.40 (1.01)
2.30 (1.44)*†§
1.23 (0.57)*†
Multisegmented polygon
50
5.46 (2.57)
2.59 (1.31)
2.07 (1.19)*‡§
1.10 (0.42)*‡
*Significant Friedman rank test. †Significant follow-up Wilcoxon signed rank test between the rectangular and trapezoidal boundary shapes. ‡Significant follow-up Wilcoxon signed rank test between the rectangular and multisegmented polygon boundary shapes. §Significant follow-up Wilcoxon signed rank test between the trapezoidal and multisegmented polygon boundary shapes.
Discussion The purpose of the current study was to investigate the effect of minima and boundary shape selection on single limb stance time-to-boundary. With respect to minima selection, the results suggest there is a moderate-strong positive correlation between computing single limb stance postural stability during eyes open or eyes closed conditions using the 10 absolute time-toboundary minima and all time-to-boundary minima. Therefore, although the values of studies using the different minima selection cannot be compared, the comparison of overall results (i.e., stable versus unstable participants or groups) is appropriate. This information may be important for future studies such as systematic reviews of literature that may synthesize previous literature to provide research-based evidence for balance focused rehabilitation protocols or to draw generalizations regarding the effect of a pathology (i.e., chronic ankle instability) on balance.
With respect to boundary shape definitions, ranking of participants based on anteroposterior time-to-boundary scores did not differ significantly between the three boundary shapes. The lack of significance was likely because the anterior and posterior stability limits only differ between the boundary definitions when the COP position is very close to the mediolateral stability limits (Figure 1). It is likely, however, that COP either does not reach the extreme mediolateral positions, or if the extreme positions are reached, balance would likely be lost. In the current protocol, the data from the latter case would have been discarded and the trial repeated. Ranking of participants based on mediolateral time-to-boundary scores, however, was significantly affected by the boundary limit definition. Rankings were significantly different between the rectangular boundary shape and both the trapezoid and multisegment polygon definitions when either the mean or SD of the time-toboundary minima were used to define postural stability (Tables 4 and 6). The difference likely occurred for
614 Cobb et al.
a)
b)
c) Figure 3 — Mediolateral direction eyes closed condition Bland–Altman plots using the SD time-to-boundary minima score for thefollowing: (a) rectangle (TTBMLc.SD.rectangle) and trapezoid (TTBMLc.SD.trapezoid) boundary shapes and (b) rectangle (TTBMLc.SD.rectangle) and multisegment polygon (TTBMLc.SD.polygon) boundary shapes. The mediolateral direction eyes open condition plots for the above comparisons are not pictured, but were very similar to the mediolateral direction eyes closed condition plots. Plot (c) is the mediolateral direction eyes open condition Bland–Altman plot of the trapezoid (TTBMLo.SD.trapezoid) and multisegment polygon (TTBMLo.SD.polygon) boundary shapes.
participants in whom the COP moved into the regions of the forefoot where the mediolateral stability limits differ for the trapezoid and multisegment polygon shapes (Figure 1). Ranking of individuals using the mean of the time-to-boundary minima was not significantly different between the trapezoid and multisegment polygon definitions. The lack of difference was likely due to the similarities in the shape of the forefoot regions for the two definitions. The only difference between the trapezoidal and multisegmented polygon shapes occurred in the mediolateral direction during the eyes open condition when the time-to-boundary shape SD was used to define postural stability. The difference may have been due to the larger variability during the eyes open versus eyes closed condition (Table 6). During the less challenging eyes open condition greater participants may have allowed the COP
to move distally and proximally in the forefoot region. Although the shapes of the trapezoid and multisegment polygon definitions appear similar, in the forefoot region, the widths differ. The maximum widths (maximal sandal forefoot and rearfoot widths) for the trapezoid shape were considered to be located at the toe and heel tip whereas the corresponding widths for the multisegment polygon defined the proximal and distal ends of the forefoot region (Figure 1). Observation of the Bland–Altman plot also suggests the greatest variability between the trapezoid and polygon shape definitions occurred when mean score differences were greatest (Figure 3c). Had the endpoints of the trapezoid been located at the widest part of the forefoot and rearfoot and the foot endpoints extrapolated such that the toe and heel tip were allowed to become wider proximally and more narrow distally
Single Limb Stance Postural Stability 615
than the widest portions of the forefoot and rearfoot, the forefoot regions of the boundary definitions would have been identical and the difference may not have occurred. During the more challenging eyes closed condition, however, variability was decreased which may suggest that participants maintained the COP position in the more proximal regions of the forefoot where the trapezoid and multisegment polygon borders were most similar (Table 6). While there is no concrete evidence to recommend one stability limit definition over another, the selection of a boundary shape does significantly affect mediolateral time-to-boundary scores. Either the trapezoidal or multisegment polygon definitions may be recommended because the shapes more closely represent the shape of the stance foot, whereas the rectangular definition overestimates the regions distal and proximal to the forefoot. As a result, the rectangular boundary shape may not be as sensitive to changes in time-to-boundary mean and SD scores. Thus, boundary shape definition, may be an important consideration for future studies investigating the effect of pathologies or interventions on single limb stance postural stability. This study investigated the effect of time-to-boundary minima selection and boundary shape definition on single limb stance postural stability. Results of the study suggest that definition of postural stability as the mean or SD of the 10 time-to-boundary minima versus all timeto-boundary does not significantly affect the ranking of apparently healthy individuals based on time-to-boundary scores. Boundary shape, on-the-other hand, does significantly affect mediolateral time-to-boundary scores when postural stability is defined as either the mean or SD of the time-to-boundary. These data may assist future researchers and clinicians in drawing generalizations from the time-to-boundary literature. The results may also assist researchers designing future studies utilizing time-toboundary to quantify single limb stance postural stability. Acknowledgments The authors would like to thank Susan E. Cashin for her assistance with the statistics.
References Bland, J.M., & Altman, D.G. (1986). Statistical methods for assessing agreement between two methods of clinical measurement. 1, 307–310. Cohen, J. (1988). Statistical Power Analysis for the Behavioral Sciences (2nd ed.). New Jersey: Lawrence Erlbaum Associates. Haddad, J.M., Gagnon, J.L., Hasson, C.J., Van Emmerik, R.E., & Hamill, J. (2006). Evaluation of time-to-contact measures for assessing postural stability. Journal of Applied Biomechanics, 22, 155–161. PubMed Hertel, J., & Olmsted-Kramer, L.C. (2007). Deficits in timeto-boundary measures of postural control with chronic ankle instability. Gait & Posture, 25, 33–39. PubMed doi:10.1016/j.gaitpost.2005.12.009 Hertel, J., Olmsted-Kramer, L.C., & Challis, J.H. (2006). Timeto-boundary measures of postural control during single leg quiet standing. Journal of Applied Biomechanics, 22, 67–73. PubMed McKeon, P.O., & Hertel, J. (2008). Spatiotemporal postural control deficits are present in those with chronic ankle instability. BMC Musculoskeletal Disorders, 9, 76. PubMed doi:10.1186/1471-2474-9-76 Riccio, G.E. (1993). Information in Movement Variability About the Qualitative Dynamics of Posture and Orientation. In K.M. Newell & D.M. Corcos (Eds.), Variability and Motor Control (pp. 317–357). Champaign, IL: Human Kinetics. Slobounov, S.M., Slobounova, E.S., & Newell, K.M. (1997). Virtual Time-to-Collision and Human Postural Control., 29, 263–281. van Emmerik, R.E.A., & van Wegan, E.E.H. (2000). On variability and stability in human movement. Journal of Applied Biomechanics, 16, 394–406. van Wegen, E.E.H., Van Emmerick, R.E.A., Wagenaar, R.C., & Ellis, T. (2001). Stability boundaries and lateral postural control in Parkinson’s disease. Motor Control, 5(3), 254–269. PubMed Wikstrom, E.A., Fournier, K.A., & McKeon, P.O. (2010). Postural control differs between those with and without chronic ankle instability. Gait & Posture, 32(1), 82–86. doi:10.1016/j.gaitpost.2010.03.015
Copyright of Journal of Applied Biomechanics is the property of Human Kinetics Publishers, Inc. and its content may not be copied or emailed to multiple sites or posted to a listserv without the copyright holder's express written permission. However, users may print, download, or email articles for individual use.