traditional instructional method, computer assisted instruction (CAI) and teacher facilitated .... (2010) had also highlighted similar kind of facts, where teacher facilitated ..... Patterns of changeâ (Apple Classrooms of Tomorrow Report No. 8).
International Journal of Education and Development using Information and Communication Technology (IJEDICT), 2014, Vol. 10, Issue 4, pp. 47-59
The effect of computer based instructional technique for the learning of elementary level mathematics among high, average and low achievers Muhammad Tanveer Afzal Allama Iqbal Open University, Islamabad, Pakistan Bashir Gondal Punjab Examination Commission, Pakistan Nuzhat Fatima IMCG Korang Town, Islamabad, Pakistan ABSTRACT The major objective of the study was to elicit the effect of three instructional methods for teaching of mathematics on low, average and high achiever elementary school students. Three methods: traditional instructional method, computer assisted instruction (CAI) and teacher facilitated mathematics learning software were employed for the teaching of three chapters of six class mathematics textbook (Integers, Algebra and Geometry). Interactive software was developed, using the contents of these three chapters. Two urban and two rural schools were selected containing a male and a female school. Seventy eight students from each of the four randomly selected schools were randomly selected and assigned in to three groups. On the basis of pretest the students were identified as low, average and high achievers. After the treatment a post test was conducted. The score of the students were analyzed that revealed teacher facilitated mathematics instructional method produced better score when compared with CAI and traditional instructional methods of teaching mathematics for low and average achievers, but no significant difference was observed between instructional techniques for high achievers. It raises the questions; why instructional techniques not affected the high achievers scores? What kind of provisions may be added in the next version of the instructional software? Keywords: Pakistan, Punjab province, Mathematics Education, Teaching Technologies, High and Low Achievers, Teacher facilitated Software Technique and Computer Based Teaching INTRODUCTION th
According to the National Education Assessment System (NEAS, 2007) report, students of 4 th and 8 grades remained underachievers in the subject of mathematics when measured by the National Achievement Tests administered in 2006 and 2007. Similar findings were reported by the Punjab Education Assessment System (PEAS) in the same years. This consistency in the results over the years confirmed the under achievements throughout the country both across four provinces and federally administrated areas. The problem identified by NEAS and PEAS need some specific measures to overcome. They also identified that students are weak in contents of geometry, sets and algebra. In order to overcome these shortcomings, there is a dire need for a comprehensive set of strategies to be followed. National and provincial assessment reports revealed that major components of the underachievement in mathematics are contents of algebra and geometry. The
48
IJEDICT
instructional techniques and strategies and their effectiveness may also be an important factor contributing towards the underachievement of the students in mathematics. Many research attempts (Mahmood 2004, Tabassum 2004, Vergnaud 1997 and Seeger and Steinbring 1994) addressed the similar problems across the globe but no comprehensive solution is available. In order to address this issue there is a need to understand the nature of mathematics and different ways of teaching mathematics. Teachers are using same techniques for students of different achievement levels and background. It highlighted the need to use different techniques for the different ability groups. In this study the researchers tried to answer the question “which instructional technique works well” by formulating the following three null hypotheses. 1. There is no significant difference between the scores of the three groups of low achievers students taught using traditional method, mathematics software method and teacher facilitated mathematics software method. 2. There is no significant difference between the scores of the three groups of average achievers students taught using traditional method, mathematics software method and teacher facilitated mathematics software method. 3. There is no significant difference between the scores of the three groups of high achievers students taught using traditional method, mathematics software method and teacher facilitated mathematics software method. NATURE OF MATHEMATICS According to Vergnaud (1997) many questions have been raised by the teachers and researchers about the nature of mathematical knowledge, but no simple answer is available. Many mathematics educators think mathematics activity as a timely discovering of the truth and totally independent of the culture and disciplines. They are pointing towards the numeration or learning of the basic arithmetic skills (+, -, ×, ÷). Ernest (1994) has also reported the same fact about discovery learning saying that discovery learning assumes that mathematical knowledge is preexisting. Researchers of the present era (Bokhove and Drijvers 2012, Ferguson 2014 and Festus 2013) are more focused towards the use of constructivism, especially in teaching of science and mathematics. The basic assumption behind this philosophy is that "the evolving organism must adapt to the environment in order to survive". Reflecting that mathematics learning is active, the discipline of mathematics has witnessed changes with the environment and the new trend towards technology needs some more basic changes in order to make mathematics more compatible with our societal context. The mathematics learner should be allowed to construct knowledge in their own cultural and social context. The software used for this particular study was designed on the philosophy of active involvement of the students. The purpose of active involvement was achieved by incorporating hinting and feedback strategies emerging from the local teachers and educators. TEACHING OF MATHEMATICS The diverse nature of the mathematical knowledge demands different strategies from the teachers in the classroom. Many studies (Afzal and Gondal 2010, Mahmood 2004 and Tabassum 2004) have highlighted that in Pakistan the teachers are following a traditional teaching method that is Chalk and Board method. This method is appropriate while teaching the basic operations and facts. But according to Seeger and Steinbring (1994) it reflects only one side of the coin, the
Elementary level mathematics among high, average and low achievers
49
traditional teaching process in mathematics classroom tend to beginning of the universal epistemological basis. The frequent use of computers for teaching of mathematics demands development of new software that may be embedded in the local context. Therefore there is a need to provide enough knowledge and skills to the teachers that consequently help to develop a more positive attitude towards the use of technology for teaching (Afzal, et.al. 2011). Technology has already changed the way educators teach. Shelly, Cashman, et.al. (2002) have identified that most of the teachers are using multimedia during instruction. Many researchers (Black and McClintock 1995, Richards 1998, Brush and Saye 2000 and Katmada, Mavridis, and Tsiatsos 2014) have studied the impact of constructivism on classroom practices for the purpose of integration of technology in teaching learning process, due to potential of technological embedded pedagogical techniques. Dwyer, Ringstaff, and Sandholtz (1990) as cited in Imel (1992) and Robinson (2012) were of the view that providing immediate access to technology mean free hand to construct their own knowledge in the classroom substantially changes the teaching learning process. Multiple studies (Black and McClintock 1995, Richards 1998, Brush and Saye 2000 and Katmada, Mavridis, and Tsiatsos 2014) pointed to the benefit of using technology to enhance student learning elementary school language, arts, science, and mathematics; middle school language, arts, science, mathematics, and social studies; and high school mathematics, science, and writing. According to Owens and Waxman (1994) the students got higher scores in the computer assisted instruction (CAI) group in Geometry but no differences in Algebra. The study of Afzal and Gondal (2010) had also highlighted similar kind of facts, where teacher facilitated mathematics software group outperformed the students taught through traditional method and CAI for both male and female groups. In the present scenario (Ahmad and Latih 2010, Boon 2009, Casey, 2012 and Clark-Wilson, Robutti, and Sinclair 2014) many companies and research groups are trying to develop the software and to see their effect on learning achievement (Kaput 1992, Brown 2001, Chen 2005, Chang 2002, McKethan, Everhart & Stubblefield 2000 and Yildirim, Ozden, & Aksu 2001). CONTEXT OF THE STUDY Very few efforts of teaching with computers in Pakistani context had been witnessed, and its effectiveness for the different achievement groups (High, Average and Low). Therefore there was need to conduct a study in mathematics that provided evidence of its effectiveness for high, average and low achievers in Pakistani teaching learning context. The researchers investigated the role of mathematics software, used for improving students learning achievements in mathematics at elementary level across different achievement levels. The study also explored the effect of different instructional techniques for high, average and low achievers. METHODOLOGY The investigation of the effect of different teaching strategies on teaching of mathematics at elementary level is a contribution towards identification of improvement in educational instructional methods. It was an experimental study to examine the effect of independent variables; traditional instructional method, mathematics software instruction and teacher facilitated mathematics software instruction on the achievements of high average and low achievers measured by mathematics test prepared by the researchers. The researchers formulated three hypotheses as already stated and developed software the details are discussed in the following section.
50
IJEDICT
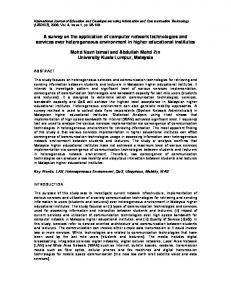
DEVELOPMENT OF SOFTWARE The new paradigm of teaching-learning process need interactivity that demands more efforts from the teachers, assuming that mathematical knowledge can be socially constructed and teacher is capable to provide the learning environment where students can actively participate. Therefore, after presentation of the concept the examples were provided to the students. These examples provided basis for the exercises that were the part of each lesson, students were involved in assessment and feedback was provided for the assessment component whereas hints were given for exercises. This was the basic structure on which the software was designed. Developing teaching software is a complex process, as it requires the basic philosophy, content selection, appropriate delivery, programming and the user-interface that is user friendly. For this th purpose three teaching units for 6 grade mathematics were selected and modified. Minor changes were made to have units compatible with the software requirements in consultation with the programmers and subject experts. The modified units were validated by opinion of subject experts and teacher teaching mathematics at grade six, and were used to develop the software for imparting instruction to the experimental-1 and experimental-2 groups. Three teachers, currently teaching mathematics at elementary level, a programmer, quality assurance personnel and user interface designer were employed for the formative evaluation of the software. Software evaluation rubric recommended by Shelly, Cashman, Gunter and Gunter, (2003) was used for this purpose. The teachers contributed towards the content, ease of use and the component of assessment, as well as provided comprehensive list of suggestions which helped to enhance the instructional quality of the software. A programmer (other than developers) went through the coding of the software and suggested changes which were discussed with the developers in a meeting and incorporated accordingly. The quality assurance personnel added valuable suggestions towards the animation, graphics and feedback prompts where a user interface designer helped in adjusting the area of main frame and the mini frames of the program. Piloting th of the first version was done with forty students of 6 grade, researchers and mathematics teacher of the school remained present during the piloting process and noted the points highlighted by the students. This effort consequently produced software for teaching of th mathematics at 6 grade level and was used for this study. The main frame of the software is given in Figure 1. The far right area (No. 1) of the screen presented the three major content areas. Users were allowed to enter the lessons after selecting the major content area first. Then clicking the lesson number allowed the users to navigate through the lesson. The area of the screen to the left of the University monogram (No. 3) presented the learning outcomes desired to be mastered during the lesson. The instructional manual and the installation instructions are presented in the software manual.
Elementary level mathematics among high, average and low achievers
51
Figure 1: Main Frame of the Mathematics Software The researchers randomly selected four schools from Punjab province to conduct the experiment. One school from each stratum (Urban, Rural, Male and Female) was sampled. Seventy eight students of class six from each school were randomly assigned to three groups. First group was taught using traditional teaching method, where teacher used chalk and board and students noted the questions in their note books and reproduced the same in their homework copy in the next day, this group was named as control group. The second group was taught in the computer lab in this group the students studied on their own pace and they were free to move through the lesson, teacher and the lab assistant were present to guide them for the use of computer and software, lab assistant helped to resolve the hardware problems. Computer assisted instruction was the teaching technique used for experimental group 1. The third group was taught in the computer lab; teacher facilitated learning in this group by helping the students to grasp the concepts, answered students' questions and gave explanations using chalk and board where necessary. Students were free to ask questions and seek help from the teacher. The lab assistant remained with this group during instruction to help students in using software and solving hardware problems that saved much of the students’ time. The intervention prolonged for ten weeks. Pre-test post-test control group experimental design was employed to explore the information regarding the effectiveness of the different teaching strategies for high, average and low achievers used for the experiment. Before the start of the experiment a pre-test was conducted. Scores obtained by the students on the pre-test were used to label the students as high, average and low achievers. The students scoring 60% or above were considered as high achievers, the scores of the average achievers were from 40% to 59%, whereas the students scoring below 40% percent were labelled as low achievers for the purpose of the data analysis. The labels were not disclosed to students and the
52
IJEDICT
teachers' involved in the experiment. After the intervention of ten weeks a post test was conducted and the data were analysed using inferential statistics. DATA ANALYSIS AND INTERPRETATION The data were analyzed by using ANOVA statistics to test the significant differences caused by the different instructional methods on low achievers, average achievers and high achievers. According to Gay (1996) ANOVA compares the amount of between-groups variance in individuals’ scores with the amount of within groups' variance whereas Post hoc testing applied later provided differentiation among variables by creating the homogeneous groups. The first hypothesis stated no significant difference between the different instructional techniques on low achievers when measured by the post-test. In order to obtain answer to the question the researchers employed ANOVA on the score obtained through post-test. The summary of ANOVA statistics is presented in Table 1. Table 1: ANOVA Statistics for Overall Comparison of Instructional Methods on Post-test Scores of low Achievers Sum of Squares
Df
Mean Square
F
Sig.
1848.574
2
924.287
8.676
.000
6711.244
63
106.528
8559.818 Level of Confidence α=0.05
65
Between Groups Within Groups Total
The ANOVA results F(2,63)=8.676 are significant at α=0.05 level of confidence to reject the null hypothesis that there is no significant difference between the mean scores of the three groups as measured by the achievement test. It indicated that there is at least one group which performed different from the others. Therefore there was a need to identify the group that is different from the others; for this purpose the descriptive statistics was employed and the summary is given in table 2 below. Table 2: Descriptive Statistics of Instructional Groups on the Scores of Post-test of Low achievers Instructional Groups Control Experimental I Experimental II Total
N
Mean
21
46.90
Std. Deviation 9.648
21
52.10
11.086
24
59.62
66
53.18
Std. Error 2.105
Minimum
Maximum
42.51
51.30
2.419
47.05
57.14
10.197
2.082
55.32
63.93
11.476
1.413
50.36
56.00
Elementary level mathematics among high, average and low achievers
53
The mean scores indicated that all the three groups were different. The control group mean score (M=46.90) was the minimum whereas the mean score (M=59.62) of the Experimental II group was maximum. The mean score of the Experimental I group remained in between the mean scores of the two treatment groups. In order to further investigate the difference between the groups when the ANOVA results are significant to reject the null hypothesis the post-hoc test helped to identify the difference between the groups. The Scheffe, post hoc test were applied to determine which group was different. The summary of the Scheffe test is given in Table 3. Table 3:
Summary of Scheffe Statistics on Post-test Scores of Low Achievers for Multiple Comparisons
(I) Group Control
Experimental I Experimental II
Mean Difference (I-J) -5.190 * -12.720
Experimental I
Control Experimental II
Experimental II
(J) Group
Sig.
3.185 3.084
.272 .001
5.190
3.185
.272
-7.530
3.084
.058
*
3.084
.001
7.530
3.084
.058
12.720
Control Experimental I
Std. Error
* The mean difference is significant at the .05 level. The Scheffe test indicated statistically significant difference between the groups at α=0.05 level of confidence between control and Experimental group-2. There was a difference between the mean scores of the control and experimental-1 groups of low achievers students, but not statistically significant. Similarly no significant difference was found between experimental group-1 and Experimental group-2. Scheffe statistics divided these groups in to homogeneous subsets, and the results are reported in Table 4. Table 4: Homogenous Grouping on Post-test Scores of Low Achievers Group
N 1
Control Experimental I Experimental II Sig.
21 21 24
Subset for alpha = .05 2 46.90 52.10
.258 Means for groups in homogeneous subsets are displayed.
52.10 59.62 .062
Only two groups were generated, showing that there was no difference between the mean scores control and experimental-1 groups of the low achievers. And also no difference was found between the mean scores experimental-1 and experimental-2 groups of the low achievers.
54
IJEDICT
The second hypothesis of the study stated the no significant difference caused by the different instructional techniques on average achievers when measured by the post test. In order to test this hypothesis the researchers again used ANOVA on the score obtained through post-test. The ANOVA statistics compared the groups for the justification of the effect of instructional methods used for the treatment of different groups. The summary of ANOVA statistics is presented in Table 5. Table 5: ANOVA Statistics for Overall Comparison of Instructional Methods on Post-test Scores of Average Achievers Sum of Squares Between Groups Within Groups Total
4439.880
10464.852 14904.733 Level of Confidence α=0.05
Df
Mean Square
2
2219.94
199 201
52.587
F
Sig. 42.214
.000
The ANOVA results F(2,199)=42.21 are significant at α=0.05 level of confidence to reject the null hypothesis that there is no significant difference between the mean scores of the three groups of average achievers as measured by the achievement test. It indicated that there was at least one group which performed different from the others. Therefore there was a need to identify the group that was different from the others; for this purpose the descriptive statistics was employed the summary is given in Table 6 below. Table 6: Descriptive Statistics of Instructional Groups on the Scores of Post-test of Average Achievers Instructional Groups Control Experimental I Experimental II Total
N
Mean
68
52.50
Std. Deviation 6.370
68
57.46
6.838
66
63.98
202
57.92
Std. Error .773
Minimum
Maximum
50.96
54.04
.829
55.80
59.11
8.424
1.037
61.91
66.06
8.611
.606
56.73
59.12
The mean scores indicated that all the three groups were different. The control group mean score for average achievers (M=52.50) was the minimum whereas the mean score (M=63.98) of the Experimental-2 group was maximum. The mean score (M=57.46) of the Experimental I group remained in between the mean scores of the two treatment groups. Many researchers (Gay, 1996 and Kahn & Best, 2006) recommended post-hoc statistics for the identification of odd group, where ANOVA provided evidence for the rejection of the null hypothesis. The Scheffe, post hoc test were applied to determine which group was different. The summary of the Scheffe test is given in Table 7.
Elementary level mathematics among high, average and low achievers
55
Table 7:
Summary of Scheffe Statistics on Post-test Scores of Average Achievers for Multiple Comparisons
(I) Group
(J) Group
Control
Experimental I Experimental II
Experimental I
Control Experimental II
Experimental II
Mean Difference (I-J) * -4.956 * -11.485
Control Experimental I
Std. Error
Sig.
1.244 1.253
.000 .000
4.956
*
1.244
.000
-6.529
*
1.253
.000
11.485
*
1.253
.000
6.529
*
1.253
.000
* The mean difference is significant at the .05 level. The Scheffe test indicated statistically significant difference between the groups at α=0.05 level of confidence between control, Experimental I and Experimental II groups. Scheffe statistics further categorized these groups in to homogeneous subsets, the results are reported in Table 8. Table 8: Homogenous Grouping on Post-test Scores of Average Achievers Group
N 1
Control Experimental I Experimental II Sig.
68 68 66
Subset for alpha = .05 2 52.50 57.46
1.000 1.000 Means for groups in homogeneous subsets are displayed.
63.98 1.000
The table highlighted that all the three groups were placed in three categories, indicating that none of the group is homogeneous with others. The third hypothesis of the study stated no significant difference between the different instructional techniques on high achievers when measured by the post test. In order to test this hypothesis the researchers employed ANOVA on the score obtained through post-test. The ANOVA statistics provided the statistical evidences for the effectiveness of instructional methods used for the treatment of different groups. The summary of ANOVA statistics is presented in Table 9.
56
IJEDICT
Table 9: ANOVA Statistics for Overall Comparison of Instructional Methods on Post-test Scores of High Achievers Sum of Squares Between Groups Within Groups Total
Df
Mean Square
157.870
2
78.935
1616.857
41
39.436
1774.727 Level of Confidence α=0.05
43
F
Sig. 2.002
.148
The ANOVA results F(2,41)=2.002 were not significant at α=0.05 level of confidence to reject the null hypothesis that there is no significant difference between the mean scores of the three groups of high achievers as measured by the achievement test. Therefore the null hypothesis was accepted. There may be the difference between the mean scores of the three groups but not statistically significant. CONCLUSIONS AND RECOMMENDATIONS Afzal and Gondal (2010) highlighted that teacher facilitated software instruction method may be better as compared to the mathematics software and traditional instructional methods for teaching th of mathematics at 6 grade. There was need to justify whether the software facilitated teaching of mathematics worked equally well for different groups of students based on their achievement levels. The three achievement groups were formulated named as low, average and high achievers. The data revealed that the teacher facilitated software instruction method worked better as compared to the mathematics software and traditional instructional methods for the average and low achievers groups. The results were consistent with the studies conducted by Owens and Waxman (1994), Imel (1992), Mahmood (2004) and Tabassum (2004) so it provided evidence to conclude that Teacher facilitated mathematics software method worked better for the both average and low achievers. The technology and activity based methods are being proved to be more effective than the traditional methods (Katmada, Mavridis, and Tsiatsos 2014, Ahmad and Latih 2010, Boon 2009, Casey, 2012 and Clark-Wilson, Robutti, and Sinclair 2014) the similar results were found in this study, major conclusions discussed below. The students instructed through the teacher facilitated software method outperformed their counterparts, whereas mathematics software instructional method provided better results as th compared to the traditional method of teaching mathematics to average achievers of 6 grade. These results might be due to the active involvement of the students in learning of mathematics. The researchers recommend that further research may be conducted to generalize the results of the study to the entire contents of the mathematics. Both horizontal (content areas) and the vertical (different grades) need to be researched before the large scale implementation of the software for teaching of mathematics. For the group of low achievers there was significant difference between the scores of students instructed by the traditional method and the teacher facilitated software method of teaching mathematics, whereas the mathematics software method was equally effective as traditional method and was also not different from the teacher facilitated software method, therefore there is enough evidences to use the software for low achievers. For high achievers the researchers doing work in mathematics education have to locate other methods or develop more interactive software. Although the software facilitated mathematics teaching provided better results for the low achievers, there is still a need to conduct research with the improved version of the software for teaching of mathematics. Therefore researchers
Deleted:
Elementary level mathematics among high, average and low achievers
57
recommend that more detailed hinting and feedback strategies may be incorporated in the software to facilitate the low achievers in learning of mathematics. There was no difference between the scores of the high achievers for the different instructional methods. There may be number of reasons for similar effect of three teaching methods used for high achievers. Firstly, there may be the low number of students in each group, and this was a limitation of this particular study. Secondly, there may be the different philosophy of teaching mathematics to high achievers, different techniques may be used, and more comprehensive feedback, hinting strategies, examples, and exercises may be incorporated in the software for teaching of mathematics to high achievers. REFERENCES Afzal, M. T. and Gondal, M. B. 2010, “Effect of Mathematics Software Facilitated Teaching on Students Learning”, The International Journal of Technology, Knowledge and Society, Vol. 6, No.3, pp. 111-120. Afzal, M. T., Azeem, M., Maqbool, S. and Tahirkheli, S.A. 2011, “Attitude of Mathematics Teachers Related to the Use of Computer Technology in the Classroom”, The International Journal of Learning, Vol. 18, No. 2), pp. 279-290. Ahmad, W. F. B. W. and Latih, N. H. B. A. 2010, “Development of a Mathematics courseware: Fractions”, Proceedings of the Fifteenth Asian Technology Conference in Mathematics, Kuala Lumpur, Malaysia, 17-21 December. th
Best, J. W. and Kahn, J. V. 2006, “Research in Education”, (10 ed.) New York: Pearson Education Inc. Black, J. B. & McClintock, R. O. 1995, “An interpretation construction approach to constructivist design”, Retrieved 10/31/02, 2002, from http://www.ilt.columbia.edu/publications/papers/ICON_print.html Bokhove, C. and Drijvers, P. 2012, “Effects of a digital intervention on the development of algebraic expertise”, Computers & Education, 58(1), 197-208. Boon, P. 2009, “A designer speaks: Designing educational software for 3D geometry”, Educational Designer, 1(2). Brown, K. G. 2001, “Using computers to deliver training: Which employees learn and why?” Personnel Psychology, Vol. 54, No. 2, pp. 271-297. Brush, T. and Saye, J. 2000, “Implementation and evaluation of a student-centered learning unit: A case study”, Educational Technology Research & Development, Vol. 48, No.3, pp.79100. Casey, G. 2012, “Social Media in the Math Classroom”, Learning Connections: Learning & Leading with Technology. November, 2012. (36-37). Chang, C. Y. 2002, “Does computer-assisted instruction + problem solving=improved science outcomes? A Pioneer Study”, The Journal of Educational Research, Vol. 95, No.3, pp.143-151.
58
IJEDICT
Chen, L. 2005, “Examining the Role of the Computer in EFL Instruction”, Electronic Journal for the Integration of Technology in Education, Vol. 4, pp. 30-63, Retrieved March 23, 2007, from http://ejite.isu.edu/Volume4/Chen.pdf Clark-Wilson, A., Robutti, O. and Sinclair, N. 2014, “The Mathematics Teacher in the Digital Era: An International Perspective on Technology Focused Professional Development”, (Vol. 2, Mathematics Education in the Digital Era). Dordrecht: Springer. Dwyer, D.C., Ringstaff, C. & Sandholtz, J.H. 1990, “Teacher beliefs and practices. Part I: Patterns of change” (Apple Classrooms of Tomorrow Report No. 8). Cupertino, CA: Apple Computer, Inc Ernest, P. 1994, “Constructing Mathematical Knowledge: Epistemology and Mathematical Education” London: The Falmer Press. Ferguson, T. L. 2014, “Mathematics Achievement With Digital Game-Based Learning in High School Algebra 1 Classes”, (Doctoral Dissertation). Liberty University, Lynchburg, VA. Festus, A. B. 2013, “Activity -Based Learning Strategies in the Mathematics Classrooms”, Journal of Education and Practice, 4(13), ISSN 2222-1735. Gay, L. R. 1996, “Educational Research: Competencies for Analysis and Application”, (5th Edition), New York: Macmillan Publishing reprinted by National Book Foundation. Imel, S. 1992, “Computer-assisted instruction in vocational education”, Columbus, OH: ERIC Clearinghouse on Adult, Career, and Vocational Education. (ERIC Document Reproduction Service No. ED 347 327). Kaput, J. 1992, “Technology and mathematics education”, In D.A. Grouws (Ed.) Handbook of research on mathematics and teaching and learning, pp. 515-556, New York, NY: Macmillan Publishing Company. Katmada, A., Mavridis, A. and Tsiatsos, T. 2014, “Implementing a Game for Supporting Learning in Mathematics”, The Electronic Journal of e-Learning Volume 12 Issue 3 2014, (230242). Mahmood , M. K. 2004, “A comparison of traditional method and computer assisted instruction on students’ achievement in general science”, Unpublished doctoral thesis. University of Punjab, Lahore. McKethan, R., Everhart, B. and Stubblefield, E. 2000, “The effects of a multimedia computer program on pre-service elementary teachers' knowledge of cognitive components of movement skills”, Physical Educator, Vol. 57, No. 2, pp. 58-69. Owens, E. W. and Waxman, H. C. 1994, “Comparing the effectiveness of computer-assisted instruction and conventional instruction in mathematics for African-American postsecondary students”, International Journal of Instructional Media, Vol. 21, No. 4, pp. 327-336. Richards, R. T. 1998, “Infusing technology and literacy into the undergraduate teacher education curriculum through the use of electronic portfolios”, T.H.E. Journal, Vol. 25, No. 9, pp. 46-50.
Elementary level mathematics among high, average and low achievers
59
Robinson, C. 2012, “Student Centered Approaches in Mathematics : Case studies of innovative practices”, UK: National HE STEM Program : The Higher Education Academy. Seeger, F. and Steinbring, H. 1994, “The Myth of Mathematics, In Constructing Mathematical Knowledge: Epistemology and Mathematical Education”, Edited by P. Ernest. London: The Falmer Press. Shelly, G. B., Cashman, J. J., Gunter, R. E. & Gunter, G. A. 2002, “Integrating Technology in the Classroom”, (2nd Edition) Course Technology, Division of Thomson Learning. Boston, USA. Shelly, G. B., Cashman, J. J., Gunter, R. E. and Gunter, G. A. 2003, “Integrating Technology in the Classroom”, (3rd Edition) Course Technology, Division of Thomson Learning. Boston, USA. Tabassum, R. 2004, “Effect of computer assisted instruction on secondary school students’ achievements in science”, Unpublished doctoral thesis. Arid University, Rawalpindi. Vergnaud, G. 1997, “The nature of mathematical concepts. In Learning and Teaching Mathematics: An International Perspective”, Edited by T. Nunes and P. Bryant, Psychology Press, Taylor and Francis Group. Yildirim, Z., Ozden, Y. and Aksu, M. 2001, “Comparison of hypermedia learning and traditional instruction on knowledge acquisition and retention”, The Journal of Educational Research, Vol.94, No.4, pp. 207–215.
Copyright for articles published in this journal is retained by the authors, with first publication rights granted to the journal. By virtue of their appearance in this open access journal, articles are free to use, with proper attribution, in educational and other non-commercial settings. Original article at: http://ijedict.dec.uwi.edu/viewarticle.php?id=1894